KernelExplainer(一种与模型无关的方法)的设计目的。接下来,我将演示如何将 KernelExplainer 用于在 KNN、SVM、随机森林、GBM 或 H2O 模块中构建的模型。如果你想获得更多关于 SHAP 值的背景知识,我强烈推荐用 SHAP 值解释你的模型[1],其中我仔细描述了 SHAP 值是如何从 Shapley 值中产生的,Shapley 值在博弈论中是什么,以及 SHAP 值如何在 Python 中工作。除了 SHAP,您可能需要在用 LIME 解释您的模型[2]中查看 LIME 以了解 LIME 方法, 以及在用微软的 InterpretML 解释您的模型中查看微软的 InterpretML[3]。我还在
使用 SHAP 值解释您的复杂模型
考虑这个问题:你复杂的机器学习模型容易理解吗?这意味着您的模型可以通过具有商业意义的输入变量来理解。您的变量将符合用户从先验知识中学到的期望。
Lundberg 等人在他们出色的论文解释模型预测的统一方法[5]中,提出了 SHAP(Shapley Additive exPlanations)值,它为模型提供了高水平的可解释性。SHAP 值具有两大优势:
全局可解释性——SHAP 值可以显示每个预测变量对目标变量的积极或消极贡献。这类似于变量重要性图,但它能够显示每个变量与目标的正负关系(请参阅下面的摘要图)。 局部可解释性——每个观察都有自己的一组 SHAP 值(参见下面的各个力图)。这大大增加了它的透明度。我们可以解释为什么一个案例会收到它的预测以及预测变量的贡献。传统的变量重要性算法只显示整个群体的结果,而不是每个个案的结果。局部可解释性使我们能够查明和对比这些因素的影响。
SHAP 值可以由Python 模块 SHAP 生成[6]。
模型可解释性并不意味着因果关系
重要的是要指出 SHAP 值不提供因果关系。在识别因果关系系列文章中,我展示了识别因果关系的计量经济学技术。这些文章涵盖了以下技术:回归不连续性(参见通过回归不连续性识别因果关系[7])、双重差分法(DiD)(参见通过双重差分法识别因果关系[8])、固定效应模型(参见通过固定[9]差异识别因果关系[10])效应模型[11]),以及具有因子设计的随机对照试验(参见变革管理实验设计[12])。
数据可视化和模型可解释性
数据可视化和模型可解释性是数据科学项目中不可或缺的两个方面。它们是双筒望远镜,可帮助您查看数据中的模式和模型中的故事。我写了一系列关于数据可视化工具的文章,包括 Pandas-Bokeh 使令人惊叹的交互式绘图变得容易[13]、使用 Seaborn 轻松绘制漂亮的绘图[14]、使用 Plotly 绘制强大绘图[15]和使用 Plotly 创建漂亮的地理地图[16]。或者,您可以将摘要帖子 Dataman 学习路径 — 培养技能,推动职业发展[17]添加[18]书签,其中列出了所有文章的链接。我在数据可视化文章中的目标是帮助您轻松、熟练地制作数据可视化展示和见解。此外,我在所有这些文章中为数据可视化和模型可解释性选择了相同的数据,这样您就可以看到两者是如何齐头并进的。如果您想采用所有这些数据可视化代码或使您的工作更加熟练,请查看它们。

KernelExplainer 做什么?
KernelExplainer 通过使用您的数据、您的预测以及任何预测预测值的函数来构建加权线性回归。它根据博弈论中的 Shapley 值和局部线性回归中的系数计算变量重要性值。
*KernelExplainer 的缺点是运行时间长。*如果您的模型是基于树的机器学习模型,您应该使用TreeExplainer()
经过优化以快速呈现结果的树解释器。如果您的模型是深度学习模型,请使用深度学习解释器DeepExplainer()
。SHAP Python 模块[19]还没有针对所有类型的算法(例如 KNN)专门优化算法。
在用 SHAP 值解释你的模型中,我将该函数TreeExplainer()
用于随机森林模型。为了让您比较结果,我将使用相同的数据源,但使用函数KernelExplainer()
.
我将为所有算法重复以下四个图:
汇总图:使用 summary_plot()依赖图: dependence_plot()单个观察力图: force_plot()
对于给定的观察组合力图: force_plot()
。
完整代码可在文章末尾或通过github[20]。
随机森林
首先,让我们加载用 SHAP 值解释你的模型中使用的相同数据。
import pandas as pdimport numpy as npnp.random.seed(0)import matplotlib.pyplot as pltdf = pd.read_csv('/winequality-red.csv') # Load the datafrom sklearn.model_selection import train_test_splitfrom sklearn import preprocessingfrom sklearn.ensemble import RandomForestRegressor# The target variable is 'quality'.Y = df['quality']X = df[['fixed acidity', 'volatile acidity', 'citric acid', 'residual sugar','chlorides', 'free sulfur dioxide', 'total sulfur dioxide', 'density','pH', 'sulphates', 'alcohol']]# Split the data into train and test data:X_train, X_test, Y_train, Y_test = train_test_split(X, Y, test_size = 0.2)
让我们建立一个随机森林模型并打印出变量重要性。SHAP 建立在 ML 算法之上。如果您想更深入地了解机器学习算法,可以查看我的帖子我的关于随机森林、梯度提升、正则化和 H2O.ai 的讲义[21]。
rf = RandomForestRegressor(max_depth=6, random_state=0, n_estimators=10)rf.fit(X_train, Y_train)print(rf.feature_importances_)importances = rf.feature_importances_indices = np.argsort(importances)features = X_train.columnsplt.title('Feature Importances')plt.barh(range(len(indices)), importances[indices], color='b', align='center')plt.yticks(range(len(indices)), [features[i] for i in indices])plt.xlabel('Relative Importance')plt.show()
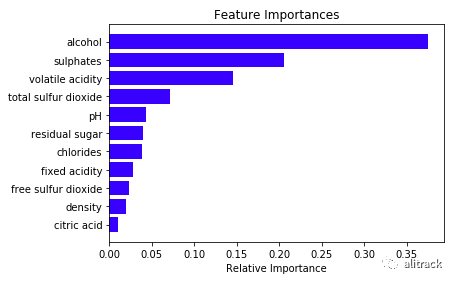
你可以从这个Github[22] pip install SHAP 。KernelExplainer()
下面的函数通过采用预测方法rf.predict
和要执行 SHAP 值的数据来执行局部回归。在这里,我使用了具有 160 个观测值的测试数据集 X_test。此步骤可能需要一段时间。
import shaprf_shap_values = shap.KernelExplainer(rf.predict,X_test)
汇总图
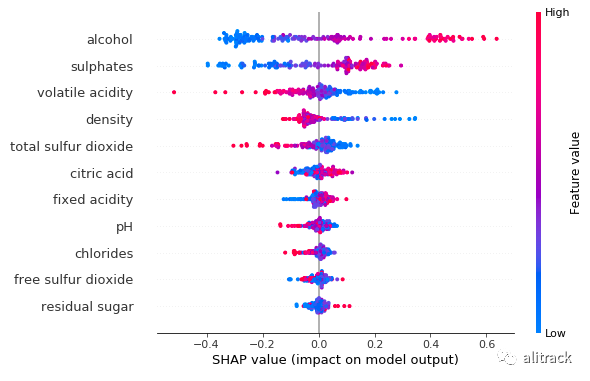
此图已加载信息。该图与常规变量重要性图(图 A)的最大区别在于它显示了预测变量与目标变量的正负关系。它看起来有点点,因为它是由训练数据中的所有点组成的。让我带你了解一下:
shap.summary_plot(rf_shap_values, X_test)
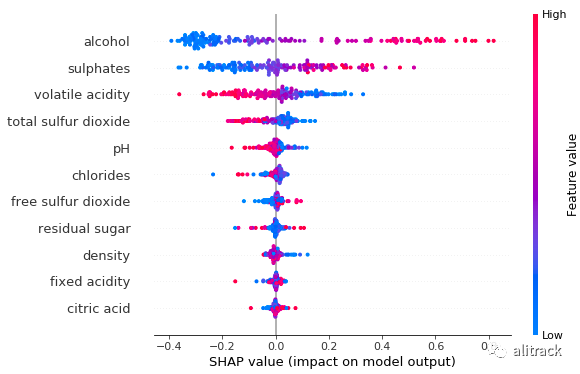
特征重要性:变量按降序排列。 影响:水平位置显示该值的影响是否与更高或更低的预测相关联。 原始值:颜色显示该变量对于该观察值是高(红色)还是低(蓝色)。 相关:一个高的酒精含量水平具有较高的和积极的质量等级的影响。高来自红色,正面影响显示在 X 轴上。同样,我们会说挥发性酸度与目标变量呈负相关。
读者可能想要输出任何汇总图。虽然 SHAP 没有内置函数,但您可以使用matplotlib
以下命令输出绘图:
import matplotlib.pyplot as pltf = plt.figure()shap.summary_plot(rf_shap_values, X_test)f.savefig("/summary_plot1.png", bbox_inches='tight', dpi=600)
依赖图
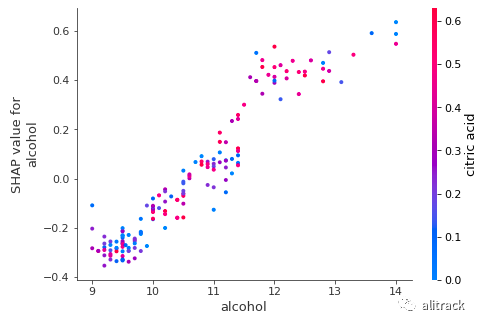
该部分依赖情节,或短的依赖情节,是机器学习成果(一个重要情节JH 2001 年弗里德曼[23])。它显示了一个或两个变量对预测结果的边际效应。它告诉目标和变量之间的关系是线性的、单调的还是更复杂的。假设我们想要得到酒精的依赖图。Python 模块 SHAP 自动包含另一个与酒精互动最多的变量。下图显示酒精与目标变量之间存在近似线性的正趋势,酒精与残糖相互作用频繁。
shap.dependence_plot("alcohol", rf_shap_values, X_test)

单个观察力图
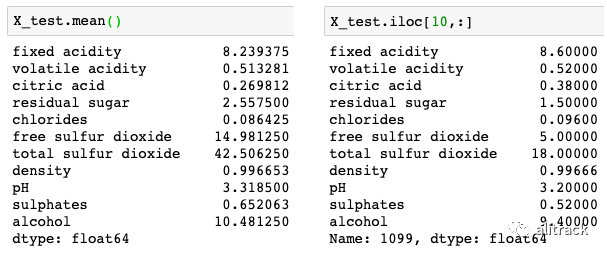
您可以为每个观察生成一个非常优雅的图,称为力图。我随意选择了 X_test 数据的第 10 个观察。下面是 X_test 的平均值和第 10 次观察的值。
Pandas 使用.iloc()
像基本 R 那样对数据帧的行进行子集化。对于其他语言开发者,你可以阅读我的帖子你是双语吗?在 R 和 Python 中流利[24],其中我比较了 R dply 和 Python Pandas 中最常见的数据整理任务。
# plot the SHAP values for the 10th observationshap.force_plot(rf_explainer.expected_value, rf_shap_values[10,:], X_test.iloc[10,:])

的输出值是该观察(对这个观察结果的预测是 5.11)的预测。 该基值:在原始论文[25]解释说,基准值 E(y_hat)是如果我们不知道电流输出的任何功能,将预测值。换句话说,它是平均预测,或 mean(yhat)。您可能想知道为什么是 5.634。这是因为 Y_test 的平均预测是 5.634。您可以通过 Y_test.mean()
哪个产生 5.634 来测试它。红色/蓝色:将预测推高(向右)的特征以红色显示,将预测推低的特征以蓝色显示。 酒精:对质量评级有积极影响。这款酒的酒精度为 9.4,低于平均值 10.48。因此它将预测推向左侧。 总二氧化硫:与质量等级呈正相关。高于平均水平的二氧化硫 (= 18 > 14.98) 将预测推向右侧。 该图以 x 轴为中心,位于 explainer.expected_value
。所有 SHAP 值都与模型的预期值相关,就像线性模型的效果与截距相关。
组合力图
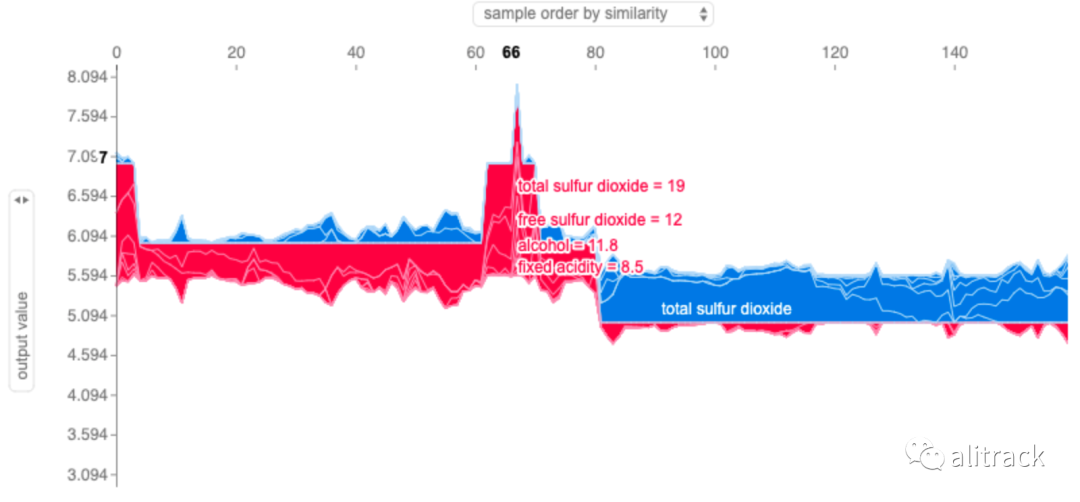
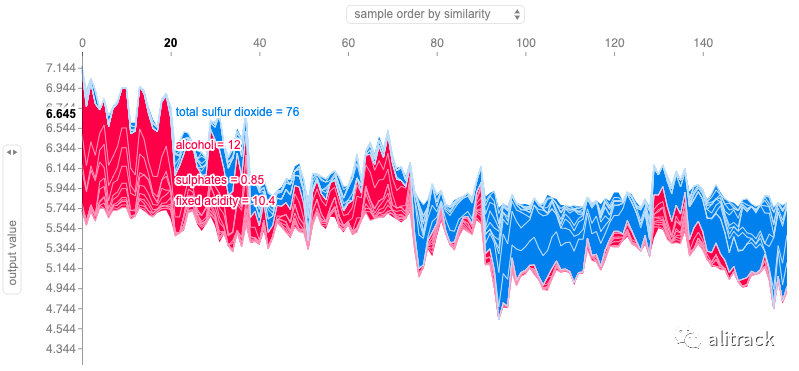
每个观察都有自己的力图。如果将所有力图组合起来,旋转 90 度并水平堆叠,我们得到整个数据 X_test 的力图(参见 Lundberg 和其他贡献者的github[26]的解释)。
shap.force_plot(rf_explainer.expected_value, rf_shap_values, X_test)
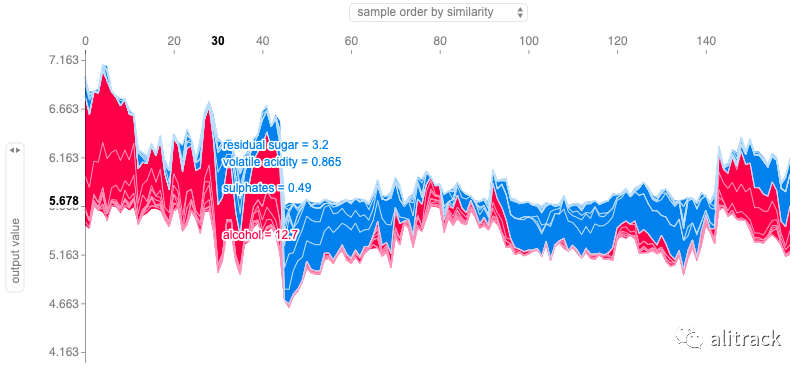
上面的 Y 轴是单个力图的 X 轴。我们的 X_test 中有 160 个数据点,因此 X 轴有 160 个观测值。
GBM
我用 500 棵树(默认为 100)构建了 GBM,它应该对过度拟合具有相当强的鲁棒性。我使用超参数指定 20% 的训练数据用于提前停止validation_fraction=0.2
。n_iter_no_change=5
如果验证结果在 5 次后没有改善,这个超参数将帮助模型提前停止。
from sklearn import ensemblen_estimators = 500gbm = ensemble.GradientBoostingClassifier( n_estimators=n_estimators, validation_fraction=0.2, n_iter_no_change=5, tol=0.01, random_state=0)gbm = ensemble.GradientBoostingClassifier( n_estimators=n_estimators, random_state=0)gbm.fit(X_train, Y_train)
与上面的随机森林部分一样,我使用该函数KernelExplainer()
生成 SHAP 值。然后我将提供四个地块。
import shapgbm_shap_values = shap.KernelExplainer(gbm.predict,X_test)
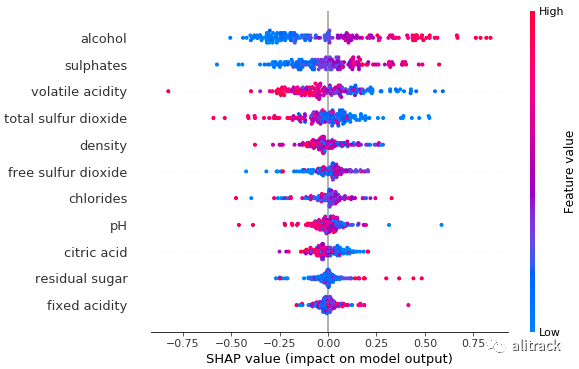
汇总图
与随机森林的输出相比,GBM 显示前四个变量的变量排名相同,但其余变量的排名不同。
shap.summary_plot(gbm_shap_values, X_test)
依赖图
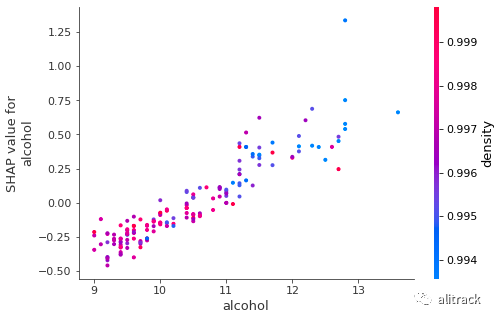
GBM 的相关性图还表明,酒精与目标变量之间存在近似线性的正趋势。与随机森林的输出相反,GBM 显示酒精与密度频繁交互。
shap.dependence_plot("alcohol", gbm_shap_values, X_test)
单个观察力图
我继续为 X_test 数据的第 10 次观察生成力图。
# plot the SHAP values for the 10th observationshap.force_plot(gbm_explainer.expected_value,gbm_shap_values[10,:], X_test.iloc[10,:])

对此观察结果的 GBM 预测为 5.00,与随机森林的 5.11 不同。推动预测降低的力量与随机森林的力量相似:酒精、硫酸盐和残糖。但是推动预测的力量是不同的。
组合力图
shap.force_plot(gbm_explainer.expected_value, gbm_shap_values, X_test)

KNN
因为这里的目标是展示 SHAP 值,所以我只设置了 KNN 的 15 个邻居,而没有对 KNN 进行勤奋的模型优化。
# Train the KNN modelfrom sklearn import neighborsn_neighbors = 15knn = neighbors.KNeighborsClassifier(n_neighbors,weights='distance')knn.fit(X_train,Y_train)# Produce the SHAP valuesknn_explainer = shap.KernelExplainer(knn.predict,X_test)knn_shap_values = knn_explainer.shap_values(X_test)
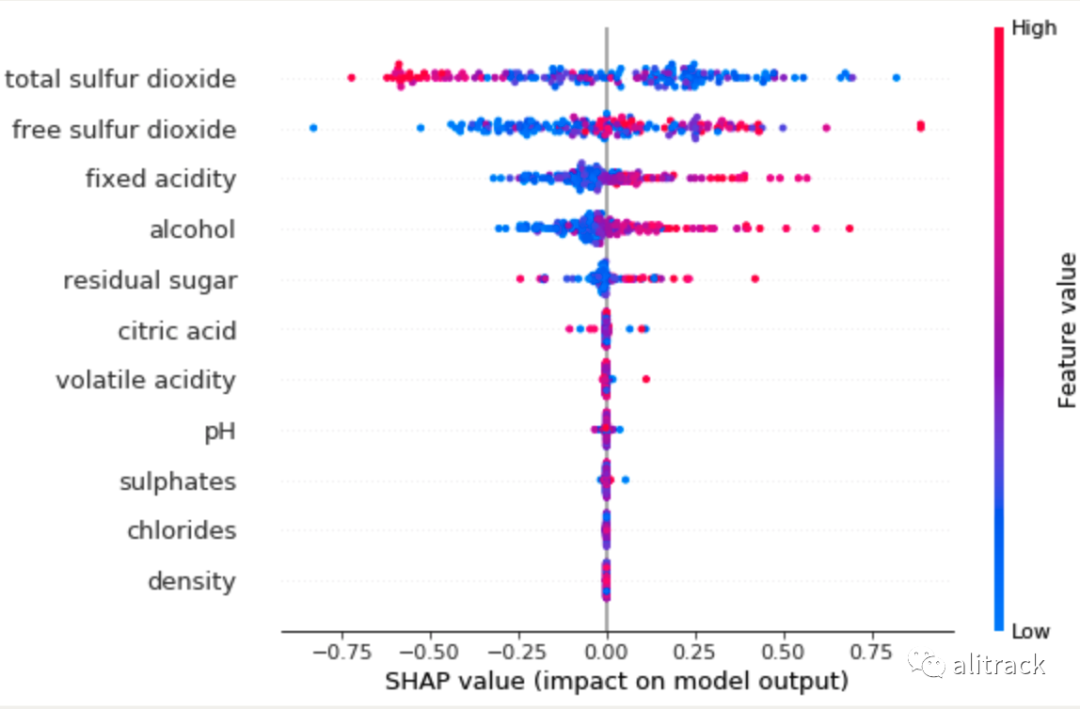
汇总图
有趣的是,与随机森林或 GBM 的输出相比,KNN 显示出不同的变量排名。这种偏离是意料之中的,因为 KNN 容易出现异常值,这里我们只训练 KNN 模型。为了缓解这个问题,建议您构建多个具有不同邻居数的 KNN 模型,然后获取平均值。我的文章使用 PyOD 进行异常检测[27]中也分享了这种直觉。
shap.summary_plot(knn_shap_values, X_test)
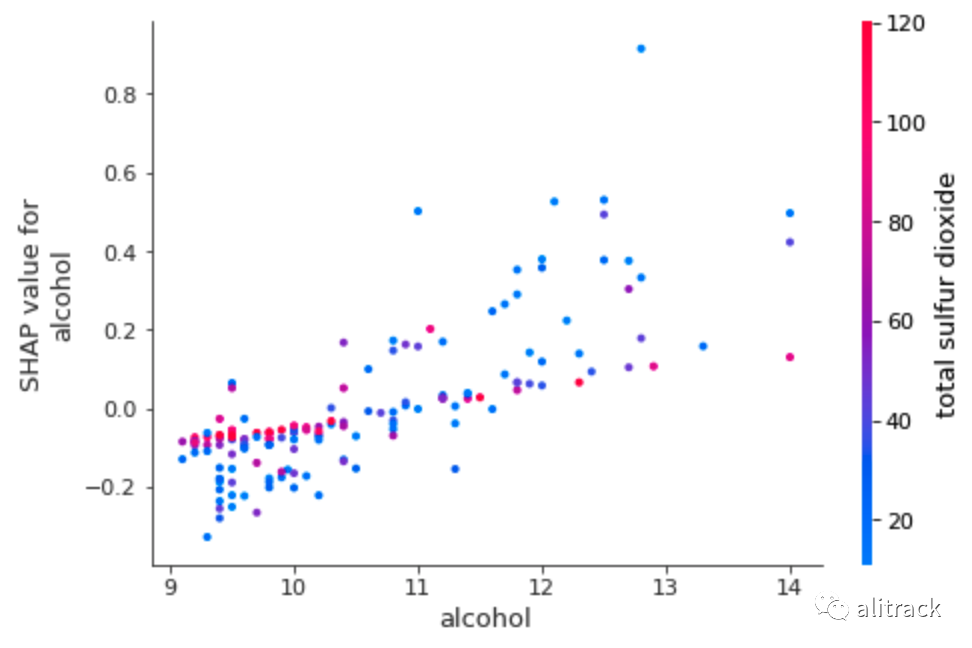
依赖图
KNN 的输出表明,酒精与目标变量之间存在近似线性的正趋势。与随机森林的输出不同,KNN 显示酒精与总二氧化硫频繁相互作用。
shap.dependence_plot("alcohol", knn_shap_values, X_test)
单个观察力图
# plot the SHAP values for the 10th observationshap.force_plot(knn_explainer.expected_value,knn_shap_values[10,:], X_test.iloc[10,:])

此观察结果的预测值为 5.00,与 GBM 的预测值相似。KNN 确定的驱动力是:游离二氧化硫、酒精和残留糖分。
组合力图
shap.force_plot(knn_explainer.expected_value, knn_shap_values, X_test)
支持向量机
支持向量机 (SVM) 找到最佳超平面以将观察结果分成几类。SVM 使用核函数变换到更高维的空间进行分离。为什么在高维空间中分离变得更容易?这必须回到 Vapnik-Chervonenkis (VC) 理论。它说映射到更高维度的空间通常会提供更大的分类能力。请参阅我的帖子 Python 降维技术[28]以获得进一步的解释。常见的核函数有径向基函数 (RBF)、高斯、多项式和 Sigmoid。
在本例中,我使用径向基函数 (RBF) 和参数gamma
。当 的值gamma
非常小时,模型过于受限,无法捕捉数据的复杂性或形状。有两个选项可用gamma='auto'
或gamma='scale'
(请参阅scikit-learn api[29])。
另一个重要的超参数是decision_function_shape
。超参数decision_function_shape
告诉 SVM 数据点与超平面的接近程度。靠近边界的数据点意味着低置信度的决定。有两个选项:一对一 ('ovr') 或一对一 ('ovo')(请参阅scikit-learn api[30])。
# Build the SVM modelfrom sklearn import svmsvm = svm.SVC(gamma='scale',decision_function_shape='ovo')svm.fit(X_train,Y_train)# The SHAP valuessvm_explainer = shap.KernelExplainer(svm.predict,X_test)svm_shap_values = svm_explainer.shap_values(X_test)
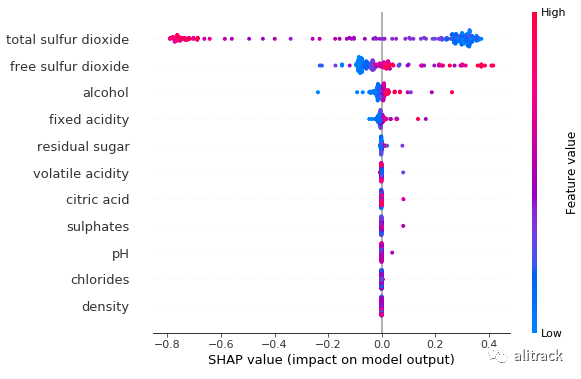
汇总图
再次,我们从随机森林和 GBM 的输出中看到了不同的汇总图。这是意料之中的,因为我们只训练一个 SVM 模型,而且 SVM 也容易出现异常值。
shap.summary_plot(svm_shap_values, X_test)
依赖图
SVM 的输出显示了酒精和目标变量之间的温和线性和正趋势。与随机森林的输出相反,SVM 显示酒精与固定酸度频繁相互作用。
shap.dependence_plot("alcohol", svm_shap_values, X_test)

单个观察力图
# plot the SHAP values for the 10th observationshap.force_plot(svm_explainer.expected_value,svm_shap_values[10,:], X_test.iloc[10,:])

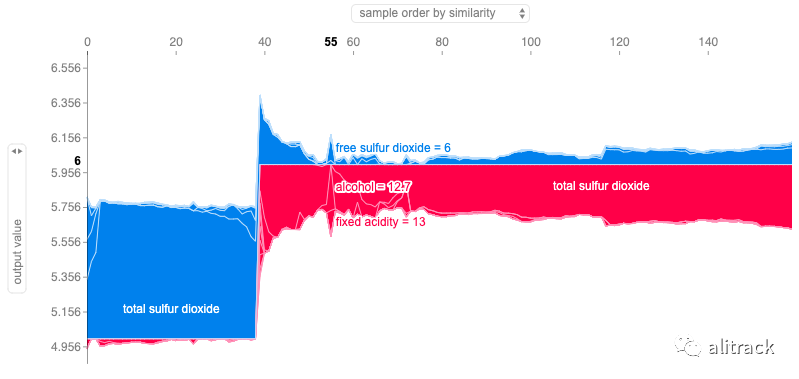
SVM 对此观察的预测为 6.00,与随机森林的 5.11 不同。推动预测降低的力量与随机森林的力量相似;相比之下,二氧化硫总量是推高预测的强大力量。
组合力图
shap.force_plot(svm_explainer.expected_value, svm_shap_values, X_test)
模型内置开源 H2O
许多数据科学家(包括我自己)喜欢开源 H2O[31]。它是一个完全分布式的内存平台,支持最广泛使用的算法,如 GBM、RF、GLM、DL 等。它的 AutoML 功能会自动运行所有算法及其超参数,以生成最佳模型的排行榜。其企业版H2O Driverless AI[32]具有内置的 SHAP 功能。
如何使用开源 H2O 应用 SHAP 值?我要感谢seanPLeary[33],他在如何使用 AutoML 生成 SHAP 值方面为 H2O 社区做出了贡献。我使用他的类 H2OProbWrapper 来计算 SHAP 值。
# The code builds a random forest modelimport h2ofrom h2o.estimators.random_forest import H2ORandomForestEstimatorh2o.init()X_train, X_test = train_test_split(df, test_size = 0.1)X_train_hex = h2o.H2OFrame(X_train)X_test_hex = h2o.H2OFrame(X_test)X_names = ['fixed acidity', 'volatile acidity', 'citric acid', 'residual sugar','chlorides', 'free sulfur dioxide', 'total sulfur dioxide', 'density','pH', 'sulphates', 'alcohol']# Define modelh2o_rf = H2ORandomForestEstimator(ntrees=200, max_depth=20, nfolds=10)# Train modelh2o_rf.train(x=X_names, y='quality', training_frame=X_train_hex)X_test = X_test_hex.drop('quality').as_data_frame()
让我们仔细看看 SVM 的代码shap.KernelExplainer(svm.predict, X_test)
。它接受predict
类的函数svm
和数据集X_test
。因此,当我们应用到 H2O 时,我们需要传递 (i) 预测函数,(ii) 一个类,以及 (iii) 一个数据集。棘手的是 H2O 有自己的数据帧结构。为了将 h2O 的 predict 函数传递h2o.preict()
给shap.KernelExplainer()
,seanPLeary[34]将 H2O 的 predict 函数包装h2o.preict()
在名为 的类中H2OProbWrapper
。这个不错的包装器允许使用类shap.KernelExplainer()
的功能和数据集。predict``H2OProbWrapper``X_test
class H2OProbWrapper: def __init__(self, h2o_model, feature_names): self.h2o_model = h2o_model self.feature_names = feature_namesdef predict_binary_prob(self, X): if isinstance(X, pd.Series): X = X.values.reshape(1,-1) self.dataframe= pd.DataFrame(X, columns=self.feature_names) self.predictions = self.h2o_model.predict(h2o.H2OFrame(self.dataframe)).as_data_frame().values return self.predictions.astype('float64')[:,-1]
所以我们将计算 H2O 随机森林模型的 SHAP 值:
h2o_wrapper = H2OProbWrapper(h2o_rf,X_names)h2o_rf_explainer = shap.KernelExplainer(h2o_wrapper.predict_binary_prob, X_test)h2o_rf_shap_values = h2o_rf_explainer.shap_values(X_test)
汇总图
与随机森林的输出相比,H2O 随机森林显示前三个变量的变量排名相同。
shap.summary_plot(h2o_rf_shap_values, X_test)
依赖图
输出显示酒精和目标变量之间存在线性和正趋势。H2O 随机森林识别出酒精经常与柠檬酸相互作用。
shap.dependence_plot("alcohol", h2o_rf_shap_values, X_test)
单个观察力图
H2O 随机森林对此观察的预测为 6.07。推动预测向右的力量是酒精、密度、残糖和总二氧化硫;左边是固定酸度和硫酸盐。
# plot the SHAP values for the 10th observationshap.force_plot(h2o_rf_explainer.expected_value,h2o_rf_shap_values[10,:], X_test.iloc[10,:])

组合力图
shap.force_plot(h2o_rf_explainer.expected_value, h2o_rf_shap_values, X_test)
R 中的 SHAP 值如何?
有趣的是在这里提到几个用于 SHAP 值的 R 包。R 包整形器[35]是 Python 库 SHAP 的一个端口。R 包xgboost[36]有一个内置函数。另一个包是iml[37](可解释[38]机器学习)。最后,R 包DALEX[39](描述性机器学习解释)还包含各种解释器,有助于理解输入变量和模型输出之间的联系。
SHAP 值不做的事情
自从我发表了这篇文章及其姊妹文章用 SHAP 值解释你的模型以来,读者已经分享了他们与客户会面时遇到的问题。问题不是关于 SHAP 值的计算,而是观众认为 SHAP 值可以做什么。一个主要评论是您能否确定我们制定战略的驱动因素?
上述评论是有道理的,表明数据科学家已经提供了有效的内容。然而,这个问题涉及相关性和因果关系。**SHAP 值不识别因果关系,通过实验设计或类似方法可以更好地识别因果关系。**有兴趣的读者,请阅读我的另外两篇文章变革管理的实验设计[40]或机器学习还是计量经济学?[41]
所有代码
为方便起见,所有行都放在以下代码块中,或通过此 github[42]获得。
import shapshap.initjs()import pandas as pdimport numpy as npnp.random.seed(0)import matplotlib.pyplot as pltdf = pd.read_csv('/winequality-red.csv') # ,sep=';')df.columnsdf['quality'] = df['quality'].astype(int)df.head()df['quality'].hist()from sklearn.model_selection import train_test_splitfrom sklearn import preprocessingfrom sklearn.ensemble import RandomForestRegressorY = df['quality']X =  df[['fixed acidity', 'volatile acidity', 'citric acid', 'residual sugar',       'chlorides', 'free sulfur dioxide', 'total sulfur dioxide', 'density',       'pH', 'sulphates', 'alcohol']]X_train, X_test, Y_train, Y_test = train_test_split(X, Y, test_size = 0.1)X_test.shapeX_test.mean()X_test.iloc[10,:]################## Random Forest ##################rf = RandomForestRegressor(max_depth=6, random_state=0, n_estimators=10)rf.fit(X_train, Y_train)print(rf.feature_importances_)importances = rf.feature_importances_indices = np.argsort(importances)features = X_train.columnsplt.title('Feature Importances')plt.barh(range(len(indices)), importances[indices], color='b', align='center')plt.yticks(range(len(indices)), [features[i] for i in indices])plt.xlabel('Relative Importance')plt.show()X_test[0:1]#################   The SHAP   #################import shapshap.initjs()rf_explainer = shap.KernelExplainer(rf.predict, X_test)rf_shap_values = rf_explainer.shap_values(X_test)X_testrf_explainer(X_test)rf_shap_valuesrf_explainer.expected_value# plot the SHAP values for the 10th observationshap.force_plot(rf_explainer.expected_value, rf_shap_values[10,:], X_test.iloc[10,:]) #, link="logit")shap.force_plot(rf_explainer.expected_value, rf_shap_values, X_test)shap.summary_plot(rf_shap_values, X_test, plot_type="bar")shap.summary_plot(rf_shap_values, X_test)shap.dependence_plot("alcohol", rf_shap_values, X_test)###############    GBM     ###############from sklearn import ensemblen_estimators = 500gbm = ensemble.GradientBoostingClassifier(            n_estimators=n_estimators,            random_state=0)gbm.fit(X_train, Y_train)gbm_explainer = shap.KernelExplainer(gbm.predict, X_test)gbm_shap_values = gbm_explainer.shap_values(X_test)shap.summary_plot(gbm_shap_values, X_test)shap.dependence_plot("alcohol", gbm_shap_values, X_test)# plot the SHAP values for the 10th observationshap.force_plot(gbm_explainer.expected_value,gbm_shap_values[10,:], X_test.iloc[10,:]) #, link="logit")shap.force_plot(gbm_explainer.expected_value, gbm_shap_values, X_test)shap.force_plot(gbm_explainer.expected_value, gbm_shap_values, X_test)# plot the SHAP values for the Setosa output of the first instanceshap.force_plot(explainer.expected_value[0], shap_values[0][0,:], X_test.iloc[0,:], link="logit")###############    XGB     ###############from xgboost import XGBClassifiern_estimators = 500xgb = ensemble.XGBClassifier(            n_estimators=n_estimators,            random_state=0)xgb.fit(X_train, Y_train)xgb_explainer = shap.KernelExplainer(rf.predict, X_test)xgb_shap_values = xgb_explainer.shap_values(X_test)shap.dependence_plot("alcohol", xgb_shap_values, X_test)shap.force_plot(gbm_explainer.expected_value, gbm_shap_values, X_test)###############    KNN     ###############from sklearn import neighborsn_neighbors = 15knn = neighbors.KNeighborsClassifier(n_neighbors, weights='distance')knn.fit(X_train, Y_train)knn_explainer = shap.KernelExplainer(knn.predict, X_test)knn_shap_values = knn_explainer.shap_values(X_test)shap.dependence_plot("alcohol", knn_shap_values, X_test)# plot the SHAP values for the 10th observationshap.force_plot(knn_explainer.expected_value,knn_shap_values[10,:], X_test.iloc[10,:])shap.force_plot(knn_explainer.expected_value, knn_shap_values, X_test)shap.summary_plot(knn_shap_values, X_test)###############    SVM     ###############from sklearn import svmsvm = svm.SVC(gamma='scale', decision_function_shape='ovo')svm.fit(X_train, Y_train)svm_explainer = shap.KernelExplainer(svm.predict, X_test)svm_shap_values = svm_explainer.shap_values(X_test)shap.dependence_plot("alcohol", svm_shap_values, X_test)# plot the SHAP values for the 10th observationshap.force_plot(svm_explainer.expected_value,svm_shap_values[10,:], X_test.iloc[10,:])shap.force_plot(svm_explainer.expected_value, svm_shap_values, X_test)shap.summary_plot(svm_shap_values, X_test)###############    H2O     ###############import h2ofrom h2o.estimators.random_forest import H2ORandomForestEstimatorh2o.init()X_train, X_test = train_test_split(df, test_size = 0.1)X_train_hex = h2o.H2OFrame(X_train)X_test_hex = h2o.H2OFrame(X_test)X_names =  ['fixed acidity', 'volatile acidity', 'citric acid', 'residual sugar',       'chlorides', 'free sulfur dioxide', 'total sulfur dioxide', 'density',       'pH', 'sulphates', 'alcohol']# Define modelh2o_rf = H2ORandomForestEstimator(ntrees=200, max_depth=20, nfolds=10)# Train modelh2o_rf.train(x=X_names, y='quality', training_frame=X_train_hex)X_test = X_test_hex.drop('quality').as_data_frame()class H2OProbWrapper:    def __init__(self, h2o_model, feature_names):        self.h2o_model = h2o_model        self.feature_names = feature_names    def predict_binary_prob(self, X):        if isinstance(X, pd.Series):
            X = X.values.reshape(1,-1)
        self.dataframe= pd.DataFrame(X, columns=self.feature_names)
        self.predictions = self.h2o_model.predict(h2o.H2OFrame(self.dataframe)).as_data_frame().values
        return self.predictions.astype('float64')[:,-1] #probability of True class

h2o_wrapper = H2OProbWrapper(h2o_rf,X_names)

h2o_rf_explainer = shap.KernelExplainer(h2o_wrapper.predict_binary_prob, X_test)

h2o_rf_explainer = shap.KernelExplainer(h2o_wrapper.predict_binary_prob, X_test)
h2o_rf_shap_values = h2o_rf_explainer.shap_values(X_test)

shap.summary_plot(h2o_rf_shap_values, X_test)

shap.dependence_plot("alcohol", h2o_rf_shap_values, X_test)

# plot the SHAP values for the 10th observation
shap.force_plot(h2o_rf_explainer.expected_value,h2o_rf_shap_values[10,:], X_test.iloc[10,:]) #, link="logit")

shap.force_plot(h2o_rf_explainer.expected_value, h2o_rf_shap_values, X_test)
两个新兴趋势:可解释的人工智能、差异化隐私
值得一提的是,人工智能有两个新兴趋势:可解释的人工智能和差分隐私。在可解释的 AI 上,Dataman 发表了一系列文章,包括可解释 AI 的解释[43]、用 SHAP 值解释你的模型[44]和用微软的 InterpretML 解释你的模型[45] 。差分隐私是人工智能的一个重要研究分支。它给人工智能带来了根本性的变化,并继续改变着人工智能的发展。在差异隐私方面,Dataman 发表了您可以通过 Netflix 观看历史识别出您的身份[46]和什么是差异隐私?[47],未来还会有更多。
原文:Explain Any Models with the SHAP Values — Use the KernelExplainer
链接:https://towardsdatascience.com/explain-any-models-with-the-shap-values-use-the-kernelexplainer-79de9464897a
作者:Dr. Dataman
参考资料
用 SHAP 值解释你的模型: https://mp.weixin.qq.com/s?__biz=MzU1NTg2ODQ5Nw==&mid=2247486984&idx=1&sn=0247ed21a4d864b93c3722d31d51acd4&chksm=fbcc8636ccbb0f2021408c37f7db2f0a5a53f540048b9301f12f2e72e8e450446fe596d934e6&token=1200126831&lang=zh_CN#rd
[2]用 LIME 解释您的模型:https://medium.com/@Dataman.ai/explain-your-model-with-lime-5a1a5867b423
[3]用微软的 InterpretML 解释您的模型中查看微软的 InterpretML: https://medium.com/@Dataman.ai/explain-your-model-with-microsofts-interpretml-5daab1d693b4
[4]为所有模型的 SHAP 值创建瀑布图: https://medium.com/dataman-in-ai/the-waterfall-plots-for-the-shap-values-of-all-models-245afc0aa8ec
[5]解释模型预测的统一方法: https://papers.nips.cc/paper/7062-a-unified-approach-to-interpreting-model-predictions.pdf
[6]Python 模块 SHAP 生成: https://shap.readthedocs.io/en/latest/
[7]通过回归不连续性识别因果关系: https://medium.com/@Dataman.ai/identify-causality-by-regression-discontinuity-a4c8fb7507df
[8]通过双重差分法识别因果关系: https://medium.com/@Dataman.ai/identify-causality-by-difference-in-differences-78ad8335fb7c
[9]通过固定: https://medium.com/@Dataman.ai/identify-causality-by-fixed-effects-model-585554bd9735
[10]差异识别因果关系: https://medium.com/@Dataman.ai/identify-causality-by-difference-in-differences-78ad8335fb7c
[11]效应模型: https://medium.com/@Dataman.ai/identify-causality-by-fixed-effects-model-585554bd9735
[12]变革管理实验设计: https://towardsdatascience.com/design-of-experiments-for-your-change-management-8f70880efcdd
[13]Pandas-Bokeh 使令人惊叹的交互式绘图变得容易: https://medium.com/analytics-vidhya/pandas-bokeh-to-make-stunning-interactive-plots-easy-d5b72902c88
[14]使用 Seaborn 轻松绘制漂亮的绘图: https://medium.com/analytics-vidhya/love-the-ocean-love-seaborn-2e8737bef728
[15]使用 Plotly 绘制强大绘图: https://medium.com/@Dataman.ai/plot-with-plotly-114ac106e25f
[16]使用 Plotly 创建漂亮的地理地图: https://medium.com/@Dataman.ai/plotly-for-geomaps-bb75d1de189f
[17]Dataman 学习路径 — 培养技能,推动职业发展: https://medium.com/@Dataman.ai/dataman-learning-paths-build-your-skills-drive-your-career-e1aee030ff6e
[18]添加: https://medium.com/@Dataman.ai/dataman-learning-paths-build-your-skills-drive-your-career-e1aee030ff6e
[19]SHAP Python 模块: https://shap.readthedocs.io/en/latest/
[20]github: https://github.com/dataman-git/codes_for_articles/blob/master/Explain any models with the SHAP values - the KernelExplainer for article.ipynb
[21]我的关于随机森林、梯度提升、正则化和 H2O.ai 的讲义: https://medium.com/analytics-vidhya/a-lecture-note-on-random-forest-gradient-boosting-and-regularization-834fc9a7fa52
[22]Github: https://github.com/slundberg/shap
[23]JH 2001 年弗里德曼: https://statweb.stanford.edu/~jhf/ftp/trebst.pdf
[24]你是双语吗?在 R 和 Python 中流利: https://towardsdatascience.com/are-you-bilingual-be-fluent-in-r-and-python-7cb1533ff99f
[25]原始论文: http://papers.nips.cc/paper/7062-a-unified-approach-to-interpreting-model-predictions.pdf
[26]github: https://github.com/slundberg/shap/blob/master/README.md
[27]使用 PyOD 进行异常检测: https://towardsdatascience.com/anomaly-detection-with-pyod-b523fc47db9
[28]Python 降维技术: https://towardsdatascience.com/dimension-reduction-techniques-with-python-f36ca7009e5c
[29]scikit-learn api: https://scikit-learn.org/stable/modules/generated/sklearn.svm.SVC.html
[30]scikit-learn api: https://scikit-learn.org/stable/modules/generated/sklearn.svm.SVC.html
[31]开源 H2O: https://www.h2o.ai/products/h2o/
[32]H2O Driverless AI: https://www.h2o.ai/products/h2o-driverless-ai/?utm_source=google&utm_medium=test&utm_campaign=aiforbiz&utm_content=business-insights&gclid=Cj0KCQiA-4nuBRCnARIsAHwyuPq2IvnV5e8B0KAgwp_IBswaNcTEWf657Kd453yzHW2AzxFTlYaASSQaAvwIEALw_wcB
[33]seanPLeary: https://github.com/SeanPLeary/shapley-values-h2o-example/blob/master/shap_h2o_automl_classification.ipynb
[34]seanPLeary: https://github.com/SeanPLeary/shapley-values-h2o-example/blob/master/shap_h2o_automl_classification.ipynb
[35]整形器: https://cran.r-project.org/web/packages/shapper/shapper.pdf
[36]xgboost: https://cran.r-project.org/web/packages/xgboost/xgboost.pdf
[37]iml: https://cran.r-project.org/web/packages/iml/index.html
[38]可解释: https://cran.r-project.org/web/packages/iml/index.html
[39]DALEX: https://cran.r-project.org/web/packages/DALEX/DALEX.pdf
[40]变革管理的实验设计: https://towardsdatascience.com/design-of-experiments-for-your-change-management-8f70880efcdd
[41]机器学习还是计量经济学?: https://medium.com/analytics-vidhya/machine-learning-or-econometrics-5127c1c2dc53
[42]github:https://github.com/dataman-git/codes_for_articles/blob/master/Explain any models with the SHAP values - the KernelExplainer for article.ipynb
[43]可解释 AI 的解释: https://medium.com/analytics-vidhya/an-explanation-for-explainable-ai-xai-d56ae3dacd13
[44]用 SHAP 值解释你的模型: https://mp.weixin.qq.com/s?__biz=MzU1NTg2ODQ5Nw==&mid=2247486984&idx=1&sn=0247ed21a4d864b93c3722d31d51acd4&chksm=fbcc8636ccbb0f2021408c37f7db2f0a5a53f540048b9301f12f2e72e8e450446fe596d934e6&token=1200126831&lang=zh_CN#rd
[45]用微软的 InterpretML 解释你的模型: https://medium.com/@Dataman.ai/explain-your-model-with-microsofts-interpretml-5daab1d693b4
[46]您可以通过 Netflix 观看历史识别出您的身份: https://medium.com/ai-in-plain-english/ahh-the-computer-algorithm-still-can-find-you-even-there-is-no-personal-identifiable-information-6e077d17381f
[47]什么是差异隐私?: https://medium.com/@Dataman.ai/what-is-differential-privacy-553f41a757fd?source=friends_link&sk=5fbfe72aefa002cda23c742f869017fa
欢迎关注公众号

有兴趣加群讨论数据挖掘和分析的朋友可以加我微信(witwall),暗号:入群

也欢迎投稿!


