点击上方蓝色字体,选择“设为星标”

有一张财务流水表,未分库分表,目前的数据量为9555695,分页查询使用到了limit,优化之前的查询耗时16 s 938 ms (execution: 16 s 831 ms, fetching: 107 ms),按照下文的方式调整SQL后,耗时347 ms (execution: 163 ms, fetching: 184 ms);
操作:查询条件放到子查询中,子查询只查主键ID,然后使用子查询中确定的主键关联查询其他的属性字段;
原理:减少回表操作;
-- 优化前SQLSELECT 各种字段FROM `table_name`WHERE 各种条件LIMIT 0,10;复制
-- 优化后SQLSELECT 各种字段FROM `table_name` main_taleRIGHT JOIN(SELECT 子查询只查主键FROM `table_name`WHERE 各种条件LIMIT 0,10;) temp_table ON temp_table.主键 = main_table.主键复制
复制
前言
首先说明一下MySQL的版本:
mysql> select version();+-----------+| version() |+-----------+| 5.7.17 |+-----------+1 row in set (0.00 sec)复制
复制
表结构:
mysql> desc test;+--------+---------------------+------+-----+---------+----------------+| Field | Type | Null | Key | Default | Extra |+--------+---------------------+------+-----+---------+----------------+| id | bigint(20) unsigned | NO | PRI | NULL | auto_increment || val | int(10) unsigned | NO | MUL | 0 | || source | int(10) unsigned | NO | | 0 | |+--------+---------------------+------+-----+---------+----------------+3 rows in set (0.00 sec)复制
复制
id为自增主键,val为非唯一索引。
灌入大量数据,共500万:
mysql> select count(*) from test;+----------+| count(*) |+----------+| 5242882 |+----------+1 row in set (4.25 sec)复制
复制
我们知道,当limit offset rows中的offset很大时,会出现效率问题:
mysql> select * from test where val=4 limit 300000,5;+---------+-----+--------+| id | val | source |+---------+-----+--------+| 3327622 | 4 | 4 || 3327632 | 4 | 4 || 3327642 | 4 | 4 || 3327652 | 4 | 4 || 3327662 | 4 | 4 |+---------+-----+--------+5 rows in set (15.98 sec)复制
复制
时间相差很明显。
为什么会出现上面的结果?我们看一下select * from test where val=4 limit 300000,5;的查询过程:
查询到索引叶子节点数据。
根据叶子节点上的主键值去聚簇索引上查询需要的全部字段值。
类似于下面这张图:
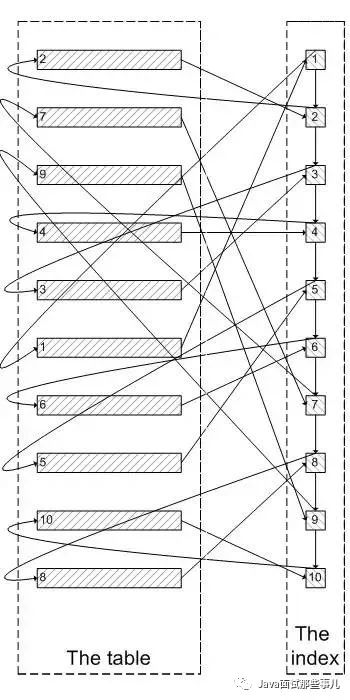
像上面这样,需要查询300005次索引节点,查询300005次聚簇索引的数据,最后再将结果过滤掉前300000条,取出最后5条。MySQL耗费了大量随机I/O在查询聚簇索引的数据上,而有300000次随机I/O查询到的数据是不会出现在结果集当中的。
肯定会有人问:既然一开始是利用索引的,为什么不先沿着索引叶子节点查询到最后需要的5个节点,然后再去聚簇索引中查询实际数据。这样只需要5次随机I/O,类似于下面图片的过程:
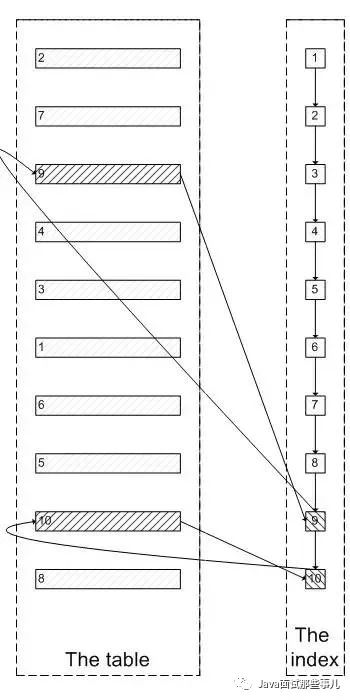
其实我也想问这个问题。
证实
下面我们实际操作一下来证实上述的推论:
为了证实select * from test where val=4 limit 300000,5是扫描300005个索引节点和300005个聚簇索引上的数据节点,我们需要知道MySQL有没有办法统计在一个sql中通过索引节点查询数据节点的次数。我先试了Handler_read_*系列,很遗憾没有一个变量能满足条件。
我只能通过间接的方式来证实:
InnoDB中有buffer pool。里面存有最近访问过的数据页,包括数据页和索引页。所以我们需要运行两个sql,来比较buffer pool中的数据页的数量。预测结果是运行select * from test a inner join (select id from test where val=4 limit 300000,5); 之后,buffer pool中的数据页的数量远远少于select * from test where val=4 limit 300000,5;对应的数量,因为前一个sql只访问5次数据页,而后一个sql访问300005次数据页。
select * from test where val=4 limit 300000,5
mysql> select index_name,count(*) from information_schema.INNODB_BUFFER_PAGEwhere INDEX_NAME in('val','primary') and TABLE_NAME like '%test%'group by index_name;Empty set (0.04 sec)复制
复制
可以看出,目前buffer pool中没有关于test表的数据页。
mysql> select * from test where val=4 limit 300000,5;+---------+-----+--------+| id | val | source |+---------+-----+--------+|3327622 | 4 | 4 || 3327632 | 4 | 4 || 3327642 | 4 | 4 || 3327652 | 4 | 4 || 3327662 | 4 | 4 |+---------+-----+--------+5 rows in set (26.19 sec)mysql> select index_name,count(*) from information_schema.INNODB_BUFFER_PAGE where INDEX_NAME in('val','primary') and TABLE_NAME like '%test%' group by index_name;+------------+----------+| index_name | count(*) |+------------+----------+| PRIMARY | 4098 || val | 208 |+------------+----------+2 rows in set (0.04 sec)复制
复制
可以看出,此时buffer pool中关于test表有4098个数据页,208个索引页。
select * from test a inner join (select id from test where val=4 limit 300000,5) ;为了防止上次试验的影响,我们需要清空buffer pool,重启mysql。
mysqladmin shutdown/usr/local/bin/mysqld_safe &复制
复制
mysql> select index_name,count(*) from information_schema.INNODB_BUFFER_PAGE where INDEX_NAME in('val','primary') and TABLE_NAME like '%test%' group by index_name;Empty set (0.03 sec)复制
复制
运行sql:
mysql> select * from test a inner join (select id from test where val=4 limit 300000,5) b on a.id=b.id;+---------+-----+--------+---------+| id | val | source | id |+---------+-----+--------+---------+| 3327622 | 4 | 4 | 3327622 || 3327632 | 4 | 4 | 3327632 || 3327642 | 4 | 4 | 3327642 || 3327652 | 4 | 4 | 3327652 || 3327662 | 4 | 4 | 3327662 |+---------+-----+--------+---------+5 rows in set (0.09 sec)mysql> select index_name,count(*) from information_schema.INNODB_BUFFER_PAGE where INDEX_NAME in('val','primary') and TABLE_NAME like '%test%' group by index_name;+------------+----------+| index_name | count(*) |+------------+----------+| PRIMARY | 5 || val | 390 |+------------+----------+2 rows in set (0.03 sec)复制
复制
我们可以看明显的看出两者的差别:第一个sql加载了4098个数据页到buffer pool,而第二个sql只加载了5个数据页到buffer pool。符合我们的预测。也证实了为什么第一个sql会慢:读取大量的无用数据行(300000),最后却抛弃掉。
而且这会造成一个问题:加载了很多热点不是很高的数据页到buffer pool,会造成buffer pool的污染,占用buffer pool的空间。遇到的问题
为了在每次重启时确保清空buffer pool,我们需要关闭
innodb_buffer_pool_dump_at_shutdown和innodb_buffer_pool_load_at_startup,这两个选项能够控制数据库关闭时dump出buffer pool中的数据和在数据库开启时载入在磁盘上备份buffer pool的数据。
参考资料:
1.https://explainextended.com/2009/10/23/mysql-order-by-limit-performance-late-row-lookups/
2.https://dev.mysql.com/doc/refman/5.7/en/innodb-information-schema-buffer-pool-tables.html
作者:Muscleape
来源:https://www.jianshu.com/p/0768ebc4e28d

不懂Neo4j?没关系,一起学 不懂Neo4j?没关系,先学增删改查 SpringBoot+Neo4j在社交电商中,讲述你是怎么被绑定为下线的 请别再问我什么是分布式事务 分布式事务解决方案之2PC、TCC 分布式事务解决方案之可靠消息最终一致性、最大努力通知 天天都用消息队列,却不知道为啥要用MQ,这就有点尴尬了 拜托,面试别再问我数据库的分库分表!