


本文节选自《云和恩墨技术通讯》(12月刊)
下载链接:https://www.modb.pro/doc/1593

当数据库出现严重的性能问题hang的时候,我们非常需要通过systemstate dump来知道进程在做什么,在等待什么,谁是资源的持有者,阻塞源等等。在出现上述问题时,及时收集systemstate dump非常有助于问题原因的分析。在此我们分享一个近期的客户案例,供大家参考。
问题描述
2019年11月17日下午15:30左右开始,前端应用出现普通用户连接不上数据库的情况,在数据库主机上使用普通用户登录时出现hang死状态,但使用system用户可以成功登录数据库。DB alert日志中出现大量ORA-12012自动执行对象作业出错,ORA-04021等待锁定对象时发生超时等报错,数据库CKPT进程超时400多分钟。
问题分析
查看当前监听状态正常:
查看数据库活动会话情况:
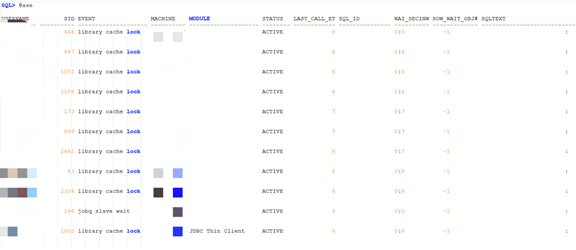
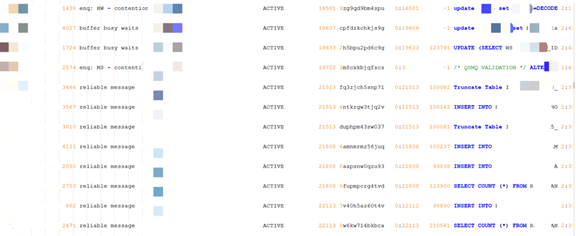
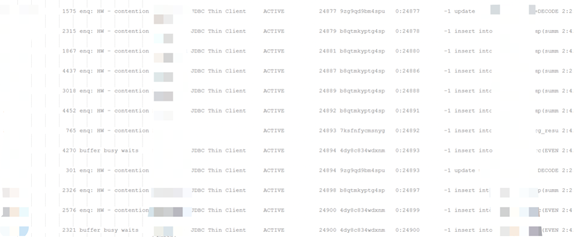
注:其他类似信息已截断, 等待事件主要有library cache lock, reliable message, enq: HW –contention, 并行相关的等待, 无block_session信息。
做数据库hanganayly dump 进一步定位故障原因:
SQL> oradebug setmypid SQL> oradebug unlimit SQL> oradebug hanganalyze 3复制
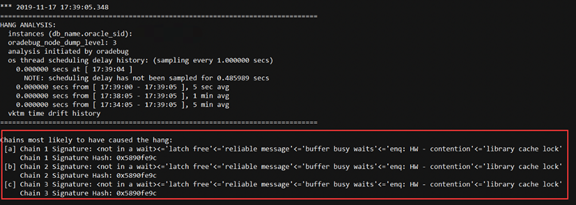
上面堵塞链条,显示library cache lock, reliable message, enq: HW –contention,buffer busy waits, latch free 都是被堵塞的级联等待。
------------------------------------------------------------------------------- Chain 1: ------------------------------------------------------------------------------- Oracle session identified by: { instance: 2 (xxxx,xxx) os id: 5789 process id: 256, oracle@db2 session id: 5 session serial #: 65411 } is waiting for 'library cache lock' with wait info: { p1: 'handle address'=0xa0f5a2338 p2: 'lock address'=0x770eea08 p3: '100*mode+namespace'=0x7f0002 time in wait: 11 min 49 sec (last interval) time in wait: 13 min 32 sec (total) timeout after: 1 min 27 sec wait id: 2 blocking: 0 sessions current sql: <none> ……. } and is blocked by => Oracle session identified by: { instance: 2 (xxxx,xxx) os id: 13392 process id: 267, oracle@db2 session id: 1575 session serial #: 36526 } which is waiting for 'enq: HW - contention' with wait info: { p1: 'name|mode'=0x48570006 p2: 'table space #'=0x4 p3: 'block'=0x13074d0 time in wait: 431 min 12 sec timeout after: never wait id: 4 blocking: 126 sessions current sql: update user$ set spare6=DECODE(to_char(:2, 'YYYY-MM-DD'), '0000-00-00', to_date(NULL), :2) where user#=:1 short stack: ksedsts()+244<-ksdxfstk()+58<-ksdxcb()+918<-sspuser()+224<-__sighandler()<-semtimedop()+10<-skgpwwait()+200<-ksliwat()+2091<-kslwaitctx()+161<-kjusuc()+8387<-ksipgetctxia()+4251<-ksqcmi()+24244<-ksqgtlctx()+4034<-ksqgelctx()+633<-ktusp_starttx()+213<-ktuaex1r()+354<-ktrsexec()+371<-ktuaspResumableInPdb()+11<-ktuAddExtent()+287<-ktusmaex()+352<-ktusmasp1r()+238<-ktrsexec()+1210<-ktuaspResumableInPdb()+11<-ktusmasp()+576<-ktuchg2()+9193<-ktbchg2()+240<-kdu_array_flush_retry()+2377<-kdu_array_flush1()+140<-qerupFetch wait history: * time between current wait and wait #1: 0.003152 sec 1. event: 'enq: IV - contention' time waited: 0.000500 sec wait id: 3 p1: 'type|mode'=0x49560005 p2: 'id1'=0x53594e43 p3: 'id2'=0x17 * time between wait #1 and #2: 0.000115 sec 2. event: 'enq: IV - contention' time waited: 0.001472 sec wait id: 2 p1: 'type|mode'=0x49560005 p2: 'id1'=0x4c4f434b p3: 'id2'=0x17 * time between wait #2 and #3: 0.007973 sec 3. event: 'SQL*Net message from client' time waited: 0.000730 sec wait id: 1 p1: 'driver id'=0x74637000 p2: '#bytes'=0x1 } and is blocked by => Oracle session identified by: { instance: 2 (xxxx,xxx)) os id: 11109 process id: 880, oracle@db2 session id: 2321 session serial #: 24259 } which is waiting for 'buffer busy waits' with wait info: { p1: 'file#'=0x4 p2: 'block#'=0x2 p3: 'class#'=0xd time in wait: 431 min 35 sec timeout after: never wait id: 208 blocking: 237 sessions ………………….. } and is blocked by => Oracle session identified by: { instance: 2 (xxxx,xxx)) os id: 25271 process id: 30, oracle@db2 (SMON) session id: 4261 session serial #: 51091 } ……… { instance: 2 (xxxx,xxx) os id: 25267 process id: 28, oracle@db2 (CKPT) session id: 3977 session serial #: 23943 } which is waiting for 'latch free' with wait info: { p1: 'address'=0x6000c1d8 p2: 'number'=0x15 p3: 'tries'=0x0 time in wait: 434 min 12 sec timeout after: never wait id: 9858273 blocking: 500 sessions current sql: <none> ……. } and is blocked by => Oracle session identified by: { instance: 2 (xxxx,xxx) os id: 25223 process id: 9, oracle@db2 (DBRM) session id: 1279 session serial #: 22797 } which is not in a wait: { last wait: 434 min 49 sec ago blocking: 505 sessions current sql: <none> short stack: <none: error encountered - ORA-32515: cannot issue ORADEBUG command 'SHORT_STACK' to process 'Unix process pid: 25223, image: oracle@db2 (DBRM)'; prior command execution time exceeds 30000 ms> wait history: 1. event: 'rdbms ipc message' time waited: 2.999246 sec wait id: 1117963 p1: 'timeout'=0x12c * time between wait #1 and #2: 0.002750 sec 2. event: 'rdbms ipc message' time waited: 2.439357 sec wait id: 1117962 p1: 'timeout'=0xf4 * time between wait #2 and #3: 0.000046 sec 3. event: 'rdbms ipc message' time waited: 0.565102 sec wait id: 1117961 p1: 'timeout'=0x12c } Chain 1 Signature: <not in a wait><='latch free'<='reliable message'<='buffer busy waits'<='enq: HW - contention'<='library cache lock'复制
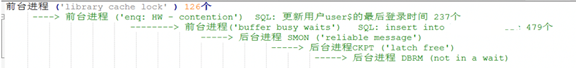
注:上面是会话堵塞链,问题的根源是DBRM进程, DBRM是Resource Manager的后台进程。
查看当时的resource_managed 参数:
SQL> show parameter resource NAME TYPE VALUE ------------------------------------ ----------- ------------------------------ resource_limit boolean TRUE resource_manager_cpu_allocation integer 32 resource_manager_plan string SCHEDULER[0x444A]:DEFAULT_MAIN TENANCE_PLAN复制
当前数据库未禁用resource manager, 用户进程和后台进程CKPT被DBRM进程堵塞。
问题解决
DBRM资源管理的后台进程长时间堵塞了ckpt 后台核心进程,导致一系列级联堵塞,影响了数据库前端应用和登录。 当前版本虽然没有发现已知bug,但是建议禁用resource manage问题特性。
alter system set resource_manager_plan='';复制
禁用resource manage后数据库和应用恢复正常,数据库异常等待消失。
其他建议:禁止应用中写高并发。该环境应用中使用太高的并行hint, 如果再加上并发, 并行度如果没有限制的话,那占用的CPU资源就是并行数*并发数据, 很快会把CPU资源占满,影响全库性能。
