


★本节主要学习如何统计全球销量前20的游戏厂商,以及各个游戏厂商在各国的游戏销量占比。
”
知识点总结
df.copy()用法总结
在统计数据的过程中需要对数值进行加总计算,所以在计算前,需要重新copy()
方法,这样可以避免导致程序出现警告。
#全球游戏加总计算
filtered_data = cln_df_year.copy()
filtered_data['Global_Sales'] = filtered_data['NA_Sales'] + filtered_data['EU_Sales'] + filtered_data['JP_Sales'] + filtered_data['Other_Sales']
输出结果为:
                    Name Platform    Year  ... JP_Sales Other_Sales  Global_Sales
0             Wii Sports      Wii  2006.0  ...     3.77        8.46         82.74
2         Mario Kart Wii      Wii  2008.0  ...     3.79        3.31         35.83
3      Wii Sports Resort      Wii  2009.0  ...     3.28        2.96         33.00
6  New Super Mario Bros.       DS  2006.0  ...     6.50        2.90         30.01
7               Wii Play      Wii  2006.0  ...     2.93        2.85         29.01
DataFrame中的排序df.sort_values
当我们对数据进行整理了之后,我们需要对数据按照相关的指标进行排序,这个时候我们可以使用pandas
中的sort_values
方法进行处理:常用的参数为:
by: 可以连接列表存放多个参照值,也可以接一个用字符串显示
ascending: False表示从大到小,True表示从小到大
axis: 0表示按列行,1表示按列处理
更多的参数参看https://pandas.pydata.org/pandas-docs/stable/reference/api/pandas.DataFrame.sort_values.html
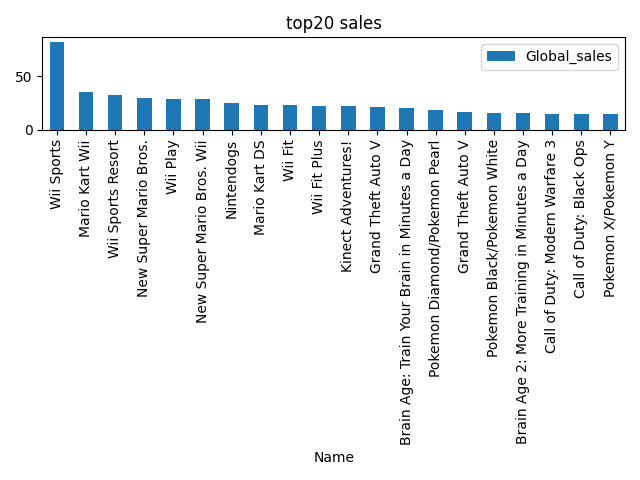
我们要查询全球前20名的销量游戏,需要使用的代码如下:
top20_sales = filtered_data_analyse.sort_values(by = 'Global_Sales',ascending= False).head(20)
print(top20_sales)
输出结果为:
                                            Name  ... Global_Sales
0                                     Wii Sports  ...        82.74
2                                 Mario Kart Wii  ...        35.83
3                              Wii Sports Resort  ...        33.00
6                          New Super Mario Bros.  ...        30.01
7                                       Wii Play  ...        29.01
8                      New Super Mario Bros. Wii  ...        28.61
10                                    Nintendogs  ...        24.75
11                                 Mario Kart DS  ...        23.43
13                                       Wii Fit  ...        22.72
14                                  Wii Fit Plus  ...        22.00
15                            Kinect Adventures!  ...        21.82
16                            Grand Theft Auto V  ...        21.39
19  Brain Age: Train Your Brain in Minutes a Day  ...        20.22
20                 Pokemon Diamond/Pokemon Pearl  ...        18.35
23                            Grand Theft Auto V  ...        16.38
26                   Pokemon Black/Pokemon White  ...        15.32
27   Brain Age 2: More Training in Minutes a Day  ...        15.30
29                Call of Duty: Modern Warfare 3  ...        14.76
31                       Call of Duty: Black Ops  ...        14.64
32                           Pokemon X/Pokemon Y  ...        14.35

[20 rows x 10 columns]
数据的保存
我们将统计的数据进行保存到csv文件中,需要用到基本的pandas
方法
具体的使用方法如下:
top20_sales.to_csv(os.path.join(output_path,'top20_sales'),index = False)

该方法的文档为:https://pandas.pydata.org/pandas-docs/stable/reference/api/pandas.DataFrame.to_csv.html?highlight=to_csv#pandas.DataFrame.to_csv
我们需要记住常用的即可。index
表示索引值,如果是False
表示没有索引值(index)。
图表绘制
top20_games_sales.plot(kind = 'bar',x='Name',y='Global_sales')
    plt.title('top20 sales')
    plt.tight_layout()
    plt.savefig(os.path.join(output_path,'top20_sales.png'))
    plt.show()
这个地方需要注意的是x
y
的值需要与DataFrame中的值一致。
项目完整代码
完整代码如下:
import pandas as pd
import os
import matplotlib.pyplot as plt

"""
    明确任务:
        1. 2005-2017年全球销量的top20的游戏
        2. 2005-2017年各游戏生产商的销量对比,并使用堆叠柱状图进行可视化
"""
data_path = './video_games_sales.csv'
output_path = './output'
if not os.path.exists(output_path):
    os.makedirs(output_path)

def collect_data():
    df_data = pd.read_csv(data_path)
    return df_data

def inspect_data(df_data):
    print('前5行')
    #print(df_data.head())

    print('描述性信息')
    print(df_data.describe())

    print("数据有{}行和{}列".format(df_data.shape[0],df_data.shape[1]))


def process_data(df_data):
    #去除缺失值
    cln_df_data = df_data.dropna()

    #确定时间范围
    cond = (cln_df_data['Year'] >= 2005) & (cln_df_data['Year'] <= 2017)
    cln_df_data1 = cln_df_data[cond]
    filtered_data = cln_df_data1.copy()

    #加总global_sales
    filtered_data['Global_sales'] = filtered_data['NA_Sales'] + filtered_data['EU_Sales'] +filtered_data['JP_Sales'] +filtered_data['Other_Sales']

    #将销售额小于<5M的厂商过滤掉
    filtered_df_data = filtered_data[filtered_data['Global_sales'] > 5]

    #print("原数据有{}行,处理后的数据有:{}行".format(df_data.shape[0],filtered_data.shape[0]))
    return filtered_df_data

def analyze_data(filtered_df_data):
    # 全球销量的top20的游戏

    top20_games_sales = filtered_df_data.sort_values(by = 'Global_sales',ascending = False).head(20)

    producer_games_com_sales = filtered_df_data.groupby('Publisher')[['NA_Sales','EU_Sales','JP_Sales','Other_Sales']].sum()
    #print(top20_games_sales)
    # print('----------')
    # print(producer_games_com_sales)
    return top20_games_sales,producer_games_com_sales


def save_and_show_results(top20_games_sales,producer_games_com_sales):
    top20_games_sales.to_csv(os.path.join(output_path,'top20_sale.csv'),index = False)
    producer_games_com_sales.to_csv(os.path.join(output_path,'global_sales.csv'))


    top20_games_sales.plot(kind = 'bar',x='Name',y='Global_sales')
    plt.title('top20 sales')
    plt.tight_layout()
    plt.savefig(os.path.join(output_path,'top20_sales.png'))
    plt.show()

    producer_games_com_sales.plot.bar(stacked = True)
    plt.title('Games Sales Comparison (2005-2017)')
    plt.tight_layout()
    plt.savefig(os.path.join(output_path,'Game_sale_comparison.png'))
    plt.show()


def main():
    #收集数据
    df_data = collect_data()

    #查看数据基本信息
    #df_data = inspect_data(df_data)

    #数据处理
    filtered_df_data = process_data(df_data)

    #分析数据
    top20_games_sales,producer_games_com_sales = analyze_data(filtered_df_data)


    #数据保存与可视化
    save_and_show_results(top20_games_sales,producer_games_com_sales)


if __name__ == '__main__':
    main()
项目总结:
1.折叠图需要使用producer_games_com_sales.plot.bar(stacked = True)
这一命令。
2.每处理的数据可以直接传入下一个函数中进行处理,完成需求。(完)
★往期回顾:pandas中的groupby方法应用
★美国PM2.5污染变化图
★用python绘制中国地区
