


当数据库因为挂起(hang)而导致出现严重性能问题时,可以使用Oracle自带的HANGANALYZE功能生成跟踪文件,帮助我们快速确定是两个或更多进程死锁,以及其他有多少可能受影响的进程。通过使用HANGANALYZE,可以分析数据库挂起(hang)时是否需要进行性能分析来诊断实际的问题。
HANGANALYZE的使用方法非常简单,具体方法如下:
如果sqlplus / as sysdba 登录有问题,可以考虑使用sqlplus -prelim / as sysdba(11g以前版本)
Show a way to connect to a database through Sqlplus when all other connection methods are hanging. Using a Sqlplus preliminary connection you will be able to connect to the database since no session is actually created, but you will have limited access to the SGA. This will help in capturing diagnostic information like hanganalyze and systemstate dumps to aid in problem resolution.
sqlplus -prelim / as sysdba sqlplus / as sysdba SQL> oradebug setmypid Statement processed. SQL> oradebug unlimit Statement processed. SQL> oradebug hanganalyze 3 等2、3分钟. SQL>oradebug hanganalyze 3 等2、3分钟 SQL> oradebug tracefile_name Hang Analysis in /usr/app/oracle/admin/*******/bdump/*******_diag_8010.trc SQL> exit复制
性能影响: 正常情况,2-3分钟左右应该能完成一次Hang Analyze…
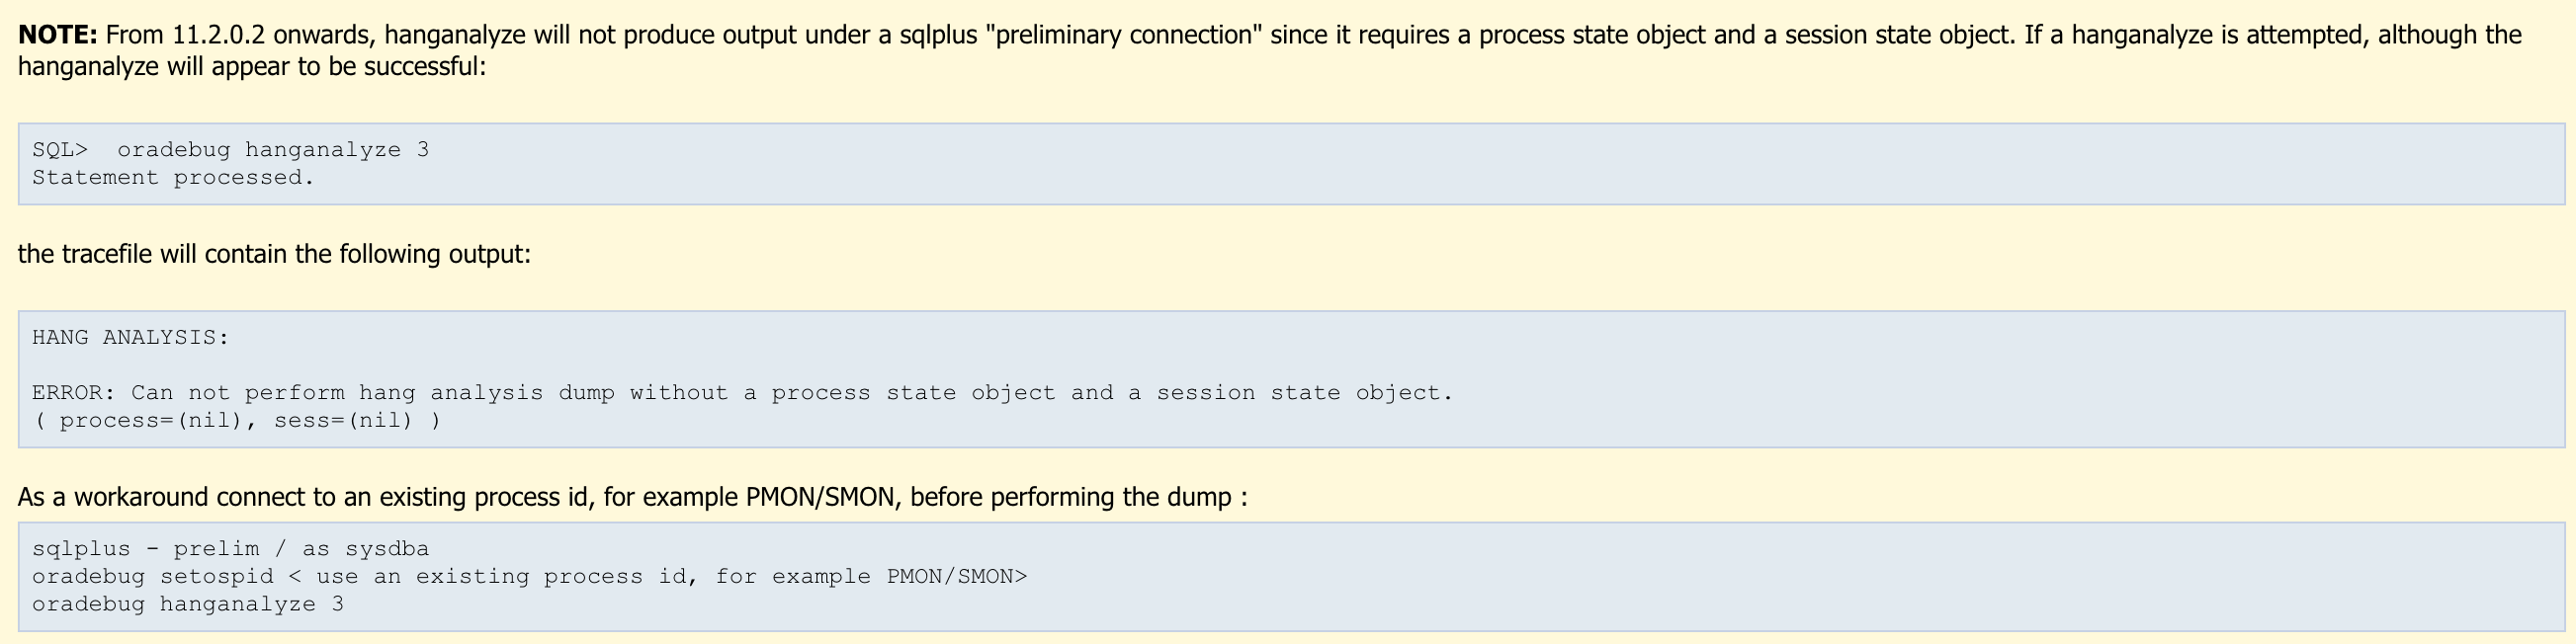
需要注意:在11.2 以上版本,不能使用-prelim 搜集HangAnalysis 信息.
更详细的内容可以参考:
How to Collect Diagnostics for Database Hanging Issues (Doc ID 452358.1)
