前言
前文介绍了 prometheus 的架构和工作原理,本文手动实践一下,使用prometheus + grafna 监控redis。
下载redis_exporter插件
官方没提供专门的redis_exporter,github上有人开发了
https://github.com/oliver006/redis_exporter
安装步骤:
git clone https://github.com/oliver006/redis_exporter.git
cd redis_exporter
go build .
./redis_exporter --version
编译时遇到报错
# go  build .
go: golang.org/x/sys@v0.0.0-20190405154228-4b34438f7a67: unrecognized import path "golang.org/x/sys" (https fetch: Get https://golang.org/x/sys?go-get=1: dial tcp 216.239.37.1:443: connect: connection timed out
可以先设置 GOPROXY 变量
export GOPROXY=https://goproxy.io
go build .
启动redis_exporter
redis_exporter 可以支持监控单实例和多实例。如果监控一个redis 可以使用
nohup ./redis_exporter -redis.addr 127.0.0.1:6379 &
监控多个redis 则需要先启动exporter
nohup ./redis_exporter &
然后在prometheus.yml 的文件中添加
- job_name: 'redis_exporter_targets'
    static_configs:
      - targets:
        - redis://10.9.106.217:6379
        - redis://10.9.106.217:6381
    metrics_path: /scrape
    relabel_configs:
      - source_labels: [__address__]
        target_label: __param_target
      - source_labels: [__param_target]
        target_label: instance
      - target_label: __address__
        replacement: 10.9.11.22:9121

  ## config for scraping the exporter itself
  - job_name: 'redis_exporter'
    static_configs:
      - targets:
        - 10.9.11.22:9121
重新reload配置
sudo curl 'http://localhost:9090/-/reload' -X POST
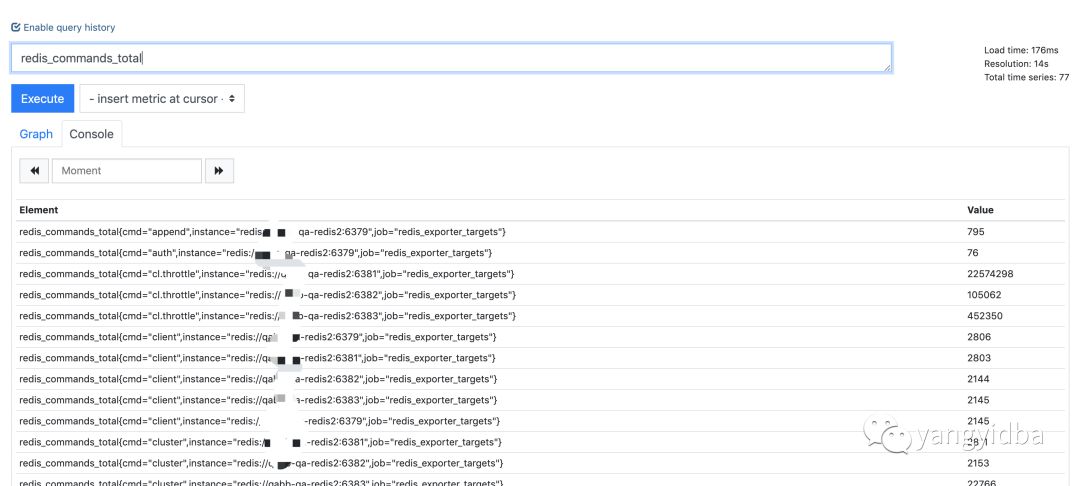
采集到的redis监控数据
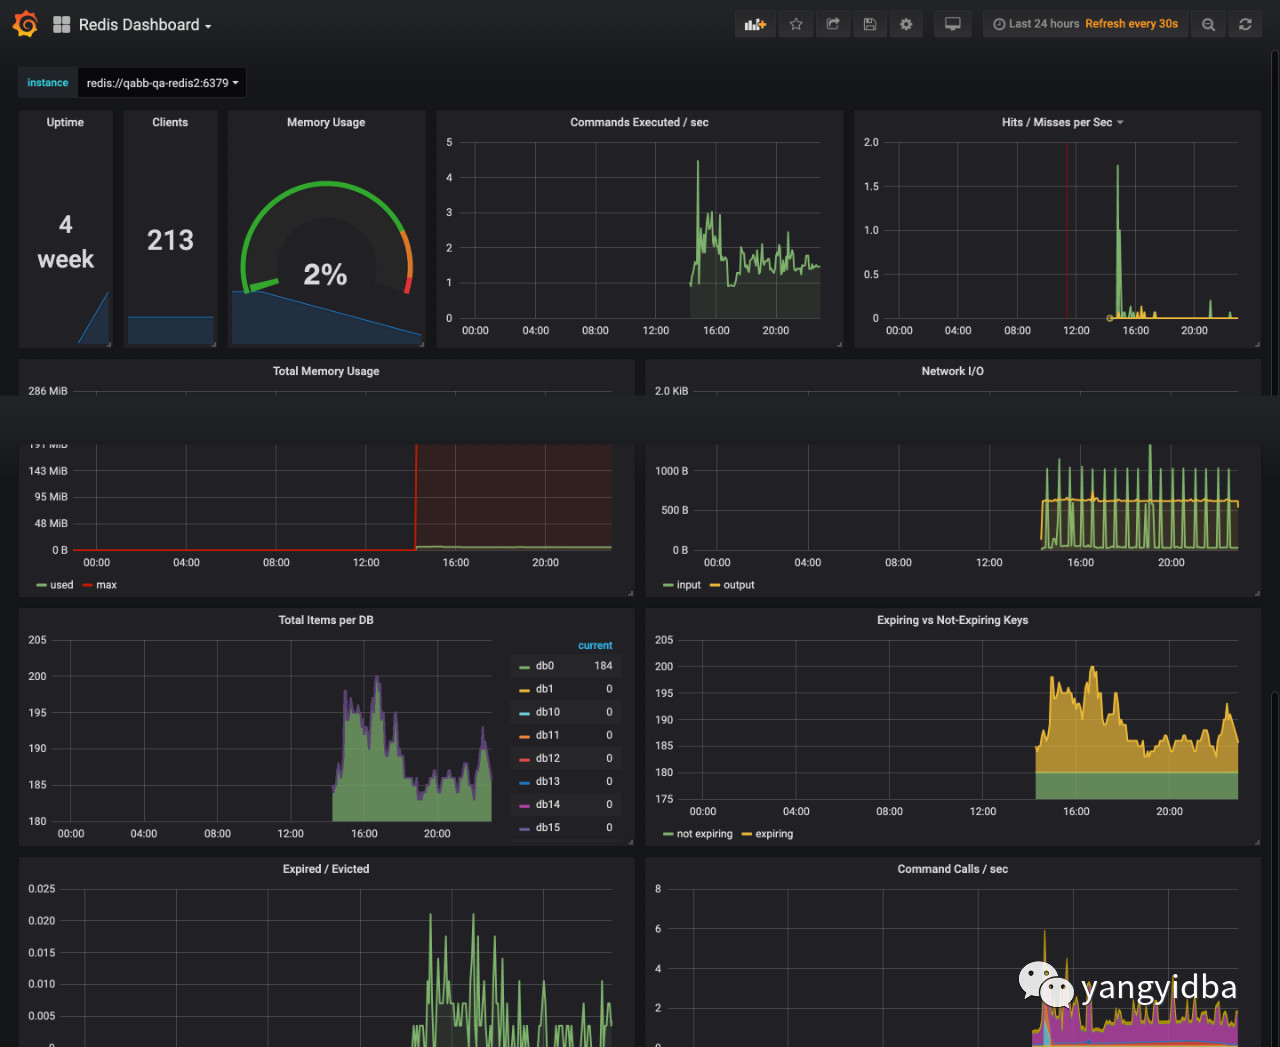
配置grafna
配置prometheus数据源,添加prometheus插件
下载redis仪表盘模板,选择prometheus数据源,然后上传json文件,下载地址: https://grafana.com/grafana/dashboards/763/revisions
-The End-
本公众号长期关注于数据库技术以及性能优化,故障案例分析,数据库运维技术知识分享,个人成长和自我管理等主题,欢迎扫码关注。