


编者按:临渊羡鱼,不如退而结网

MySQL 8.0 OCP (1Z0-908) 考点精析-性能优化考点1:sys.statement_analysis视图
MySQL 8.0 OCP (1Z0-908) 考点精析-性能优化考点2:系统变量的确认
MySQL 8.0 OCP (1Z0-908) 考点精析-性能优化考点3:EXPLAIN ANALYZE
MySQL 8.0 OCP (1Z0-908) 考点精析-性能优化考点4:慢速查询日志(slow query log)
MySQL 8.0 OCP (1Z0-908) 考点精析-性能优化考点5:表连接算法(join algorithm)
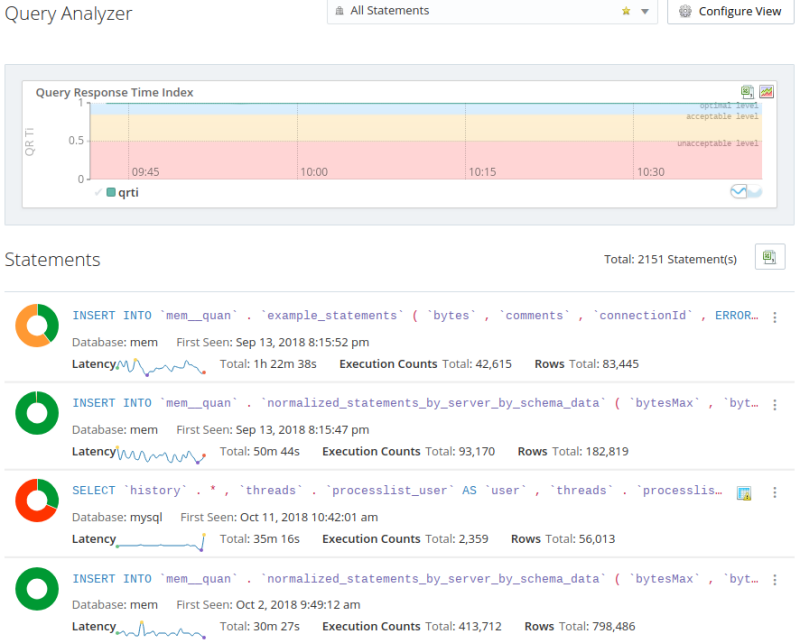
MySQL Enterprise Monitor之Query Analyzer
 1. 表锁定时间
 2. 查询的行数与返回的行数
 3. 创建了多少个临时表,是否有临时表创建在磁盘上
 4. 是否进行了范围扫描,以及以何种形式进行了范围扫描
 5. 是否进行了排序,排序了多少行,排序采用了什么形式
Query Response Time index (QRTi)
| 类型 | 默认时间值 | 分配值 | 描述 | 颜色 |
|---|---|---|---|---|
| 最佳 | 100毫秒 | 1.00 | 最佳时间范围 | 绿色 |
| 可接受 | 4 * 最佳 :(100ms to 400ms) | 0.50 | 可接受的时间范围 | 黄色 |
| 不可接受 | 超过可接受范围 | 0.00 | 不可接受的时间范围 | 红色 |
例题
例题1: Query Analyzer
Choose the best answer.
You are having performance issues with MySQL instances. Those servers are monitored with Enterprise Monitor.
Using Query Analyzer, where do you begin to look for problem queries?

A) Sort the "Exec" column and check for SQL queries with low Query Response Time index (QRTi) values.
B) Look for queries with low total latency times in the Latency section in the times series graph.
C) Sort the "Exec" column and check for SQL queries with high Query Response Time index(QRTi) values.
D) Look for queries with big prolonged spikes in row activity/access graph in the times series graph.
答案与解析1
参考:
文章转载自SQL和数据库技术,如果涉嫌侵权,请发送邮件至:contact@modb.pro进行举报,并提供相关证据,一经查实,墨天轮将立刻删除相关内容。
