


一、引言
快下班的时候,接到告警短信,发现一个比较重要的数据库出现了活跃会话的告警,我们的数据库会设置活动会话数的告警,超过50个就会报警,这个告警监控还是非常有意义的,因为对于一个数据库如果有大量的活动会话,这说明系统已经处于相当繁忙的程度了,要么数据库慢了,要么交易量太大,甭管那种情况,都需要我们认为介入处理的。
二、问题分析
1、活动会话分析
查看v$session,发现有大量的会话是在等待latch: row cache objects,而且都是通过同一个用户发出的SQL。SQL> select event,count(*) from v$session where wait_class<>'Idle' group by event;

EVENT								   COUNT(*)
---------------------------------------------------------------- ----------
latch: row cache objects						123
SQL*Net message to client						  1
SQL*Net message from dblink						  1
direct path read							  3select inst_id||':'||sid||','||serial# ssid,username,sql_id,event,substr(program,1,25) program,machine,state,last_call_et exec_time,status from gv$session
where wait_class<>'Idle' and username is not null
order by last_call_et;
1:2692,53227  test 58m2v8y7wmv7d	 latch: row cache objects	JDBC Thin Client	  dp-cd WAITING		      1306 ACTIVE

1:3955,5745   test 96p6p26zkkhwh	 latch: row cache objects	JDBC Thin Client	  dp-cd WAITING		      1306 ACTIVE

1:4035,14809  test c2y055hxtp2fa	 latch: row cache objects	JDBC Thin Client	  dp-cd WAITING		      1306 ACTIVE

1:4114,5735   test aduj41k8m3zar	 latch: row cache objects	JDBC Thin Client	  dp-cd WAITING		      1306 ACTIVE

1:3719,15129  test  7k7stsb64vhuk	 latch: row cache objects	JDBC Thin Client	  dp-cd WAITING		      1306 ACTIVE  										  复制
2、等待事件分析
先说下这个等待事件,latch: row cache objects: This latch comes into play when user processes are attempting to access or update the cached data dictionary values.说的这个latch是对象的数据字典。也就是说有对象数据字典的争用,根据oracle文档介绍一般都有如下的数据字典:
DC_SEQUENCES
Caused by using sequences in simultaneous insert operations. =>
Consider caching sequences using the cache option. Especially important on RAC instances!
Bug 6027068 – Contention on ORA_TQ_BASE sequence -fixed in 10.2.0.5 and 11.2.0.1

DC_OBJECTS
Look for any object compilation activity which might require an exclusive lock, blocking other activities. If object compiles are occurring this can require an exclusive lock which will block other activity. Tune by examining invalid objects and dependencies with following SQL:
select * from dba_objects order by last_ddl_time desc;
select * from dba_objects where status = 'INVALID';
Can be a bug like the following ones: Bug 11070004 – High row cache objects latch contention w/ oracle text queries Bug 11693365 – Concurrent Drop table and Select on Reference constraint table hangs(deadlock) – fixed in 12.1 DC_SEGMENTS This is most likely due to segment allocation. Identify what the session holding the enqueue is doing and use errorstacks to diagnose.

DC_USERS
– This may occur if a session issues a GRANT to a user, and that user is in the process of logging on to the database.
– Excessive calls to dc_users can be a symptom of “set role XXXX”
– You can check the presents of massive login attempts, even the failed ones by analyzing listener.log (use OEM 12c-> All Metrics or by checking database AUDIT if available or using own tools).
– Bug 7715339 – Logon failures causes “row cache lock” waits – Allow disable of logon delay

DC_TABLESPACES
Probably the most likely cause is the allocation of new extents. If extent sizes are set low then the application may constantly be requesting new extents and causing contention. Do you have objects with small extent sizes that are rapidly growing? (You may be able to spot these by looking for objects with large numbers of extents). Check the trace for insert/update activity, check the objects inserted into for number of extents.

DC_USED_EXTENTS and DC_FREE_EXTENTS
This row cache lock wait may occur similar during space management operations where tablespaces are fragmented or have inadequate extent sizes. Tune by checking whether tablespaces are fragmented, extent sizes are too small, or tablespaces are managed manually.

DC_ROLLBACK_SEGMENTS
– This is due to rollback segment allocation. Just like dc_segments, identify what is holding the enqueue and also generate errorstacks.
Possible Bugs:
– Bug 7313166 Startup hang with self deadlock on dc_rollback_segments (Versions BELOW 11.2)
– Bug 7291739 Contention Under Auto-Tuned Undo Retention (Doc ID 742035.1)

DC_TABLE_SCNS
Bug 5756769 – Deadlock between Create MVIEW and DML – fixed in 10.2.0.5 ,11.1.07 and 11.2.0.1

DC_AWR_CONTROL
This enqueue is related to control of the Automatic Workload Repository. As such any operation manipulating the repository may hold this so look for processes blocking these.

复制
可以根据awr报告查看具体争用的对象,也可以用以下SQL:
1、确认等待事件的等待对象的地址。SQL> select count(*),P1RAW from gv$session where event = 'latch: row cache objects' group by P1RAW;

  COUNT(*) P1RAW
---------- ----------------
	93 00000079F55A90B0

2、根据对象地址判断等待对象的类型,这边确认为rollback segments.
SQL> SELECT kqrsttxt PARAMETER, kqrstcid CACHE#, kqrstcln "Lchild#", kqrstgrq "DCGets", l.gets   "LGets", l.misses "Misses"  FROM X$KQRST, V$LATCH_CHILDREN l WHERE l.addr='00000079F55A90B0' and l.child#=KQRSTCLN ORDER BY 1,2;

PARAMETER			     CACHE#    Lchild#	   DCGets      LGets	 Misses
-------------------------------- ---------- ---------- ---------- ---------- ----------
dc_rollback_segments			  3	     1 1633760723  606316837 1596394968

3、根据v$rowcache也能确认dc_rollback_segments的gets量排在首位,可以确认是对undo表空间争用比较多。
SQL> select PARAMETER,GETS from v$rowcache order by GETS desc;

PARAMETER			       GETS
-------------------------------- ----------
dc_rollback_segments		  502625702
dc_users			  171735500
dc_histogram_data		  147402735
dc_objects			  108058204
dc_tablespaces			   83055695
dc_histogram_defs		   47254821
dc_histogram_data		   39795047
dc_segments			   16905340
dc_users			    5532346
dc_files			    4112426
dc_global_oids			    3583634
global database name		    2185203
dc_profiles			     983136
dc_object_grants			406
dc_sequences				  1
extensible security UID to princ	  0复制
3、SQL执行计划分析
分析对应的SQL文本,虽然SQL ID一样,但是查询语句都是一个,只是where条件不一致:
SQL文本:SQL> select sql_text from v$sql where sql_id='8q5nf6tdm843m';
SQL_TEXT
--------------------------------------------------------------------------------------------------------------------------------------------------------------------------------------------------------
SELECT a,b,c,substr(OCCURTIME,1,8) AS BUSI_DATE,to_char(sysdate,'yyyy-mm-dd
hh24:mi:ss') AS ETL_TIME FROM test.test WHERE 1=1 and ROUND(TO_NUMBER(to_date('20230813','yyyy-mm-dd') - to_date(substr(occurtime,1,8),'yyyy-mm-dd')))<=3 and ROUND(TO_NUMBER(to_dat
e('20230813','yyyy-mm-dd') - to_date(substr(occurtime,1,8),'yyyy-mm-dd')))>=0 and ( SERIALNUM >= 2068988 ) AND ( SERIALNUM < 3098474 )SQL执行计划显示对标test进行了全表扫描。where条件中有两个过滤字段SERIALNUM和occurtime。------------------------------------------------------------------------------------------
| Id | Operation | Name | Rows | Bytes | Cost (%CPU)| Time |
------------------------------------------------------------------------------------------
| 0 | SELECT STATEMENT | | | | 7160K(100)| |
|* 1 | TABLE ACCESS FULL| test | 40746 | 13M| 7160K (1)| 23:52:07 |
------------------------------------------------------------------------------------------这两个字段上都有索引,occurtime和SERIALNUM是复核索引,但是由于occurtime做了算术运算,无法使用到索引,导致执行了全表扫描。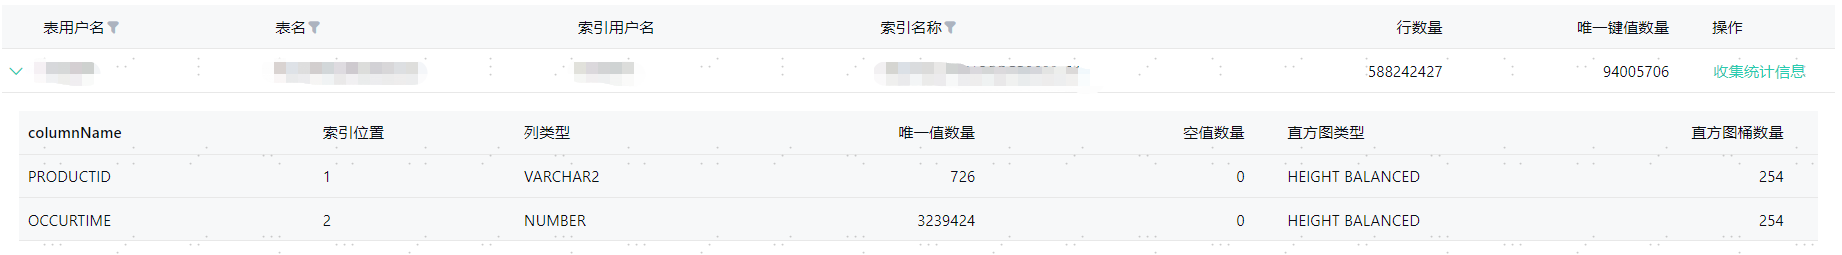

根据以上分析研判,在执行查询的过程中,无法使用索引,导致执行计划走了全表扫描,同时由于表的数据变动比较频繁,且表数据量很大,在全表的过程中需要查询UNDO段,进而引发了rollback segment的争用。针对以上问题,建议如下:
1、调整where条件中occurtime的写法,使其能利用索引。或者建立函数索引。
2、对于where条件中的变量使用绑定变量,防止大并发查询导致大量解析。
「喜欢这篇文章,您的关注和赞赏是给作者最好的鼓励」
关注作者
【版权声明】本文为墨天轮用户原创内容,转载时必须标注文章的来源(墨天轮),文章链接,文章作者等基本信息,否则作者和墨天轮有权追究责任。如果您发现墨天轮中有涉嫌抄袭或者侵权的内容,欢迎发送邮件至:contact@modb.pro进行举报,并提供相关证据,一经查实,墨天轮将立刻删除相关内容。
评论
寂灵

1年前
评论
 0
0增大undo也也可以缓解
1年前
点赞 评论


