

19. 峰峦图绘制
清除当前环境中的变量
rm(list=ls())
设置工作目录
setwd("C:/Users/Dell/Desktop/R_Plots/19ridge/")
使用ggridges包绘制峰峦图
library(ggridges)
library(ggplot2)
##
## Attaching package: 'ggplot2'
## The following object is masked from 'package:ggridges':
##
##     scale_discrete_manual

# 查看示例数据
head(iris)
##   Sepal.Length Sepal.Width Petal.Length Petal.Width Species
## 1          5.1         3.5          1.4         0.2  setosa
## 2          4.9         3.0          1.4         0.2  setosa
## 3          4.7         3.2          1.3         0.2  setosa
## 4          4.6         3.1          1.5         0.2  setosa
## 5          5.0         3.6          1.4         0.2  setosa
## 6          5.4         3.9          1.7         0.4  setosa

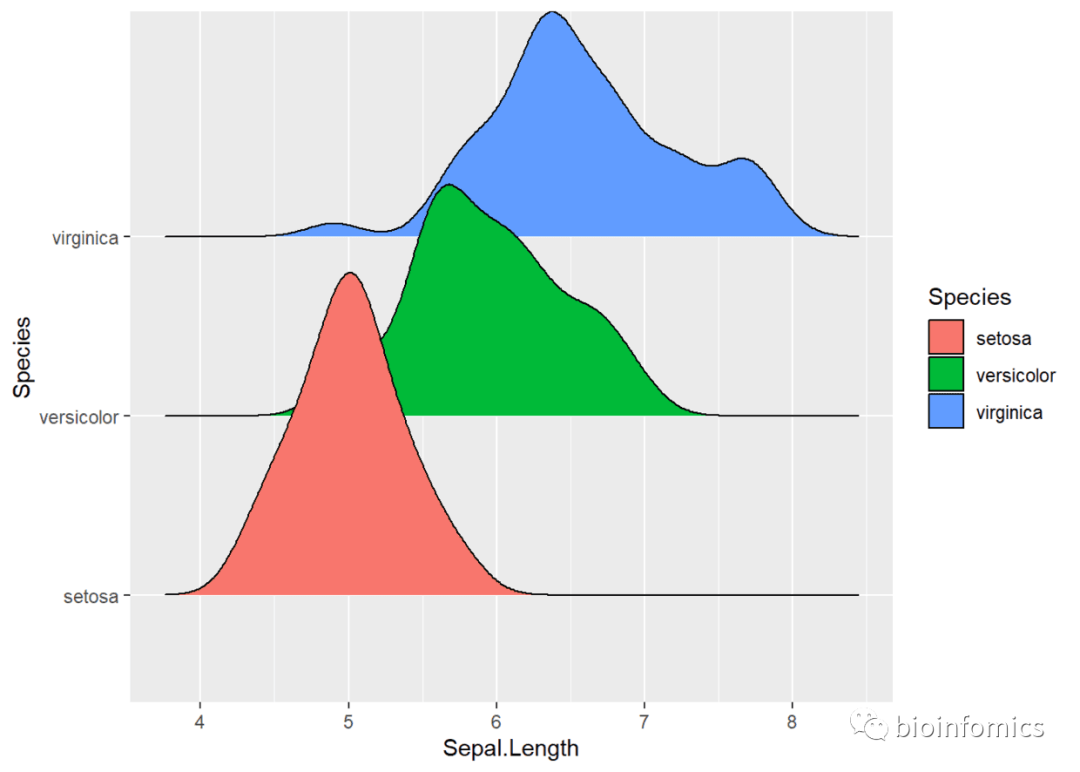
# 使用geom_density_ridgesh函数绘制峰峦图
ggplot(iris, aes(x=Sepal.Length, y=Species, fill=Species)) +
  geom_density_ridges()
# 设置分面
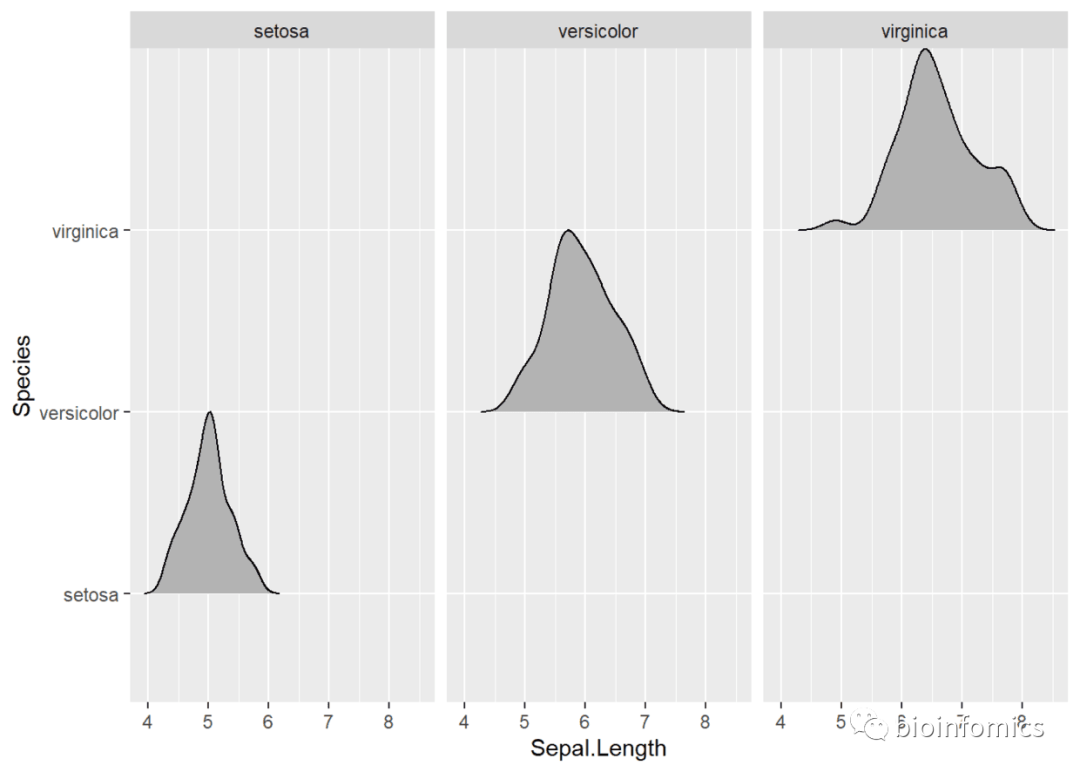
ggplot(iris, aes(x = Sepal.Length, y = Species)) +
  geom_density_ridges(scale = 1) +
  facet_wrap(~Species)
# 添加jitter散点
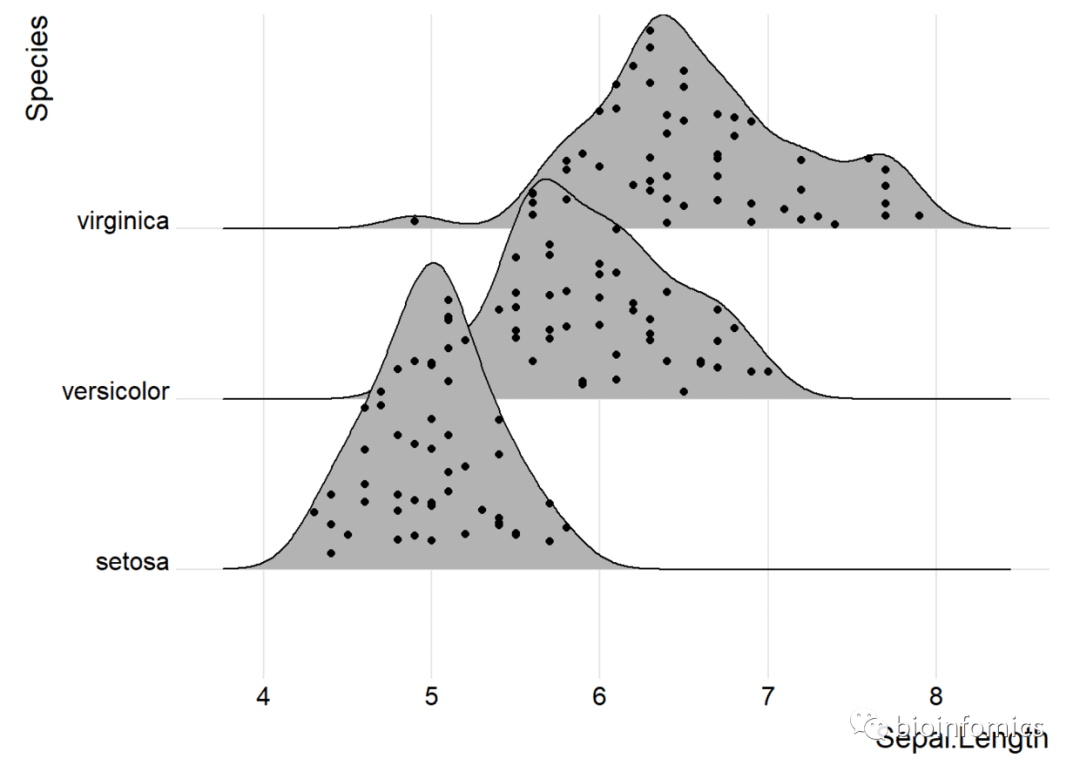
ggplot(iris, aes(x=Sepal.Length, y=Species)) +
  geom_density_ridges(jittered_points = TRUE) +
  theme_ridges()
# 更改散点的位置
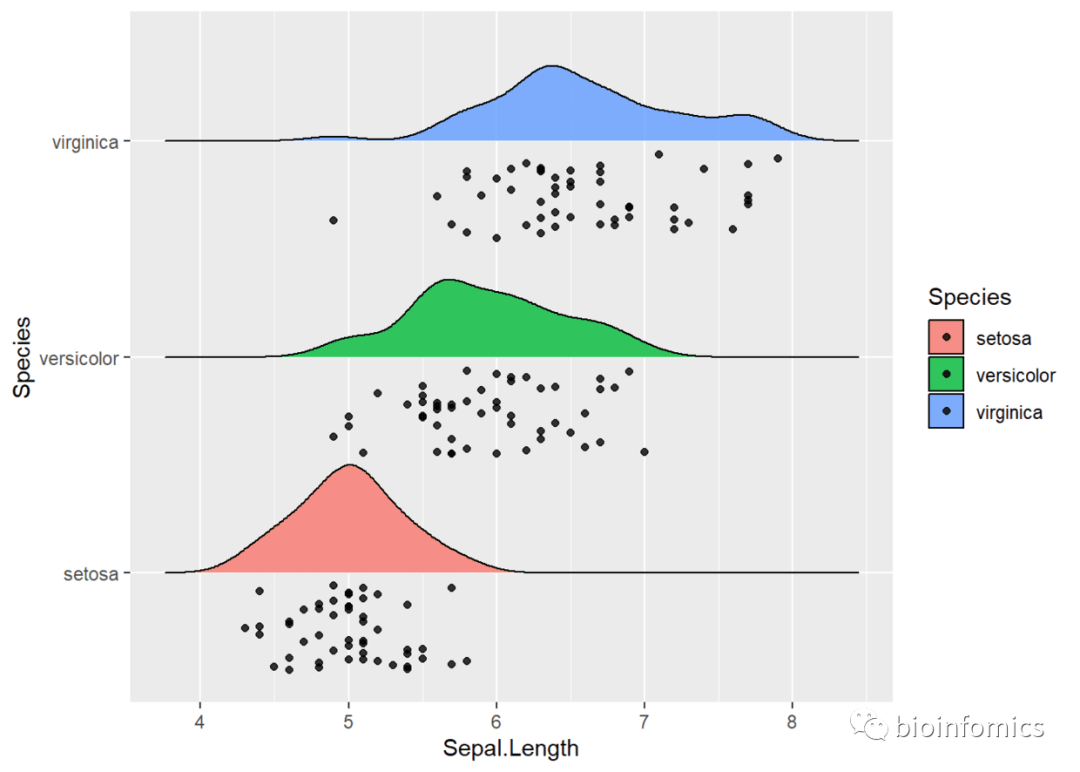
ggplot(iris, aes(x=Sepal.Length, y=Species, fill=Species)) +
  geom_density_ridges(
    jittered_points = TRUE,
    position = "raincloud",
    alpha = 0.8, scale = 0.5
  )
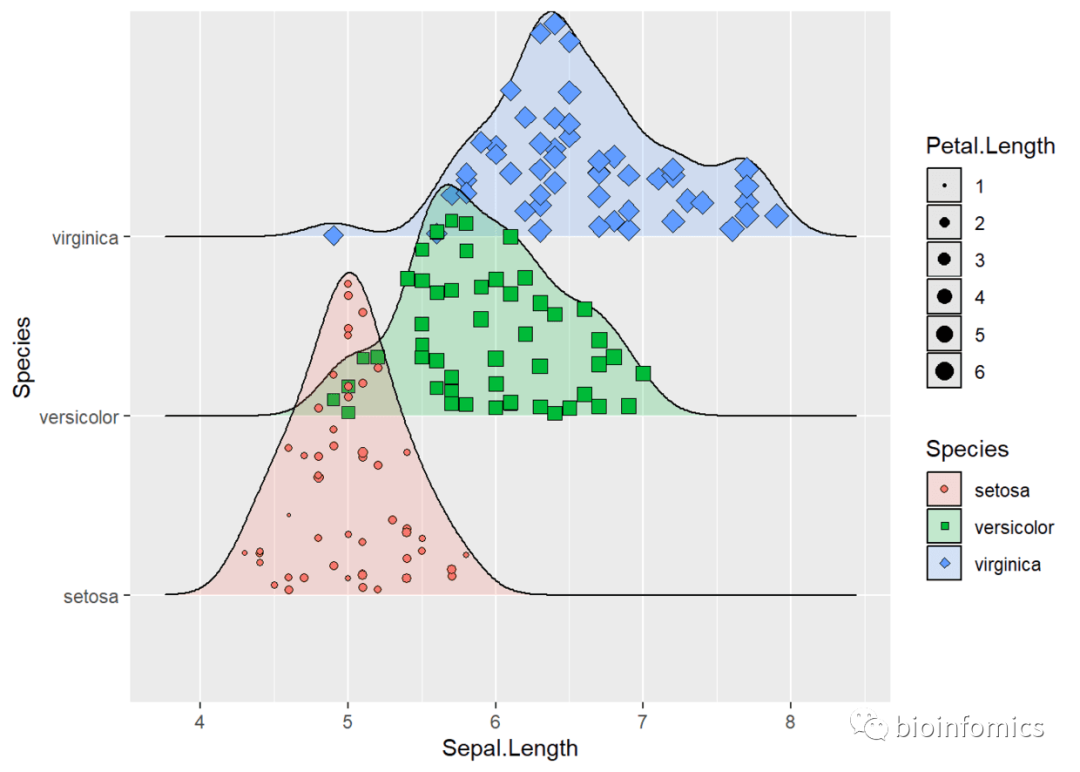
# 设置散点的大小和颜色
ggplot(iris, aes(x = Sepal.Length, y = Species, fill = Species)) +
  geom_density_ridges(
    aes(point_shape = Species, point_fill = Species, point_size = Petal.Length),
    alpha = .2, point_alpha = 1, jittered_points = TRUE
  ) +
  scale_point_color_hue(l = 40) +
  scale_point_size_continuous(range = c(0.5, 4)) +
  scale_discrete_manual(aesthetics = "point_shape", values = c(21, 22, 23))
library(viridis)
## Loading required package: viridisLite

head(lincoln_weather)
## # A tibble: 6 x 24
##   CST   `Max Temperatur~ `Mean Temperatu~ `Min Temperatur~ `Max Dew Point ~
##   <chr>            <int>            <int>            <int>            <int>
## 1 2016~               37               24               11               19
## 2 2016~               41               23                5               22
## 3 2016~               37               23                8               23
## 4 2016~               30               17                4               24
## 5 2016~               38               29               19               29
## 6 2016~               34               33               32               33
## # ... with 19 more variables: `Mean Dew Point [F]` <int>, `Min Dewpoint
## #   [F]` <int>, `Max Humidity` <int>, `Mean Humidity` <int>, `Min
## #   Humidity` <int>, `Max Sea Level Pressure [In]` <dbl>, `Mean Sea Level
## #   Pressure [In]` <dbl>, `Min Sea Level Pressure [In]` <dbl>, `Max
## #   Visibility [Miles]` <int>, `Mean Visibility [Miles]` <int>, `Min
## #   Visibility [Miles]` <int>, `Max Wind Speed [MPH]` <int>, `Mean Wind
## #   Speed[MPH]` <int>, `Max Gust Speed [MPH]` <int>, `Precipitation
## #   [In]` <chr>, CloudCover <int>, Events <chr>, `WindDir
## #   [Degrees]` <int>, Month <fct>

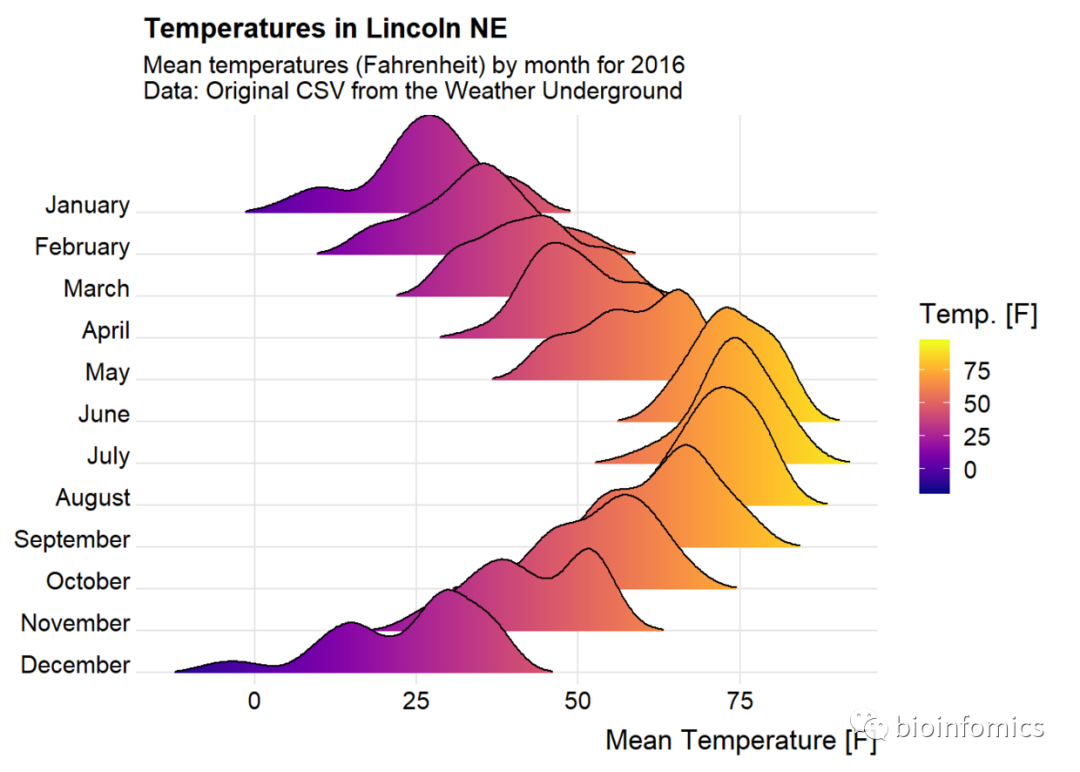
ggplot(lincoln_weather, aes(x = `Mean Temperature [F]`, y = `Month`, fill = ..x..)) +
  geom_density_ridges_gradient(scale = 3, rel_min_height = 0.01, gradient_lwd = 1.) +
  scale_x_continuous(expand = c(0.01, 0)) +
  scale_y_discrete(expand = c(0.01, 0)) +
  scale_fill_viridis(name = "Temp. [F]", option = "C") +
  labs(
    title = 'Temperatures in Lincoln NE',
    subtitle = 'Mean temperatures (Fahrenheit) by month for 2016\nData: Original CSV from the Weather Underground'
  ) +
  theme_ridges(font_size = 13, grid = TRUE) + theme(axis.title.y = element_blank())
sessionInfo()
## R version 3.6.0 (2019-04-26)
## Platform: x86_64-w64-mingw32/x64 (64-bit)
## Running under: Windows 10 x64 (build 18363)
##
## Matrix products: default
##
## locale:
## [1] LC_COLLATE=Chinese (Simplified)_China.936
## [2] LC_CTYPE=Chinese (Simplified)_China.936
## [3] LC_MONETARY=Chinese (Simplified)_China.936
## [4] LC_NUMERIC=C
## [5] LC_TIME=Chinese (Simplified)_China.936
##
## attached base packages:
## [1] stats     graphics  grDevices utils     datasets  methods   base
##
## other attached packages:
## [1] viridis_0.5.1     viridisLite_0.3.0 ggplot2_3.2.0     ggridges_0.5.1
##
## loaded via a namespace (and not attached):
##  [1] Rcpp_1.0.5       pillar_1.4.2     compiler_3.6.0   plyr_1.8.4
##  [5] tools_3.6.0      digest_0.6.20    evaluate_0.14    tibble_2.1.3
##  [9] gtable_0.3.0     pkgconfig_2.0.2  rlang_0.4.7      cli_1.1.0
## [13] yaml_2.2.0       xfun_0.8         gridExtra_2.3    withr_2.1.2
## [17] dplyr_0.8.3      stringr_1.4.0    knitr_1.23       vctrs_0.3.2
## [21] grid_3.6.0       tidyselect_0.2.5 glue_1.3.1       R6_2.4.0
## [25] fansi_0.4.0      rmarkdown_1.13   purrr_0.3.2      magrittr_1.5
## [29] scales_1.0.0     htmltools_0.3.6  assertthat_0.2.1 colorspace_1.4-1
## [33] labeling_0.3     utf8_1.1.4       stringi_1.4.3    lazyeval_0.2.2
## [37] munsell_0.5.0    crayon_1.3.4

END


文章转载自bioinfomics,如果涉嫌侵权,请发送邮件至:contact@modb.pro进行举报,并提供相关证据,一经查实,墨天轮将立刻删除相关内容。


