

16. PCA图绘制
清除当前环境中的变量
rm(list=ls())
设置工作目录
setwd("C:/Users/Dell/Desktop/R_Plots/16pca/")
加载示例数据
data <- read.table("demo_pca.txt",header = T,row.names = 1,sep="\t",check.names = F)

# 查看数据
head(data)
##                  C1       C2       C3        M1        M2        M3
## AT1G01060 33.035800 35.55930 34.64920 10.294500 13.393800 13.659000
## AT1G01320 73.740400 76.31340 69.04050 17.208400 19.669500 17.630300
## AT1G01420  6.667900  6.66516  7.94002  2.863710  3.834140  3.432600
## AT1G01520  9.588620  8.55635  9.32078  0.982357  2.876840  2.188840
## AT1G01970 17.210700 15.13220 18.35080  7.080410  7.748770  7.272220
## AT1G02380  0.749953  1.95807  1.44847  0.934699  0.367559  0.703017

# 数据转置,转换成行为样本,列为基因的矩阵
data <- t(data)
使用prcomp函数进行PCA分析
data.pca <- prcomp(data)
# 查看PCA的分析结果
summary(data.pca)
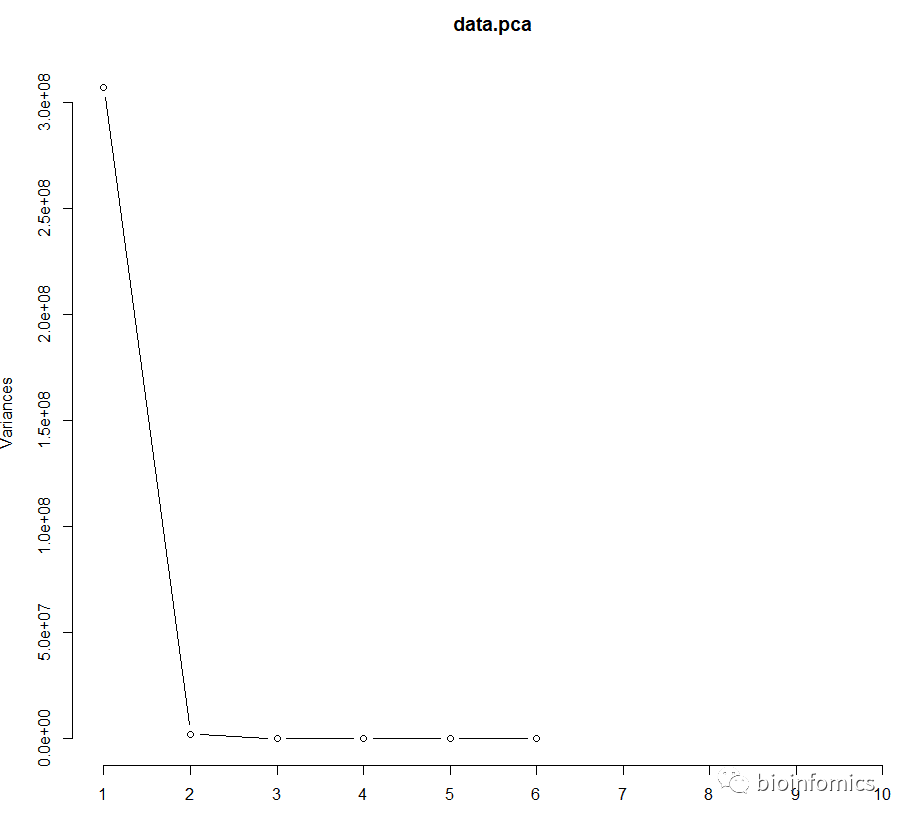
## Importance of components:
##                              PC1       PC2       PC3       PC4      PC5
## Standard deviation     1.751e+04 1.459e+03 426.25749 328.16697 171.7883
## Proportion of Variance 9.921e-01 6.890e-03   0.00059   0.00035   0.0001
## Cumulative Proportion  9.921e-01 9.990e-01   0.99956   0.99990   1.0000
##                              PC6
## Standard deviation     1.461e-11
## Proportion of Variance 0.000e+00
## Cumulative Proportion  1.000e+00

#----Standard deviation 标准差   其平方为方差=特征值
#----Proportion of Variance  方差贡献率
#----Cumulative Proportion  方差累计贡献率

# 绘制主成分的碎石图
screeplot(data.pca, npcs = 10, type = "lines")
# 查看主成分的结果
head(data.pca$x)
##           PC1        PC2       PC3       PC4         PC5           PC6
## C1 -13102.671  1379.8802  231.0448  148.3701  255.621964 -1.575094e-11
## C2 -15612.730 -1294.4214 -661.6586  137.3621   -1.050406  2.598617e-11
## C3 -15985.837  1072.3905  209.1377 -190.1187 -255.774746  1.695406e-11
## M1  16558.189  -442.8635  253.4135  517.0651 -100.838108  1.183409e-13
## M2  23877.097  1295.0204 -408.9296 -249.7849   24.401970 -4.182591e-11
## M3   4265.951 -2010.0062  376.9922 -362.8937   77.639326  1.456456e-11
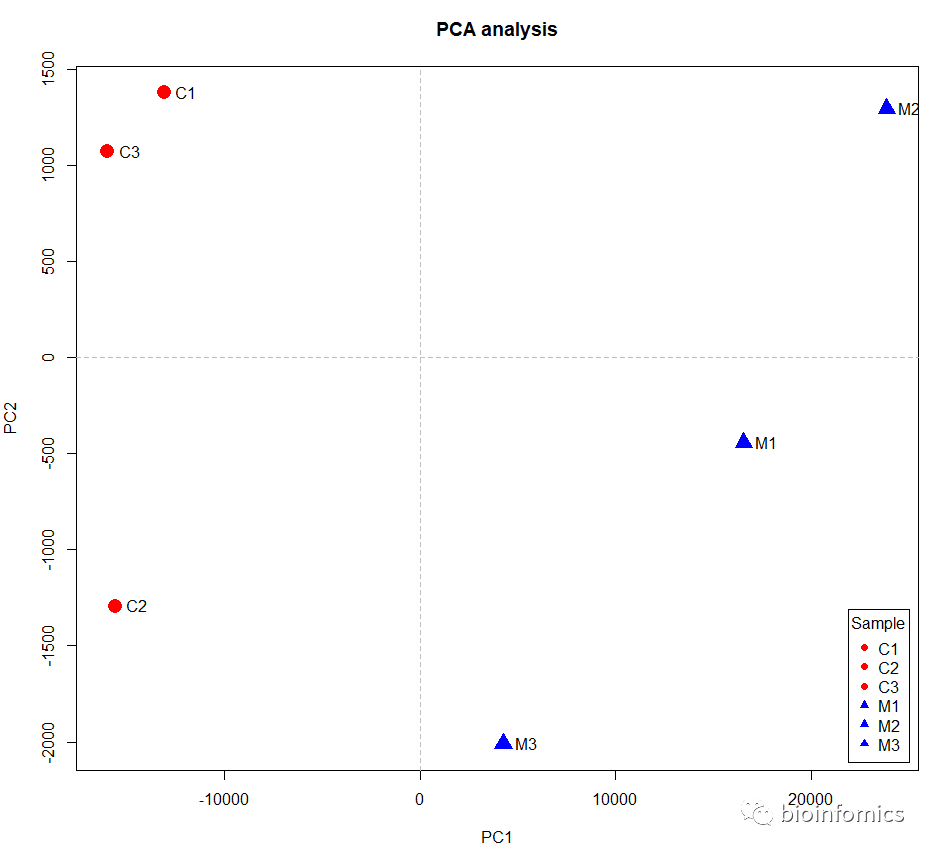
使用基础plot函数绘制PCA图
plot(data.pca$x,cex = 2,main = "PCA analysis",
     col = c(rep("red",3),rep("blue",3)),
     pch = c(rep(16,3),rep(17,3)))
# 添加分隔线
abline(h=0,v=0,lty=2,col="gray")
# 添加标签
text(data.pca$x,labels = rownames(data.pca$x),pos = 4,offset = 0.6,cex = 1)
# 添加图例
legend("bottomright",title = "Sample",inset = 0.01,
       legend = rownames(data.pca$x),
       col = c(rep("red",3),rep("blue",3)),
       pch = c(rep(16,3),rep(17,3)))
使用ggplot2包绘制PCA图
library(ggplot2)

# 查看示例数据
head(USArrests)
##            Murder Assault UrbanPop Rape
## Alabama      13.2     236       58 21.2
## Alaska       10.0     263       48 44.5
## Arizona       8.1     294       80 31.0
## Arkansas      8.8     190       50 19.5
## California    9.0     276       91 40.6
## Colorado      7.9     204       78 38.7

# 使用princomp函数进行PCA分析
data.pca <- princomp(USArrests,cor = T)
# 查看PCA的结果
summary(data.pca)
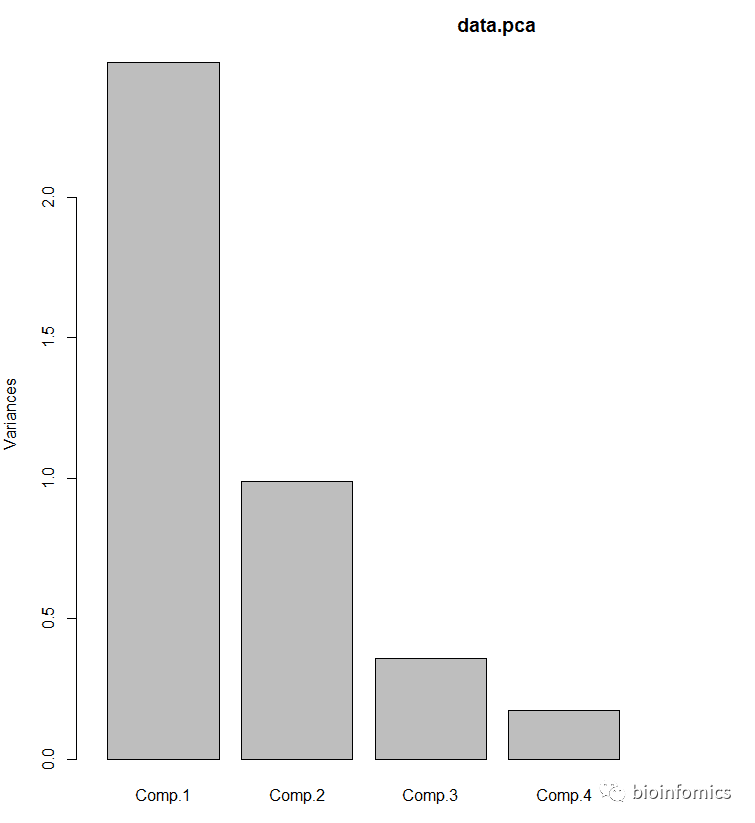
## Importance of components:
##                           Comp.1    Comp.2    Comp.3     Comp.4
## Standard deviation     1.5748783 0.9948694 0.5971291 0.41644938
## Proportion of Variance 0.6200604 0.2474413 0.0891408 0.04335752
## Cumulative Proportion  0.6200604 0.8675017 0.9566425 1.00000000

# 绘制主成分碎石图
screeplot(data.pca,npcs = 6,type = "barplot")
#查看主成分的结果
pca.scores <- as.data.frame(data.pca$scores)
head(pca.scores)
##                Comp.1     Comp.2      Comp.3       Comp.4
## Alabama     0.9855659  1.1333924  0.44426879  0.156267145
## Alaska      1.9501378  1.0732133 -2.04000333 -0.438583440
## Arizona     1.7631635 -0.7459568 -0.05478082 -0.834652924
## Arkansas   -0.1414203  1.1197968 -0.11457369 -0.182810896
## California  2.5239801 -1.5429340 -0.59855680 -0.341996478
## Colorado    1.5145629 -0.9875551 -1.09500699  0.001464887

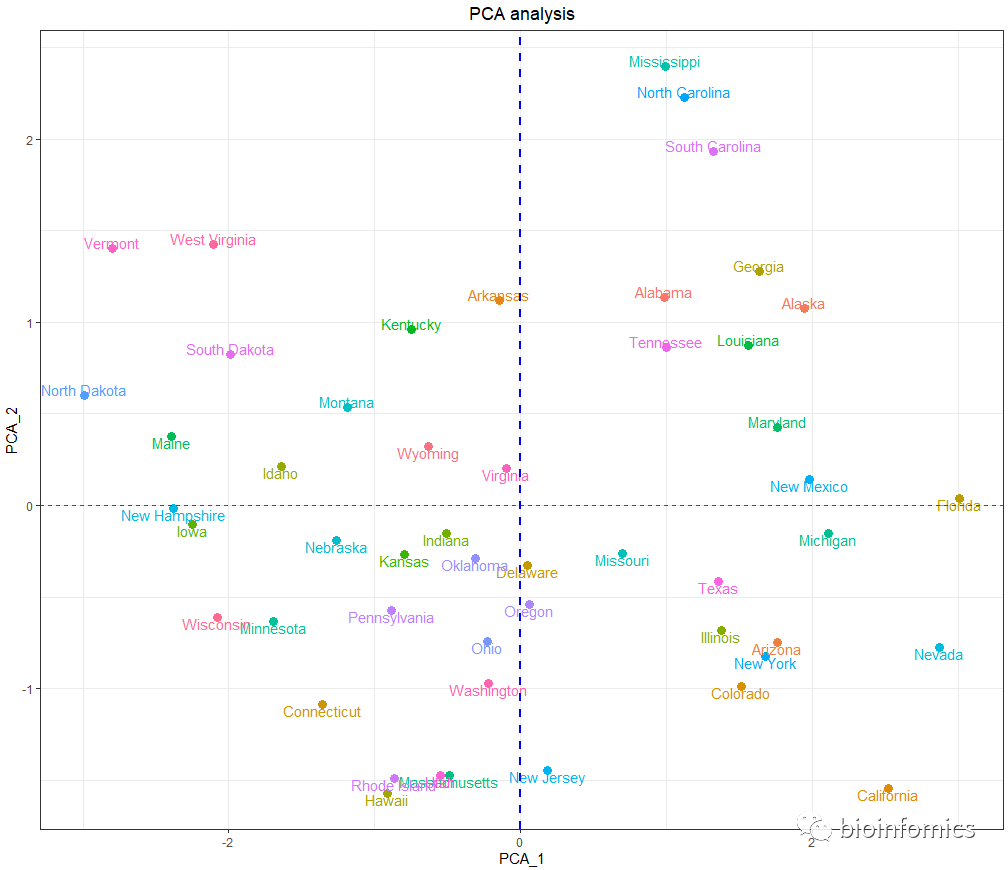
# 绘制PCA图
ggplot(pca.scores,aes(Comp.1,Comp.2,col=rownames(pca.scores))) +
  geom_point(size=3) +
  geom_text(aes(label=rownames(pca.scores)),vjust = "outward") +
  geom_hline(yintercept = 0,lty=2,col="red") +
  geom_vline(xintercept = 0,lty=2,col="blue",lwd=1) +
  theme_bw() + theme(legend.position = "none") +
  theme(plot.title = element_text(hjust = 0.5)) +
  labs(x="PCA_1",y="PCA_2",title = "PCA analysis")
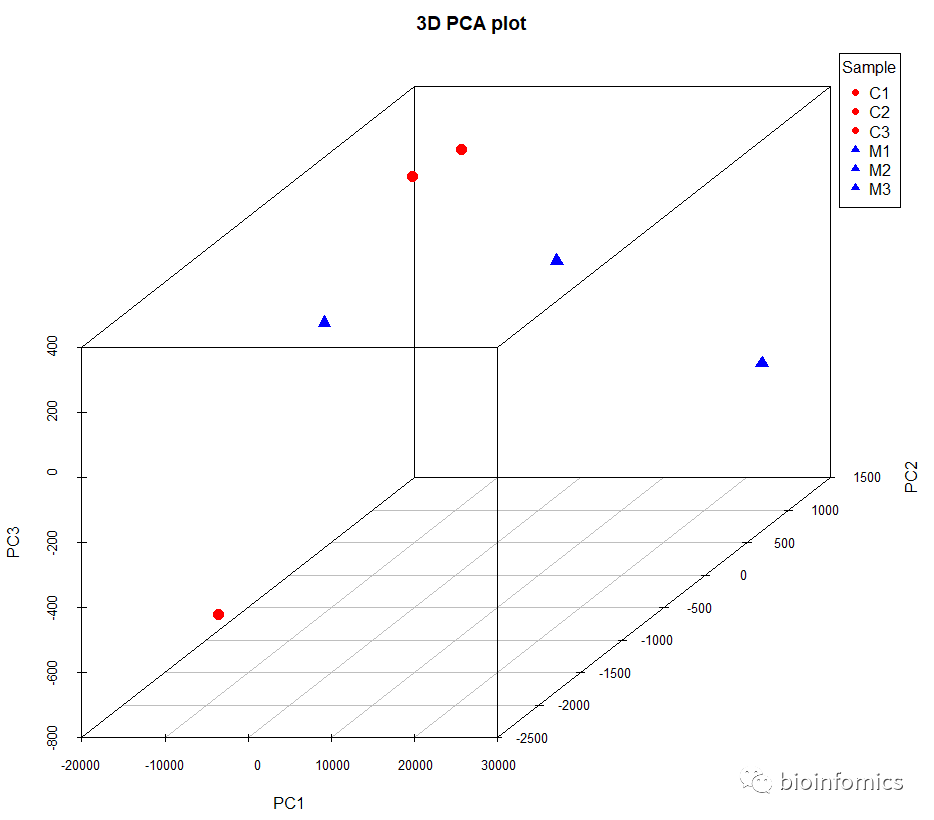
使用scatterplot3d包绘制三维PCA图
library(scatterplot3d)

# 加载示例数据
data <- read.table("demo_pca.txt",header = T,row.names = 1,sep="\t",check.names = F)
head(data)
##                  C1       C2       C3        M1        M2        M3
## AT1G01060 33.035800 35.55930 34.64920 10.294500 13.393800 13.659000
## AT1G01320 73.740400 76.31340 69.04050 17.208400 19.669500 17.630300
## AT1G01420  6.667900  6.66516  7.94002  2.863710  3.834140  3.432600
## AT1G01520  9.588620  8.55635  9.32078  0.982357  2.876840  2.188840
## AT1G01970 17.210700 15.13220 18.35080  7.080410  7.748770  7.272220
## AT1G02380  0.749953  1.95807  1.44847  0.934699  0.367559  0.703017

# 数据转置,转换成行为样本,列为基因的矩阵
data <- t(data)

# 使用prcomp函数进行PCA分析
data.pca <- prcomp(data)

# 绘制三维PCA图
scatterplot3d(data.pca$x[,1:3],
              pch = c(rep(16,3),rep(17,3)),
              color= c(rep("red",3),rep("blue",3)),
              angle=45, main= "3D PCA plot",
              cex.symbols= 1.5,,mar=c(5, 4, 4, 5))
# 添加图例
legend("topright",title = "Sample",
       xpd=TRUE,inset= -0.01,
       legend = rownames(data.pca$x),
       col = c(rep("red",3),rep("blue",3)),
       pch = c(rep(16,3),rep(17,3)))
使用factoextra包绘制PCA图
library(factoextra)

# 查看示例数据
head(iris)
##   Sepal.Length Sepal.Width Petal.Length Petal.Width Species
## 1          5.1         3.5          1.4         0.2  setosa
## 2          4.9         3.0          1.4         0.2  setosa
## 3          4.7         3.2          1.3         0.2  setosa
## 4          4.6         3.1          1.5         0.2  setosa
## 5          5.0         3.6          1.4         0.2  setosa
## 6          5.4         3.9          1.7         0.4  setosa

# 使用prcomp函数进行PCA分析
res.pca <- prcomp(iris[, -5],  scale = TRUE)
res.pca
## Standard deviations (1, .., p=4):
## [1] 1.7083611 0.9560494 0.3830886 0.1439265
##
## Rotation (n x k) = (4 x 4):
##                     PC1         PC2        PC3        PC4
## Sepal.Length  0.5210659 -0.37741762  0.7195664  0.2612863
## Sepal.Width  -0.2693474 -0.92329566 -0.2443818 -0.1235096
## Petal.Length  0.5804131 -0.02449161 -0.1421264 -0.8014492
## Petal.Width   0.5648565 -0.06694199 -0.6342727  0.5235971

#绘制主成分碎石图
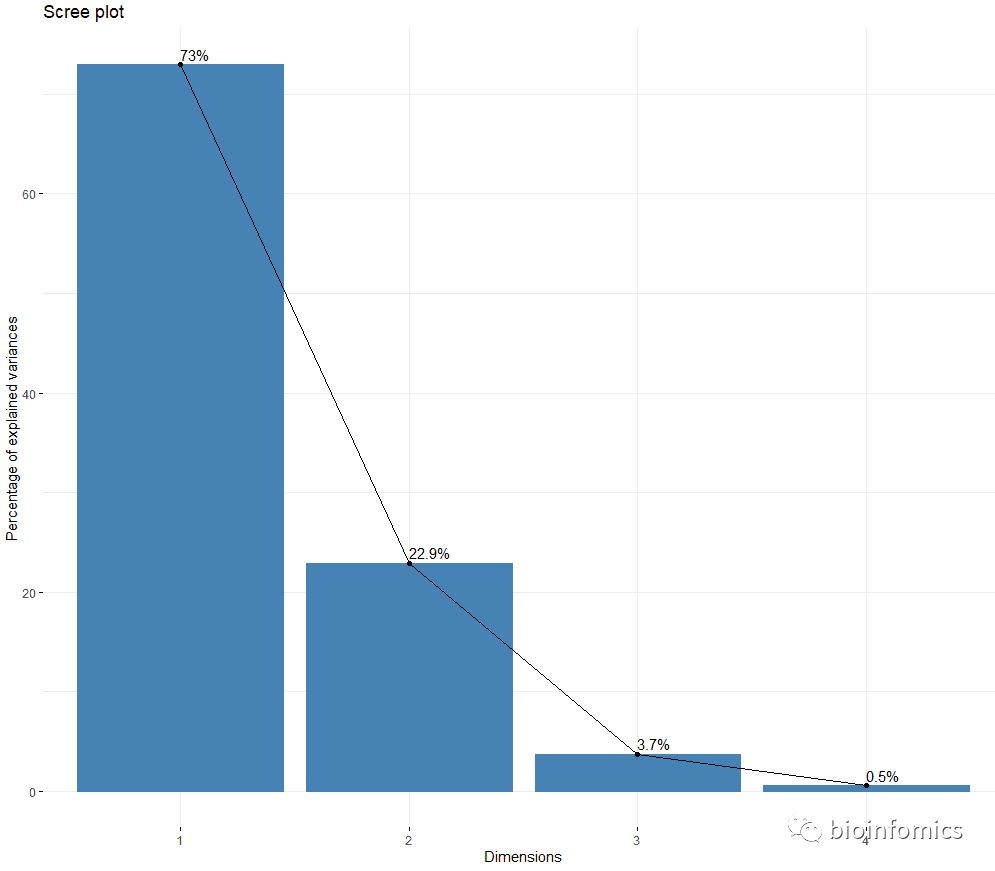
fviz_screeplot(res.pca, addlabels = TRUE)
# 可视化PCA分析的结果
# Graph of individuals
# +++++++++++++++++++++
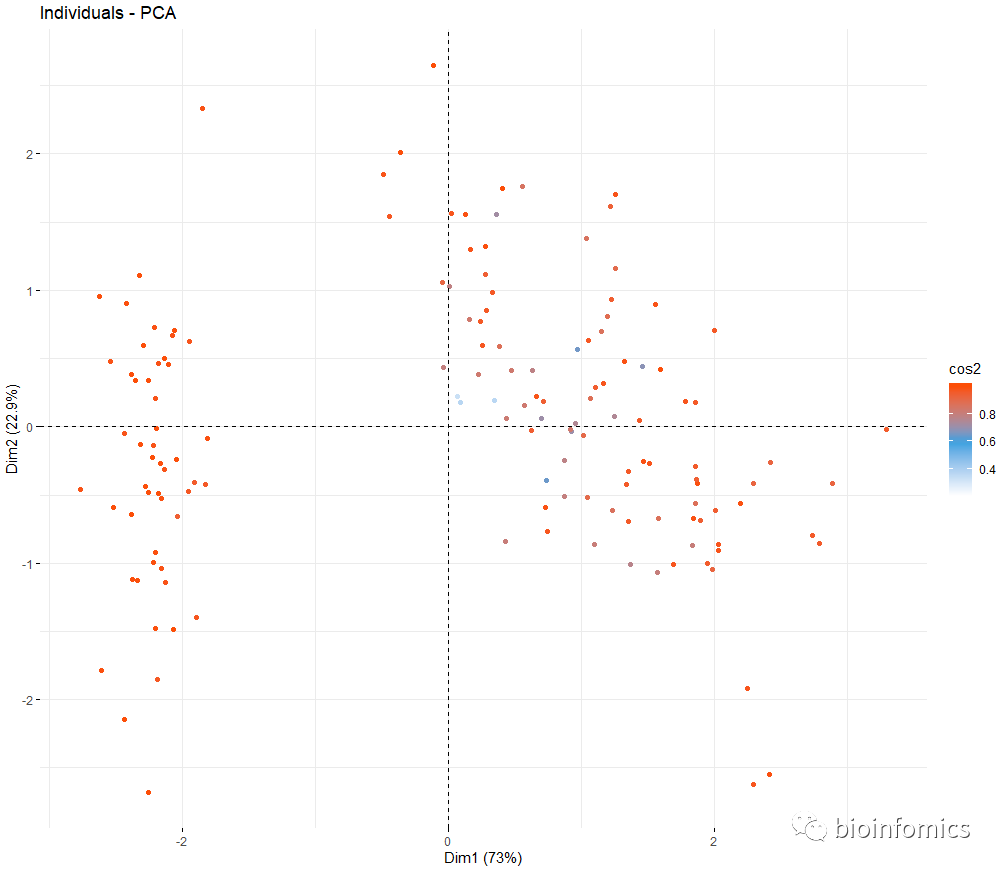
fviz_pca_ind(res.pca, col.ind="cos2",
             geom = "point", # show points only
             gradient.cols = c("white", "#2E9FDF", "#FC4E07" ))
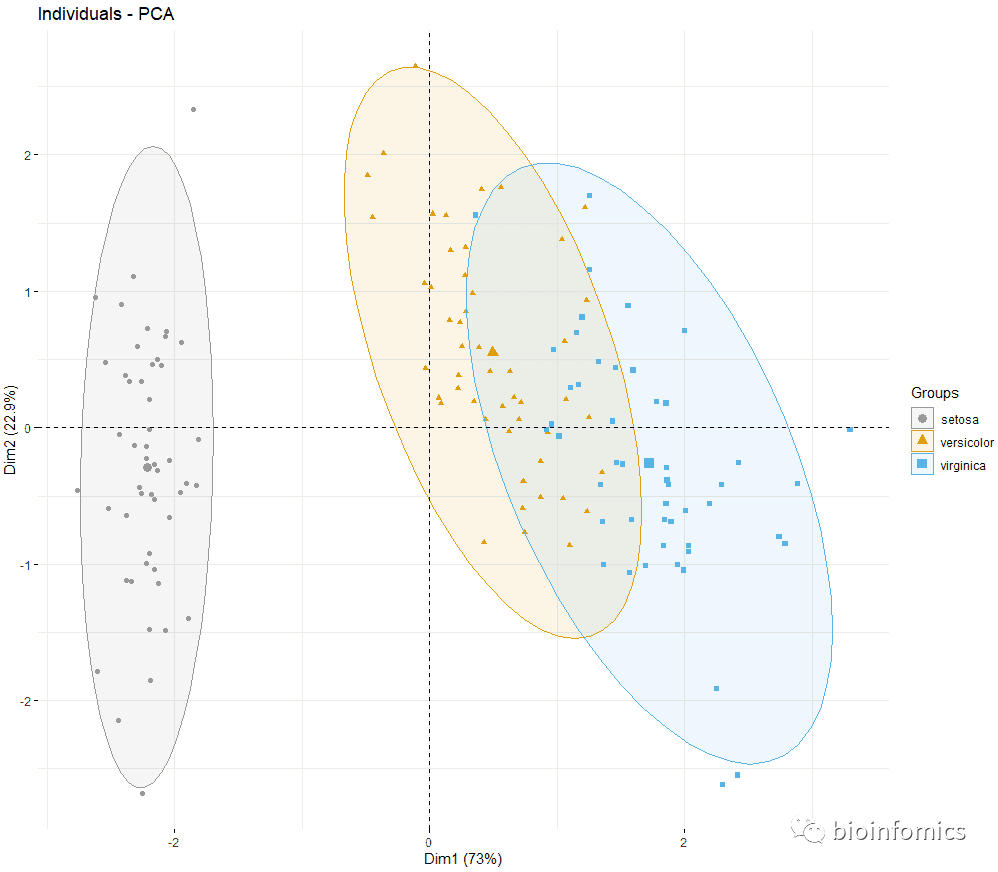
fviz_pca_ind(res.pca, label="none", habillage=iris$Species,
             addEllipses=TRUE, ellipse.level=0.95,
             palette = c("#999999", "#E69F00", "#56B4E9"))
# Graph of variables
# +++++++++++++++++++++
# Default plot
fviz_pca_var(res.pca, col.var = "steelblue")
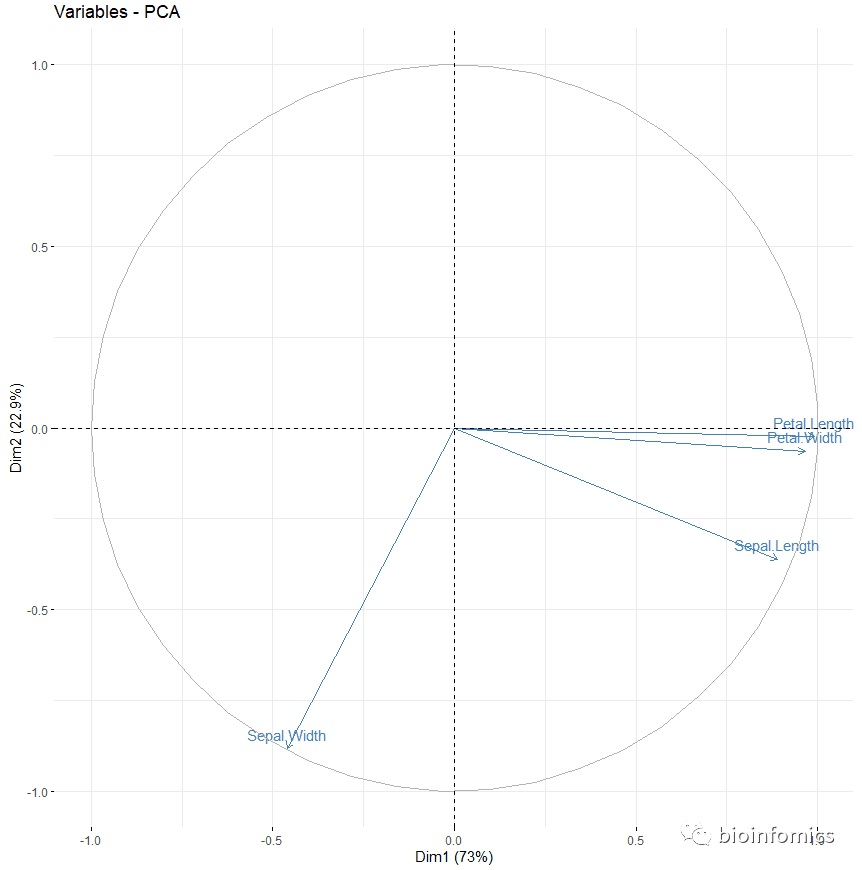
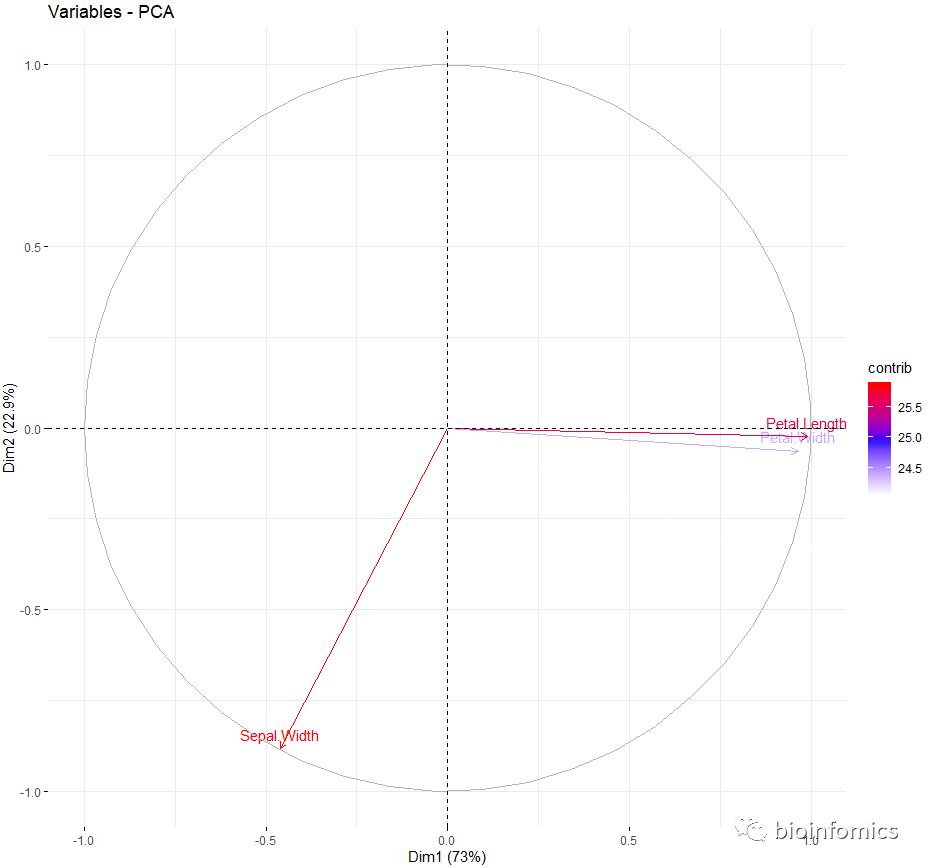
# Control variable colors using their contributions
fviz_pca_var(res.pca, col.var = "contrib",
             gradient.cols = c("white", "blue", "red"),
             ggtheme = theme_minimal())
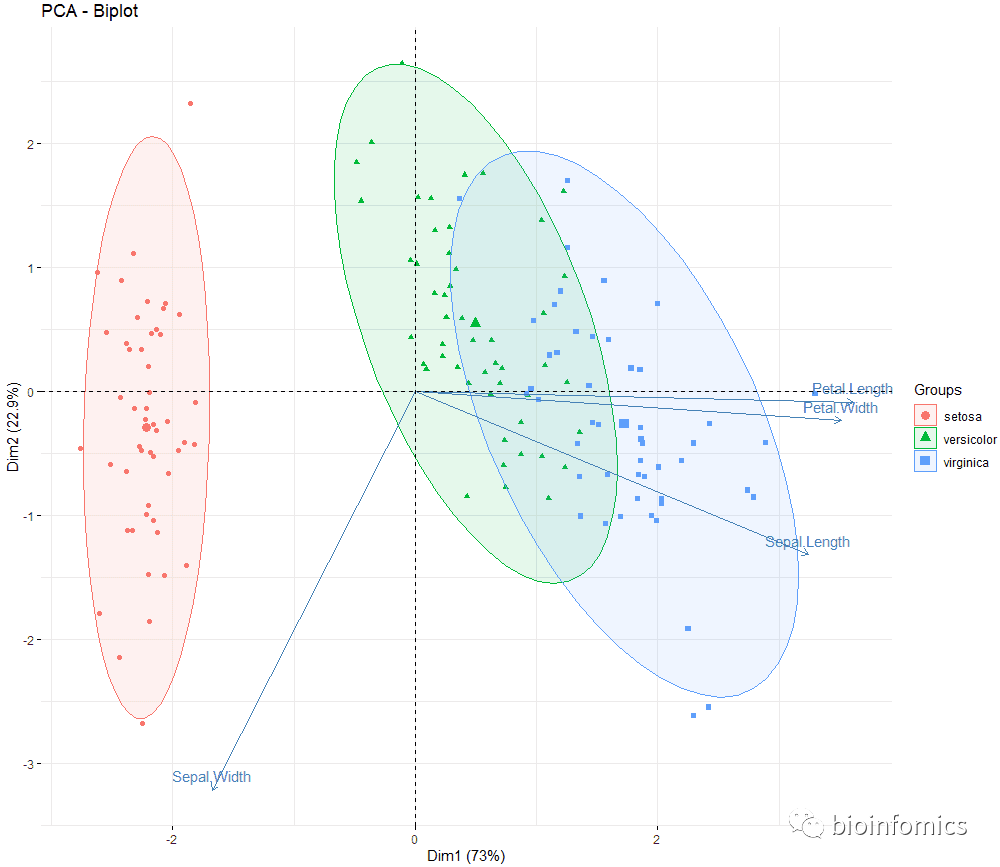
# Biplot of individuals and variables
# +++++++++++++++++++++
# Keep only the labels for variables
# Change the color by groups, add ellipses
fviz_pca_biplot(res.pca, label = "var", habillage=iris$Species,
                addEllipses=TRUE, ellipse.level=0.95,
                ggtheme = theme_minimal())
sessionInfo()
R version 3.6.0 (2019-04-26)
Platform: x86_64-w64-mingw32/x64 (64-bit)
Running under: Windows 10 x64 (build 18363)

Matrix products: default

locale:
[1] LC_COLLATE=Chinese (Simplified)_China.936
[2] LC_CTYPE=Chinese (Simplified)_China.936
[3] LC_MONETARY=Chinese (Simplified)_China.936
[4] LC_NUMERIC=C
[5] LC_TIME=Chinese (Simplified)_China.936

attached base packages:
[1] stats     graphics  grDevices utils     datasets  methods   base

other attached packages:
[1] FactoMineR_2.3       factoextra_1.0.7     scatterplot3d_0.3-41
[4] ggplot2_3.2.0

loaded via a namespace (and not attached):
 [1] Rcpp_1.0.5         pillar_1.4.2       compiler_3.6.0     RColorBrewer_1.1-2
 [5] ggpubr_0.2.1       tools_3.6.0        digest_0.6.20      evaluate_0.14
 [9] tibble_2.1.3       gtable_0.3.0       lattice_0.20-38    pkgconfig_2.0.2
[13] rlang_0.4.7        rstudioapi_0.10    ggrepel_0.8.1      yaml_2.2.0
[17] xfun_0.8           knitr_1.23         withr_2.1.2        dplyr_0.8.3
[21] cluster_2.0.8      flashClust_1.01-2  grid_3.6.0         tidyselect_0.2.5
[25] glue_1.3.1         R6_2.4.0           rmarkdown_1.13     purrr_0.3.2
[29] magrittr_1.5       htmltools_0.3.6    scales_1.0.0       leaps_3.1
[33] MASS_7.3-51.4      rsconnect_0.8.16   assertthat_0.2.1   colorspace_1.4-1
[37] ggsignif_0.5.0     labeling_0.3       lazyeval_0.2.2     munsell_0.5.0
[41] crayon_1.3.4

END


文章转载自bioinfomics,如果涉嫌侵权,请发送邮件至:contact@modb.pro进行举报,并提供相关证据,一经查实,墨天轮将立刻删除相关内容。


