


04.频率直方图绘制
清除当前环境中的变量
rm(list=ls())
设置工作目录
setwd("C:/Users/Dell/Desktop/R_Plots/04histogram/")
hist函数绘制频率直方图
# 使用内置mtcars数据集
head(mtcars)
## mpg cyl disp hp drat wt qsec vs am gear carb
## Mazda RX4 21.0 6 160 110 3.90 2.620 16.46 0 1 4 4
## Mazda RX4 Wag 21.0 6 160 110 3.90 2.875 17.02 0 1 4 4
## Datsun 710 22.8 4 108 93 3.85 2.320 18.61 1 1 4 1
## Hornet 4 Drive 21.4 6 258 110 3.08 3.215 19.44 1 0 3 1
## Hornet Sportabout 18.7 8 360 175 3.15 3.440 17.02 0 0 3 2
## Valiant 18.1 6 225 105 2.76 3.460 20.22 1 0 3 1
head(mtcars$mpg)
## [1] 21.0 21.0 22.8 21.4 18.7 18.1
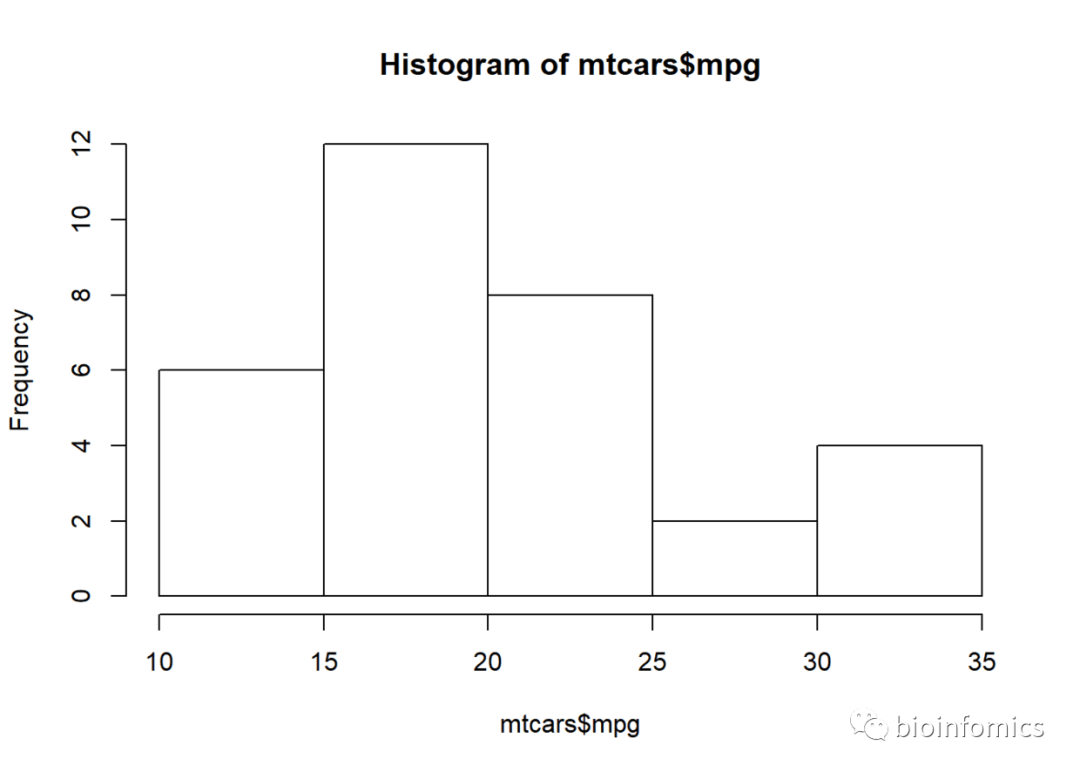
# 基础hist函数绘制频率直方图
hist(mtcars$mpg)
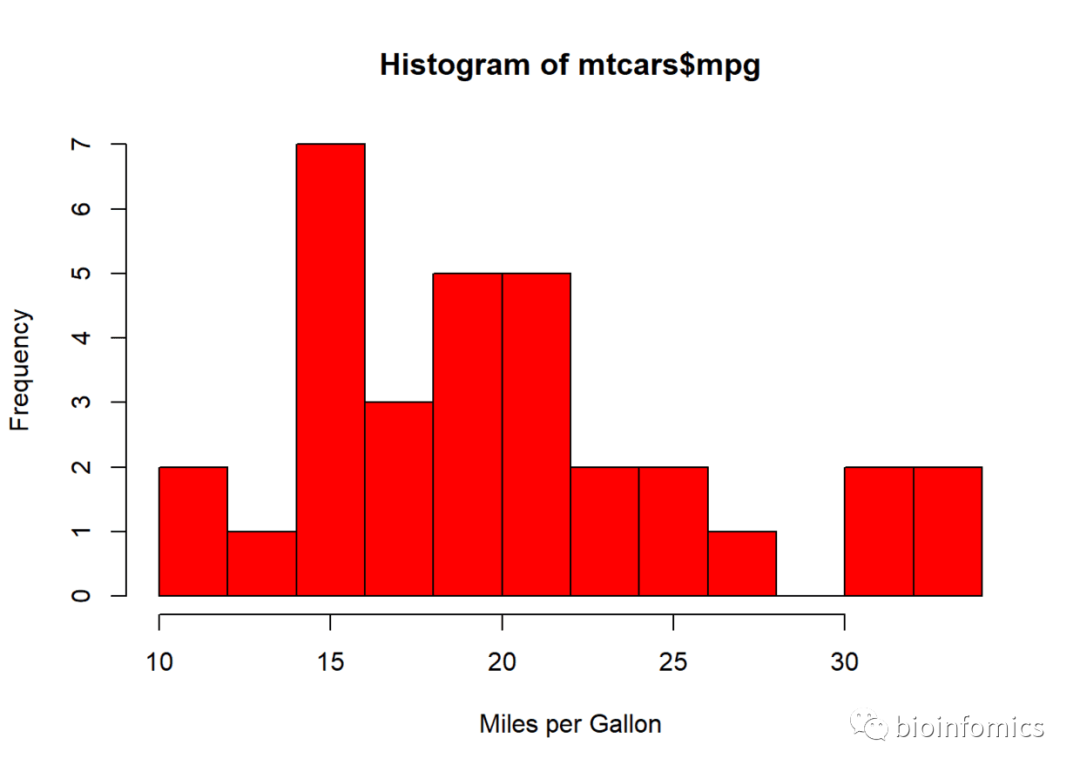
hist(mtcars$mpg, breaks = 10, col = "red",
     xlab = "Miles per Gallon")
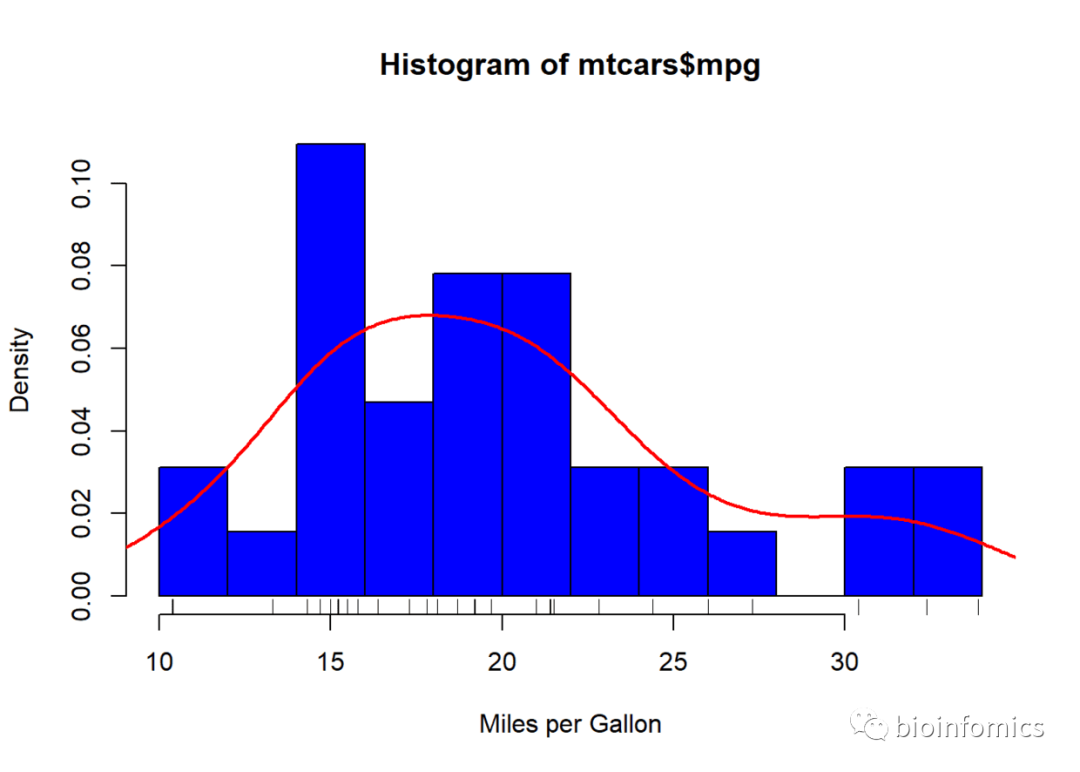
hist(mtcars$mpg, breaks = 10, col = "blue",
     freq = F, # 表示不按照频数绘图
     xlab = "Miles per Gallon")
# 添加密度曲线
lines(density(mtcars$mpg),col= "red",lwd=2)
# 添加轴须线
rug(jitter(mtcars$mpg))
ggplot2包绘制直方图
library(ggplot2)
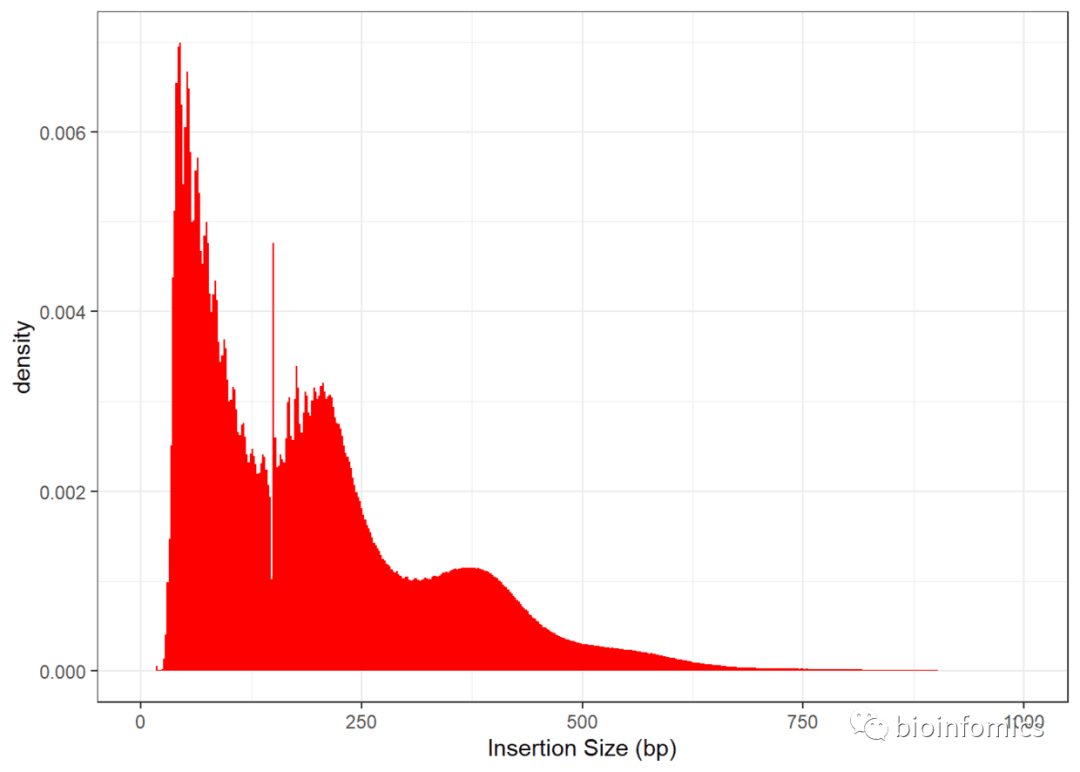
# 读取示例数据
data <- read.table("demo_histgram.txt")
names(data) <- "length"
head(data)
## length
## 1 62
## 2 134
## 3 290
## 4 316
## 5 98
## 6 129
ggplot(data,aes(length,..density..)) + xlim(c(0,1000)) +
geom_histogram(binwidth = 2, fill="red") +
xlab("Insertion Size (bp)") +
theme_bw()
# 使用diamonds内置数据集
head(diamonds)
## # A tibble: 6 x 10
## carat cut color clarity depth table price x y z
## <dbl> <ord> <ord> <ord> <dbl> <dbl> <int> <dbl> <dbl> <dbl>
## 1 0.23 Ideal E SI2 61.5 55 326 3.95 3.98 2.43
## 2 0.21 Premium E SI1 59.8 61 326 3.89 3.84 2.31
## 3 0.23 Good E VS1 56.9 65 327 4.05 4.07 2.31
## 4 0.290 Premium I VS2 62.4 58 334 4.2 4.23 2.63
## 5 0.31 Good J SI2 63.3 58 335 4.34 4.35 2.75
## 6 0.24 Very Good J VVS2 62.8 57 336 3.94 3.96 2.48
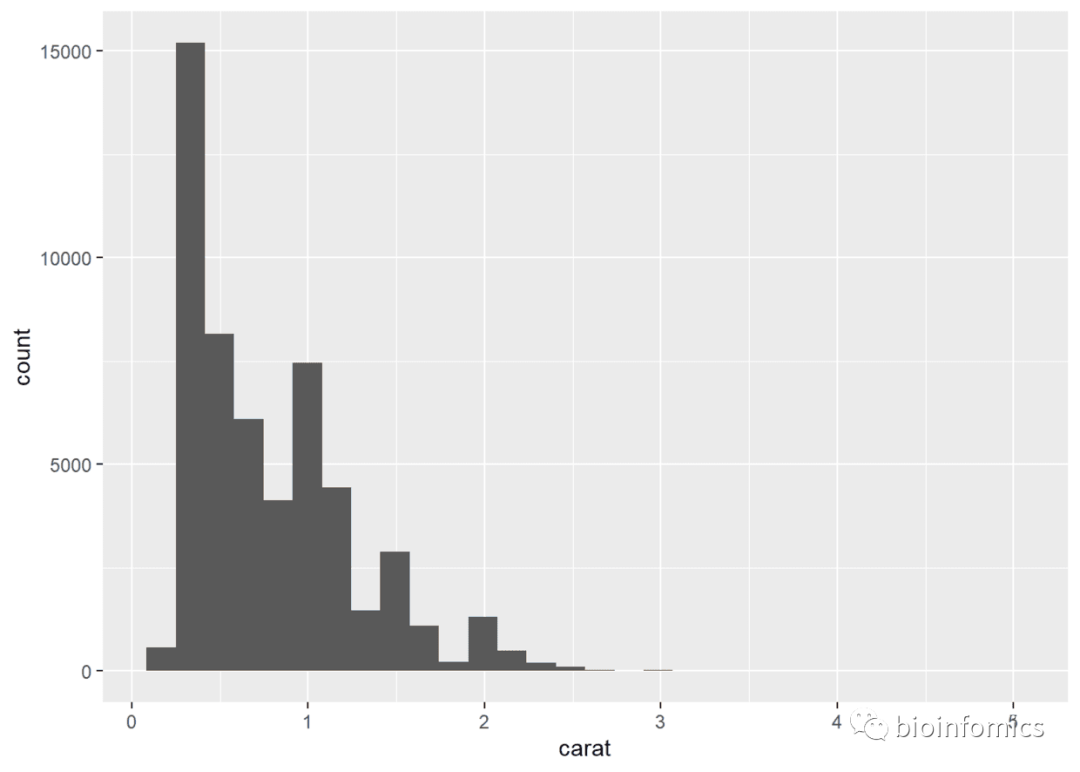
ggplot(diamonds, aes(carat)) +
geom_histogram()
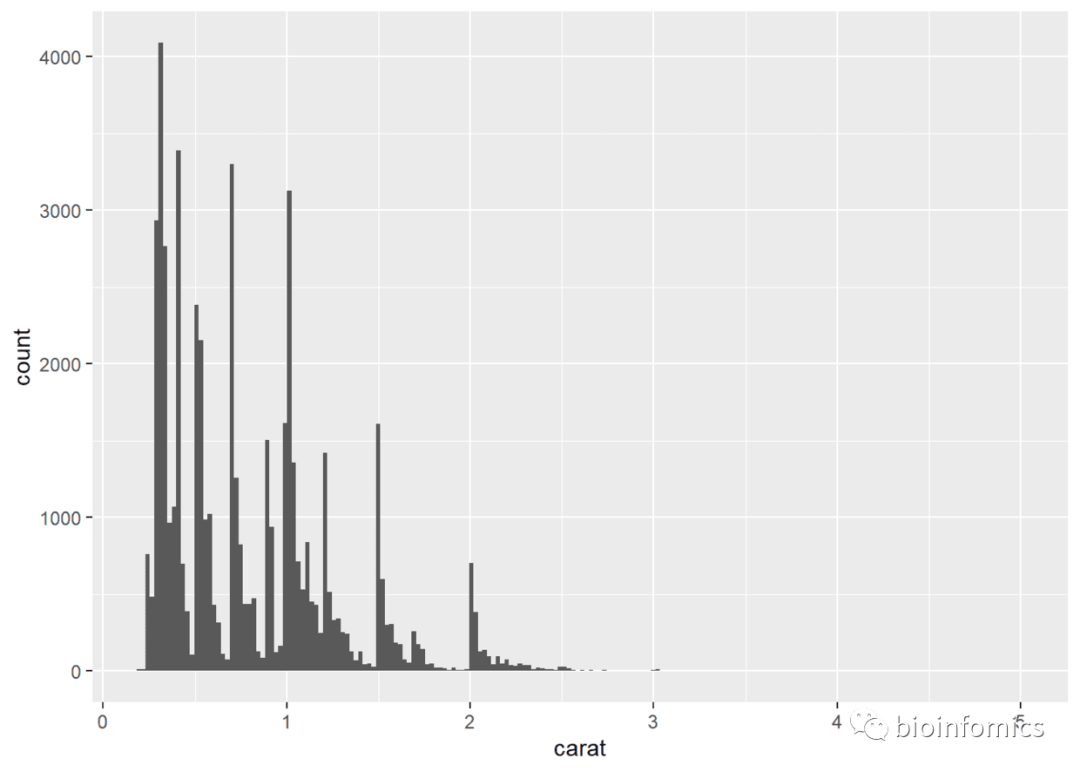
# 设置bin的数目
ggplot(diamonds, aes(carat)) +
  geom_histogram(bins = 200)
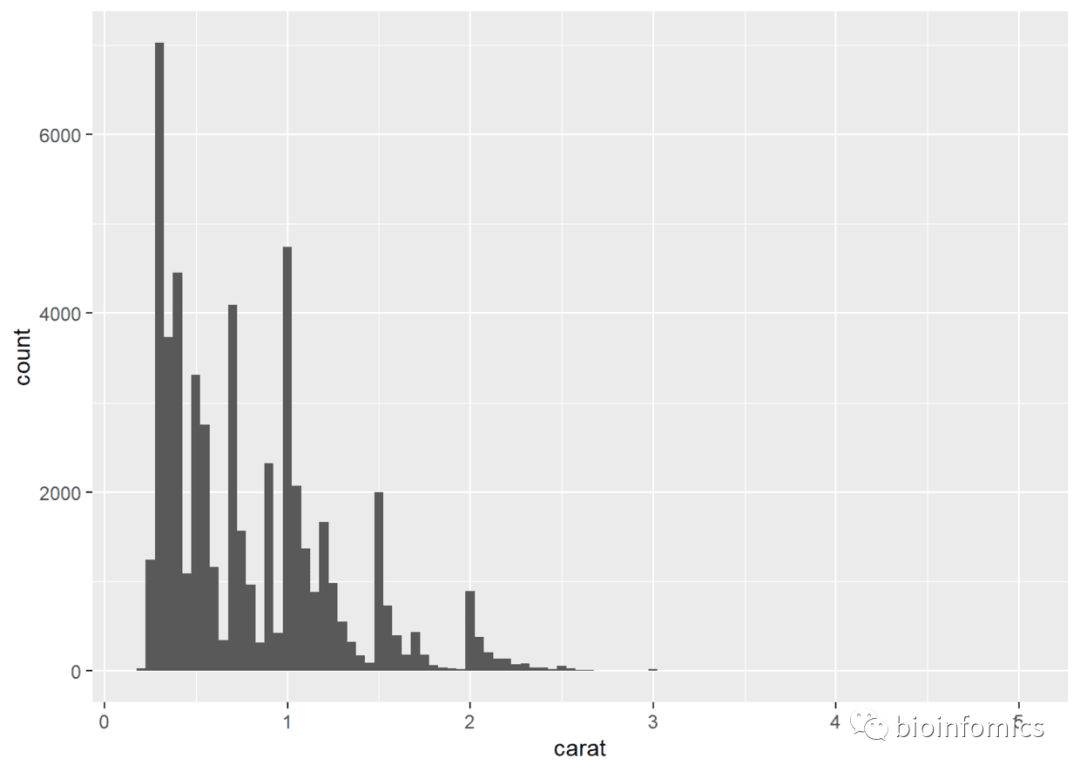
# 设置bin的宽度
ggplot(diamonds, aes(carat)) +
  geom_histogram(binwidth = 0.05)
# 添加填充色
ggplot(diamonds, aes(price, fill = cut)) +
  geom_histogram(binwidth = 500)

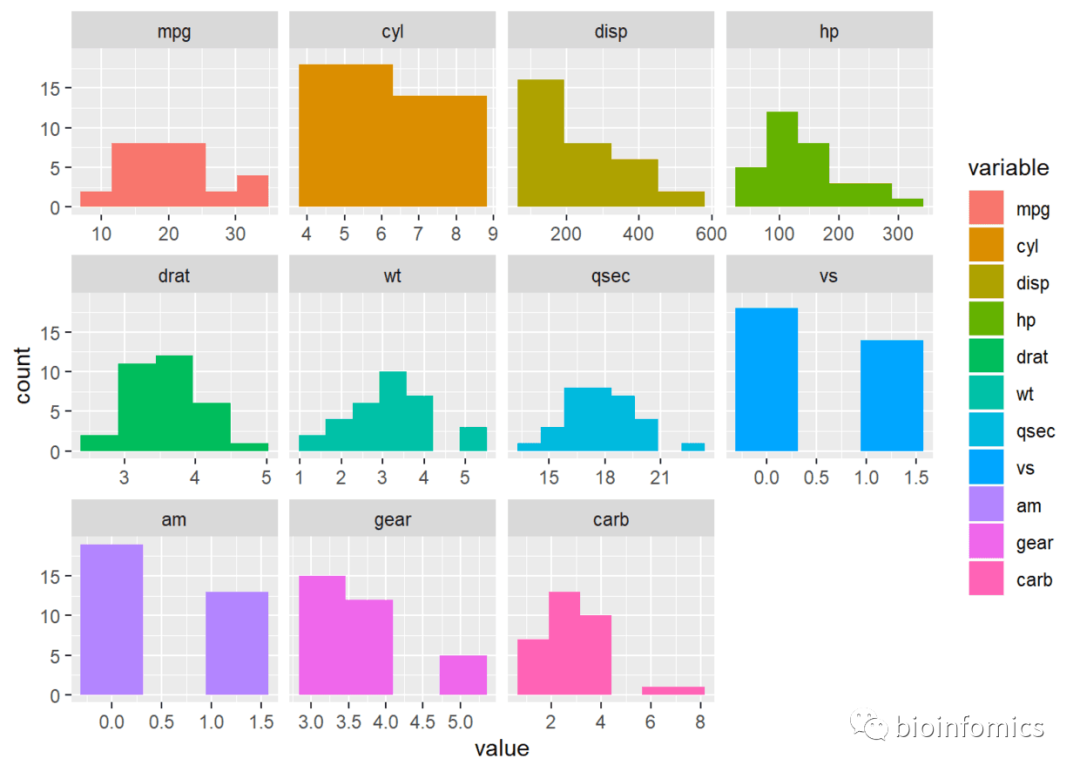
# You can specify a function for calculating binwidth, which is
# particularly useful when faceting along variables with
# different ranges because the function will be called once per facet
mtlong <- reshape2::melt(mtcars)
## No id variables; using all as measure variables

head(mtlong)
##   variable value
## 1      mpg  21.0
## 2      mpg  21.0
## 3      mpg  22.8
## 4      mpg  21.4
## 5      mpg  18.7
## 6      mpg  18.1

ggplot(mtlong, aes(value, fill=variable)) + facet_wrap(~variable, scales = 'free_x') +
  geom_histogram(binwidth = function(x) 2 * IQR(x) / (length(x)^(1/3)))
ggpubr包绘制直方图
library(ggpubr)
# Create some data format
set.seed(1234)
wdata = data.frame(
sex = factor(rep(c("F", "M"), each=200)),
weight = c(rnorm(200, 55), rnorm(200, 58)))
head(wdata)
## sex weight
## 1 F 53.79293
## 2 F 55.27743
## 3 F 56.08444
## 4 F 52.65430
## 5 F 55.42912
## 6 F 55.50606
# Basic density plot
# Add mean line and marginal rug
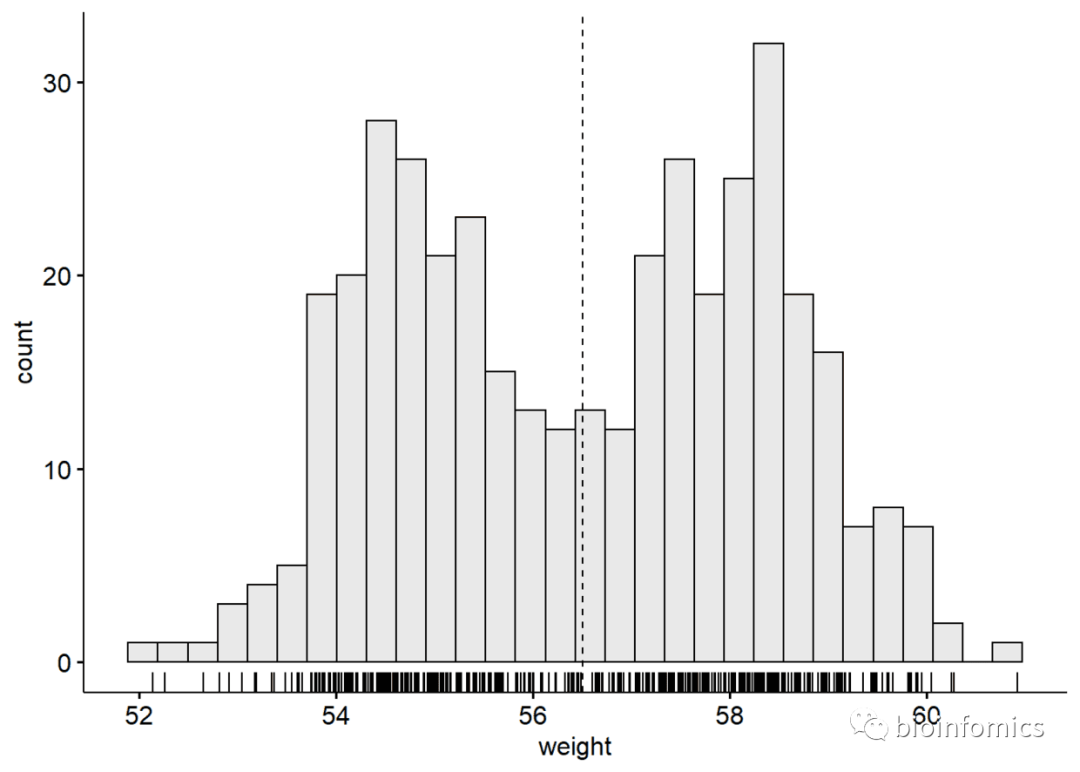
gghistogram(wdata, x = "weight",
fill = "lightgray", # 设置填充色
add = "mean", # 添加均值线
rug = TRUE # 添加轴须线
)
# Change outline and fill colors by groups ("sex")
# Use custom color palette
gghistogram(wdata, x = "weight",
            add = "mean", rug = TRUE,
            color = "sex", fill = "sex",
            palette = c("#00AFBB", "#E7B800") # 设置画板颜色
            )

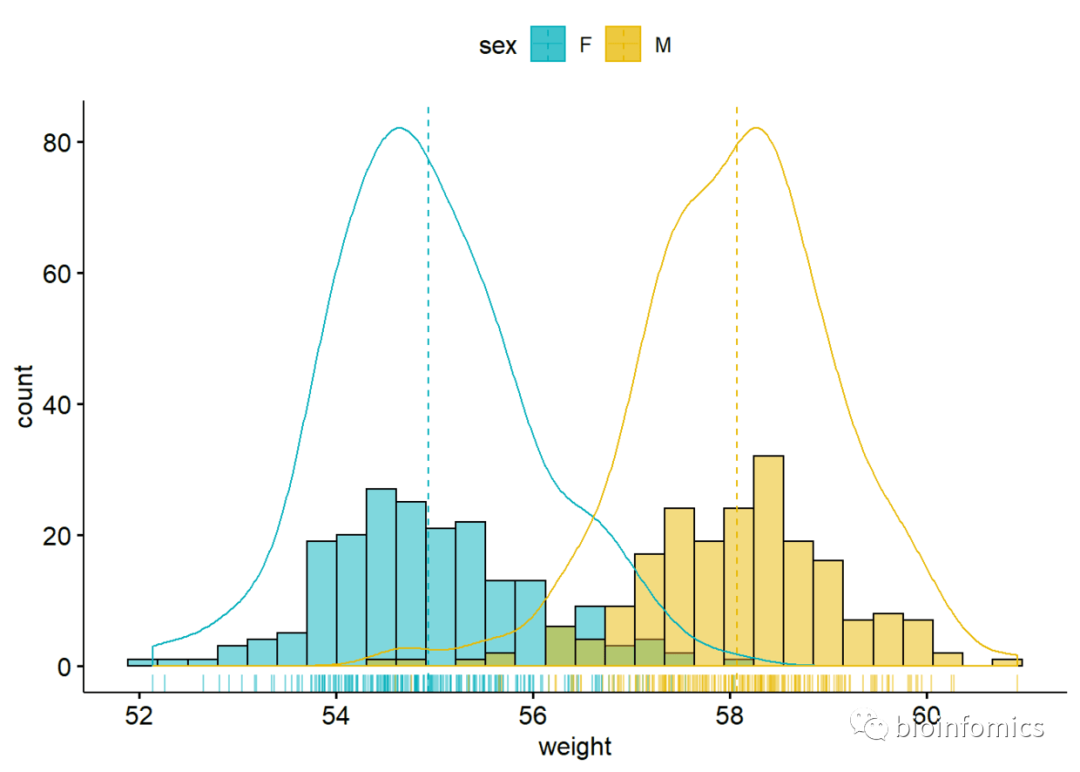
# Combine histogram and density plots
gghistogram(wdata, x = "weight",
            add = "mean", rug = TRUE,
            fill = "sex", palette = c("#00AFBB", "#E7B800"),
            add_density = TRUE # 添加密度曲线
            )
sessionInfo()
## R version 3.6.0 (2019-04-26)
## Platform: x86_64-w64-mingw32/x64 (64-bit)
## Running under: Windows 10 x64 (build 18363)
##
## Matrix products: default
##
## locale:
## [1] LC_COLLATE=Chinese (Simplified)_China.936
## [2] LC_CTYPE=Chinese (Simplified)_China.936
## [3] LC_MONETARY=Chinese (Simplified)_China.936
## [4] LC_NUMERIC=C
## [5] LC_TIME=Chinese (Simplified)_China.936
##
## attached base packages:
## [1] stats     graphics  grDevices utils     datasets  methods   base
##
## other attached packages:
## [1] ggpubr_0.2.1  magrittr_1.5  ggplot2_3.2.0
##
## loaded via a namespace (and not attached):
##  [1] Rcpp_1.0.1        plyr_1.8.4        pillar_1.4.2
##  [4] compiler_3.6.0    tools_3.6.0       zeallot_0.1.0
##  [7] digest_0.6.20     viridisLite_0.3.0 evaluate_0.14
## [10] tibble_2.1.3      gtable_0.3.0      pkgconfig_2.0.2
## [13] rlang_0.4.0       cli_1.1.0         yaml_2.2.0
## [16] xfun_0.8          withr_2.1.2       dplyr_0.8.3
## [19] stringr_1.4.0     knitr_1.23        vctrs_0.2.0
## [22] grid_3.6.0        tidyselect_0.2.5  glue_1.3.1
## [25] R6_2.4.0          fansi_0.4.0       rmarkdown_1.13
## [28] reshape2_1.4.3    purrr_0.3.2       scales_1.0.0
## [31] backports_1.1.4   htmltools_0.3.6   assertthat_0.2.1
## [34] colorspace_1.4-1  ggsignif_0.5.0    labeling_0.3
## [37] utf8_1.1.4        stringi_1.4.3     lazyeval_0.2.2
## [40] munsell_0.5.0     crayon_1.3.4

END


文章转载自bioinfomics,如果涉嫌侵权,请发送邮件至:contact@modb.pro进行举报,并提供相关证据,一经查实,墨天轮将立刻删除相关内容。
