


背景
最近有开发反馈每个月1号insert表比平时要慢20-30分钟左右。然后取操作时间段的ASH报告发现正好是相关Insert 引起的db file sequential read等待事件:
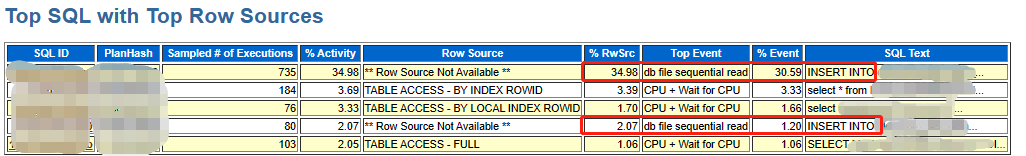
等待事件发生的IO基本都是索引表空间
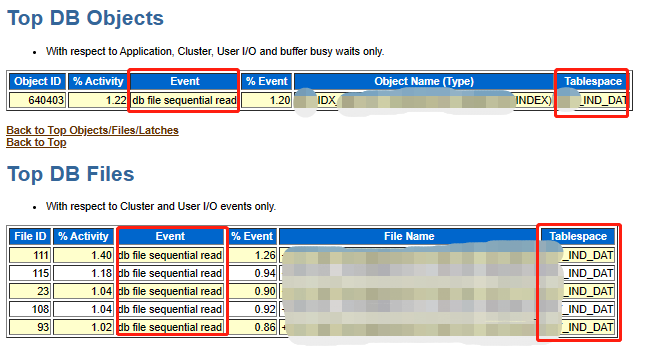
考虑到影响到Insert效率的一般均为索引,结合db file sequential read,基本可以诊断为数据库在将索引从磁盘读取到SGA时导致的慢。
介绍:db file sequential read
db file sequential read是一种IO读请求相关的等待。与”db file scattered read“不同,因为”sequential read“是将数据读到连续的内存(注意:这里指的是读到相连的内存,不是说读取的是连续的数据块。同时一次”scattered read“可以读多个块,将他们分散到SGA的不同buffer)。这一事件通常显示与单个数据块相关的读取操作(如索引读取)。如果这个等待事件比较显著,可能表示在多表连接中,表的连接顺序存在问题,可能没有正确的使用驱动表;或者可能说明不加选择地进行索引。
一次”sequential read“通常是单块读,尽管可能看到对于多个块的”sequential read“。这种等待也可能在数据文件头读取中看到(P2=1表明是读取文件头)。
根据生产情况复现:Insert 引起 db file sequential read 示例:
-- 创建测试表tmp 保留源表(SYS_P14220)分区数据
SQL> create table tmp_SYS_P14220 as select * From t1 partition (SYS_P14220);
Table created.
-- 删除源表SYS_P14220 分区数据
SQL> alter table t1 truncate partition (SYS_P14220) update indexes;
Table truncated.
-- 打开10046 会话跟踪:
SQL> alter session set events '10046 trace name context forever,level 12';
Session altered.
-- 往表中插入大量数据
SQL> insert into  t1 select * from tmp_SYS_P14220 where CREATE_DATE>to_date('20231015','yyyymmdd') and CREATE_DATE<to_date('20231016','yyyymmdd');
794497 rows created.
SQL> commit;
Commit complete.
-- 插入完成后,关闭10046
SQL> alter session set events '10046 trace name context  off';
Session altered.
-- 查看trace 文件目录 :
 SQL> select tracefile from v$process where addr=(select paddr from v$session where sid=(select distinct sid from v$mystat));
TRACEFILE
--------------------------------------------------------------------------------
/u01/oracle/diag/rdbms/two/two/trace/two_ora_3234.trc
-- 查看trace 文件 :
[root@twodb ~]#cat /u01/oracle/diag/rdbms/two/two/trace/two_ora_3234.trc | less
=====================
PARSING IN CURSOR #139756929115448 len=79 dep=0 uid=0 oct=2 lid=0 tim=1700483278294940 hv=3792282112 ad='513cc04a0' sqlid='2aj9hjzj0m8h0'
 insert into  t1 select * from tmp_SYS_P14220 where CREATE_DATE>to_date('20231015','yyyymmdd') and CREATE_DATE<to_date('20231016','yyyymmdd');
END OF STMT
PARSE #139756929115448:c=76989,e=346233,p=154,cr=198,cu=0,mis=1,r=0,dep=0,og=1,plh=3131486614,tim=1700483278294939
WAIT #139756929115448: nam='db file scattered read' ela= 6579 file#=6 block#=203 blocks=5 obj#=77121 tim=1700483278301925
WAIT #139756929115448: nam='db file sequential read' ela= 14 file#=6 block#=27920 blocks=1 obj#=76912 tim=1700483278302668
WAIT #139756929115448: nam='db file sequential read' ela= 42 file#=6 block#=27919 blocks=1 obj#=76912 tim=1700483278302802
WAIT #139756929115448: nam='db file sequential read' ela= 16 file#=6 block#=27904 blocks=1 obj#=76912 tim=1700483278303077
WAIT #139756929115448: nam='db file scattered read' ela= 2241 file#=8 block#=128 blocks=8 obj#=77121 tim=1700483278313280
WAIT #139756929115448: nam='db file scattered read' ela= 25 file#=6 block#=209 blocks=7 obj#=77121 tim=1700483278322700
=====================
SQL> select OBJECT_NAME from all_objects where OBJECT_ID='77121';
OBJECT_NAME
------------------------------
TMP_SYS_P14220

SQL>  select OBJECT_NAME from all_objects where OBJECT_ID='76912';
OBJECT_NAME
------------------------------
T1
-- 格式化trace 文件 :
[root@twodb ~]#tkprof /u01/oracle/diag/rdbms/two/two/trace/two_ora_3234.trc two_ora_3234.sql
-- 查看格式化trace :
[root@twodb ~]#cat two_ora_3234.sql

********************************************************************************
SQL ID: 28uudbqtq2949 Plan Hash: 3131486614
 insert into  t1 select * from tmp_SYS_P14220 where CREATE_DATE>to_date('20231015','yyyymmdd') and CREATE_DATE<to_date('20231016','yyyymmdd');
call     count       cpu    elapsed       disk      query    current        rows
------- ------  -------- ---------- ---------- ---------- ----------  ----------
Parse        1      0.00       0.00          0          0          0           0
Execute      1     35.34      46.81     672898    1484472    3205992      794497
Fetch        0      0.00       0.00          0          0          0           0
------- ------  -------- ---------- ---------- ---------- ----------  ----------
total        2     35.34      46.81     672898    1484472    3205992      794497

Misses in library cache during parse: 1
Optimizer mode: ALL_ROWS
Parsing user id: SYS
Number of plan statistics captured: 1

Rows (1st) Rows (avg) Rows (max)  Row Source Operation
---------- ---------- ----------  ---------------------------------------------------
         0          0          0  LOAD TABLE CONVENTIONAL  (cr=1484760 pr=672898 pw=0 time=46826365 us)
    794497     794497     794497   TABLE ACCESS FULL TMP_SYS_P14220(cr=1374956 pr=672881 pw=0 time=7750080 us cost=374455 size=312265
116 card=778716)

Elapsed times include waiting on following events:
  Event waited on                             Times   Max. Wait  Total Waited
  ----------------------------------------   Waited  ----------  ------------
  Disk file operations I/O                        5        0.00          0.00
  db file scattered read                       5734        0.12          5.56
  db file sequential read                       447        0.01          0.12
  log buffer space                               49        1.11          6.74
  log file switch completion                      4        0.41          0.92
  SQL*Net message to client                       1        0.00          0.00
  SQL*Net message from client                     1        0.00          0.00
********************************************************************************
解决思路:
1、删除表中没有必要的索引;
-- 删除无用主键索引:
-- 删除主键约束:
SQL> alter table t1 drop constraint PK_t1_ID;
-- 删除索引
SQL> drop index PK_t1_ID;
2、卸载表中无用的历史数据,并通过在线重建索引的方法整理索引碎片,使索引尽量的小从而提高加载索引的效率,减少IO;
-- 分区索引拼接重建SQL
select 'alter index '|| index_name || ' rebuild partition '|| partition_name || ' online tablespace 表名称;' from user_ind_partitions where index_name  in ('索引名称');
3、尝试做索引保持(前提是DB_KEEP_CACHE_SIZE是够大)示例如下:
SQL> show parameter  DB_KEEP_CACHE_SIZE
NAME                                 TYPE        VALUE
------------------------------------ ----------- --------
db_keep_cache_size                   big integer 200M
-- 分区索引
SQL> ALTER INDEX TWO.IDX01 MODIFY DEFAULT ATTRIBUTES  STORAGE (BUFFER_POOL KEEP);
索引已更改。
-- 查看
SQL> select index_name,BUFFER_POOL from dba_indexes where  INDEX_NAME='IDX01';

INDEX_NAME                     BUFFER_
------------------------------ -------
IDX01
-- 普通索引
SQL>ALTER INDEX TWO.IDX1 STORAGE ( BUFFER_POOL KEEP);
索引已更改。
SQL> select index_name,BUFFER_POOL from dba_indexes where  BUFFER_POOL='KEEP';
INDEX_NAME                     BUFFER_
------------------------------ -------
IDX1                            KEEP
【版权声明】本文为墨天轮用户原创内容,转载时必须标注文章的来源(墨天轮),文章链接,文章作者等基本信息,否则作者和墨天轮有权追究责任。如果您发现墨天轮中有涉嫌抄袭或者侵权的内容,欢迎发送邮件至:contact@modb.pro进行举报,并提供相关证据,一经查实,墨天轮将立刻删除相关内容。
