


监控架构图
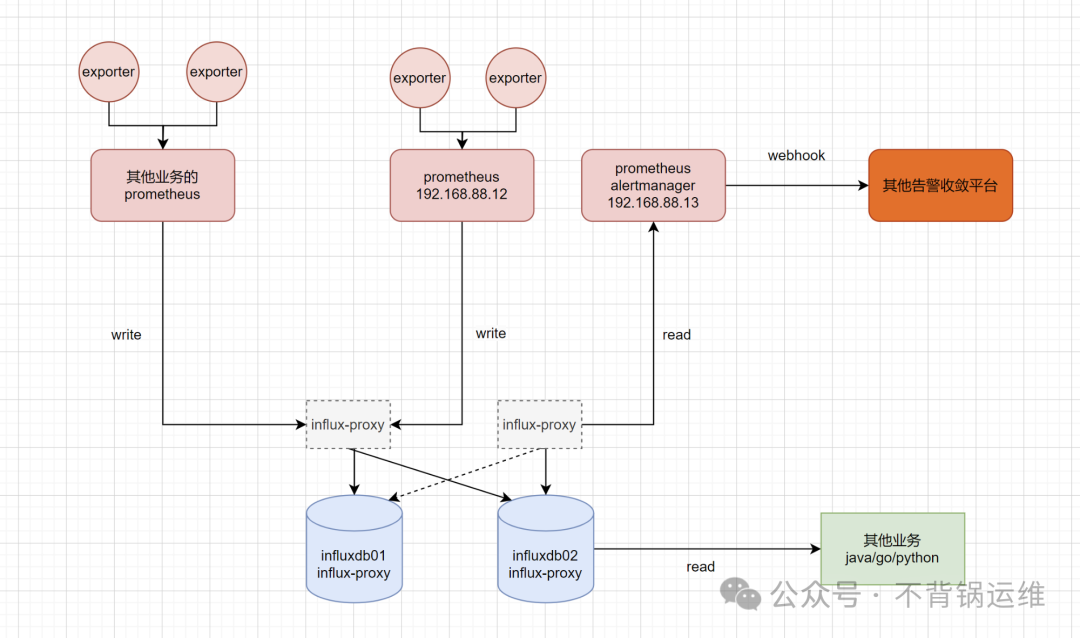
总体的方案很简单,所有配置远程写的prometheus都往同一套InfluxDB的同一个库写监控数据,各个prometheus配置全局的external_labels以区分来源。现方案规划2台InfluxDB节点,后续可横向扩容即可,监控架构如下图:
机器规划
prometheus规划
prometheus或alertmanager的基本HA,如有必要请自行配置,本方案不做阐述。
| 用途 | ip | 组件 | 系统 | 说明 |
|---|---|---|---|---|
| 做常规的监控,接exporter | 192.168.88.12 | prometheus2.49.1 | centos7.9 | 监控用途,也要配置全局的external_labels以区分来源,配置远程写 |
| 远程读监控数据及负责警报发送 | 192.168.88.13 | prometheus2.49.1、Alertmanager | centos7.9 | 配置远程读,配置警报规则、由webhook方式将告警发送到其它地方 |
| 这台此处模拟其它业务的prometheus | 192.168.88.14 | prometheus2.49.1 | centos7.9 | 模拟接入其它业务的prometheus监控数据,对方配置远程写,配置全局的external_labels区分来源,这样的方式更高效,之前采用联邦的方式对性能影响很大。 |
InfluxDB+influx-proxy高可用规划:
根据规划,将写和读分开,分摊压力。因机器数量有限,本方案将influx-proxy和InfluxDB部署在同一台(最好是独立的2台来做HA,如有必要请自行改造)。
| 同步情况 | ip | 安装组件 | 主机名 | InfluxDB端口 | influx-proxy端口 | 系统 | 角色 |
|---|---|---|---|---|---|---|---|
| 自动双向 | 192.168.88.30 | InfluxDB v1.8.10、influx-proxy-2.5.10 | influxdb01 | 8086 | 7076 | centos7.9 | 负责写 |
| 自动双向 | 192.168.88.31 | InfluxDB v1.8.10、influx-proxy-2.5.10 | influxdb02 | 8086 | 7076 | centos7.9 | 负责读 |
InfluxDB+influx-proxy配置
说明:influxdb01和influxdb02的配置是一样的。
InfluxDB组件:
/data/influxdb-1.8.10-1/etc/influxdb/influxdb.conf
 bind-address = "0.0.0.0:8088"
[meta]
  dir = "/var/lib/influxdb/meta"
[data]
  dir = "/var/lib/influxdb/data"
  wal-dir = "/var/lib/influxdb/wal"
  series-id-set-cache-size = 100
[coordinator]
[retention]
[shard-precreation]
[monitor]
[http]
   bind-address = ":8086"
[logging]
[subscriber]
[[graphite]]
[[collectd]]
[[opentsdb]]
[[udp]]
[continuous_queries]
[tls]
/etc/systemd/system/influxdb.service
[Unit]
Description="influxdb"
After=network.target

[Service]
Type=simple
ExecStart=/data/influxdb-1.8.10-1/usr/bin/influxd -config /data/influxdb-1.8.10-1/etc/influxdb/influxdb.conf

Restart=on-failure
RestartSecs=5s
SuccessExitStatus=0
LimitNOFILE=655360
StandardOutput=syslog
StandardError=syslog
SyslogIdentifier=influxdb

[Install]
WantedBy=multi-user.target
influx-proxy组件:
/data/influx-proxy-2.5.10-linux-amd64/proxy.json
{
    "circles": [
        {
            "name": "circle-1",
            "backends": [
                {
                    "name": "influxdb-1",
                    "url": "http://192.168.88.30:8086",
                    "username": "",
                    "password": ""
                }
            ]
        },
        {
            "name": "circle-2",
            "backends": [
                {
                    "name": "influxdb-2",
                    "url": "http://192.168.88.31:8086",
                    "username": "",
                    "password": ""
                }
            ]
        }
    ],
    "listen_addr": ":7076",
    "db_list": [],
    "data_dir": "data",
    "tlog_dir": "log",
    "hash_key": "idx",
    "flush_size": 10000,
    "flush_time": 1,
    "check_interval": 1,
    "rewrite_interval": 10,
    "conn_pool_size": 20,
    "write_timeout": 10,
    "idle_timeout": 10,
    "username": "",
    "password": "",
    "write_tracing": false,
    "query_tracing": false,
    "pprof_enabled": false,
    "https_enabled": false,
    "https_cert": "",
    "https_key": "",
    "data_dir": "/data/influx-proxy-2.5.10-linux-amd64/data"
}
/etc/systemd/system/influx-proxy.service
[Unit]
Description="influx-proxy"
After=network.target

[Service]
Type=simple
ExecStart=/data/influx-proxy-2.5.10-linux-amd64/influx-proxy -config /data/influx-proxy-2.5.10-linux-amd64/proxy.json

Restart=on-failure
RestartSecs=5s
SuccessExitStatus=0
LimitNOFILE=655360
StandardOutput=syslog
StandardError=syslog
SyslogIdentifier=influx-proxy

[Install]
WantedBy=multi-user.target
测试和验证
分别通过influx-proxy进行登录
[root@influxdb01 ~]# influx -host 192.168.88.30 -port 7076
Connected to http://192.168.88.30:7076 version 2.5.10
InfluxDB shell version: 1.8.10
>
[root@influxdb02 ~]# influx -host 192.168.88.31 -port 7076
Connected to http://192.168.88.31:7076 version 2.5.10
InfluxDB shell version: 1.8.10
>
创建一个数据库,看看同步情况
在88.30创建数据库
[root@influxdb01 ~]# influx -host 192.168.88.30 -port 7076
Connected to http://192.168.88.30:7076 version 2.5.10
InfluxDB shell version: 1.8.10
> create database prometheus
> show databases
name: databases
name
----
_internal
prometheus
>
在88.31上查看是否也有
[root@influxdb02 ~]# influx -host 192.168.88.31 -port 7076
Connected to http://192.168.88.31:7076 version 2.5.10
InfluxDB shell version: 1.8.10
> show databases
name: databases
name
----
_internal
prometheus
>
如果存在,说明同步成功。也可以在88.31删除,然后去88.30看看是否也已经删除。
prometheus配置
配置192.168.88.12上的prometheus:
global:
  scrape_interval: 15s
  evaluation_interval: 15s
  external_labels:
    position: "wgprometheus"

scrape_configs:
  - job_name: "prometheus"
    static_configs:
      - targets: ["192.168.88.12:9090"]

  - job_name: "host-mon"
    static_configs:
      - targets: ["192.168.88.12:9100"]

remote_write:
  - url: "http://192.168.88.30:7076/api/v1/prom/write?db=prometheus"
配置192.168.88.13上prometheus:
global:
  scrape_interval: 15s
  evaluation_interval: 15s

alerting:
  alertmanagers:
    - static_configs:
        - targets:
          # - alertmanager:9093

rule_files:
  # - "first_rules.yml"
  # - "second_rules.yml"

remote_read:
  - url: "http://192.168.88.31:7076/api/v1/prom/read?db=prometheus"
配置192.168.88.14上的prometheus:
global:
  scrape_interval: 15s
  evaluation_interval: 15s
  external_labels:
    position: "other-bus-prometheus"

scrape_configs:
  - job_name: "prometheus"
    static_configs:
      - targets: ["192.168.88.14:9090"]

  - job_name: "exporter_host"
    static_configs:
      - targets: ["192.168.88.14:9100"]

remote_write:
  - url: "http://192.168.88.30:7076/api/v1/prom/write?db=prometheus"
验证监控数据是否写入到influxdb
[root@influxdb01 ~]# influx -host '192.168.88.31' -port 7076
Connected to http://192.168.88.31:7076 version 2.5.10
InfluxDB shell version: 1.8.10
>
> show databases;
name: databases
name
----
_internal
prometheus
> use prometheus
Using database prometheus
> SELECT * FROM node_load15 WHERE position = 'other-bus-prometheus' limit 1
name: node_load15
time                __name__    instance           job           position             value
----                --------    --------           ---           --------             -----
1706775423319000000 node_load15 192.168.88.14:9100 exporter_host other-bus-prometheus 0.04
>
>
> SELECT * FROM node_load15 WHERE position = 'wgprometheus' limit 1
name: node_load15
time                __name__    instance           job      position     value
----                --------    --------           ---      --------     -----
1706774096565000000 node_load15 192.168.88.12:9100 host-mon wgprometheus 0.05
配置警报组件
根据规划,在192.168.88.13上配置警报组件。
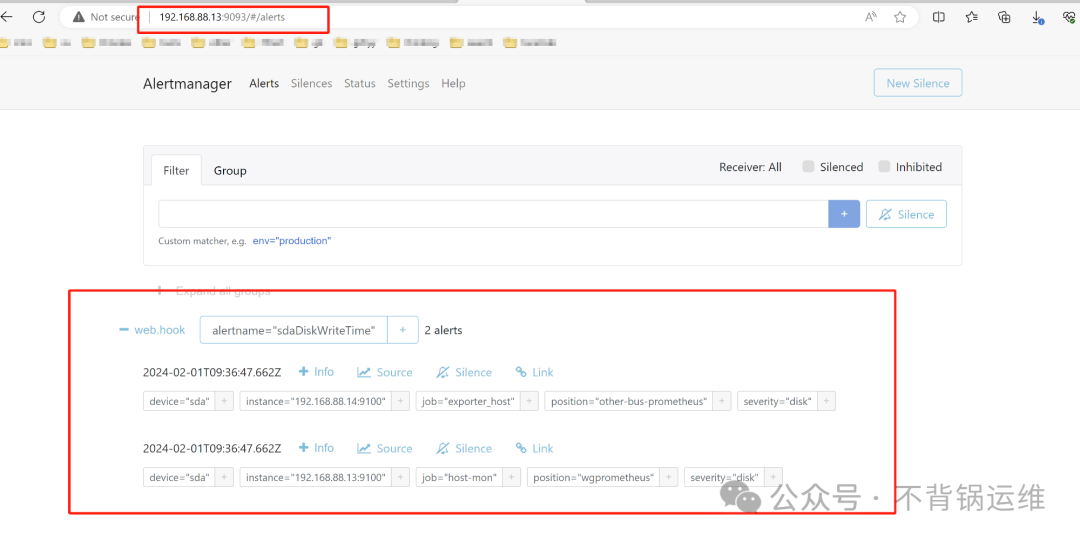
alertmanager.yml:
route:
  group_by: ['alertname']
  group_wait: 30s
  group_interval: 5m
  repeat_interval: 5s
  receiver: 'web.hook'

receivers:
  - name: 'web.hook'
    webhook_configs:
      - url: 'http://127.0.0.1:5001/'
警报规则配置
根据规划,192.168.88.13上prometheus作为监控数据读取和警报器的用途,因此,在这里配置警报规则。
prometheus.yml:
global:
  scrape_interval: 15s
  evaluation_interval: 15s

alerting:
  alertmanagers:
    - static_configs:
        - targets:
          - localhost:9093

rule_files:
  - "/data/app/prometheus/alert.yml"

remote_read:
  - url: "http://192.168.88.31:7076/api/v1/prom/read?db=prometheus"
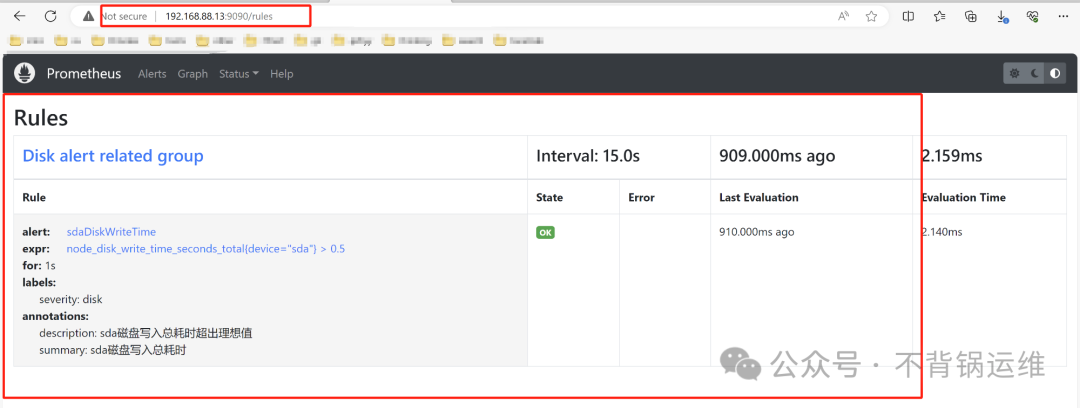
alert.yml:
groups:
- name: Disk alert related group
  rules:
  - alert: sdaDiskWriteTime
    expr: node_disk_write_time_seconds_total{device="sda"} > 1
    for: 1s
    labels:
      severity: disk
    annotations:
      summary: "sda磁盘写入总耗时"
      description: "sda磁盘写入总耗时超出理想值"
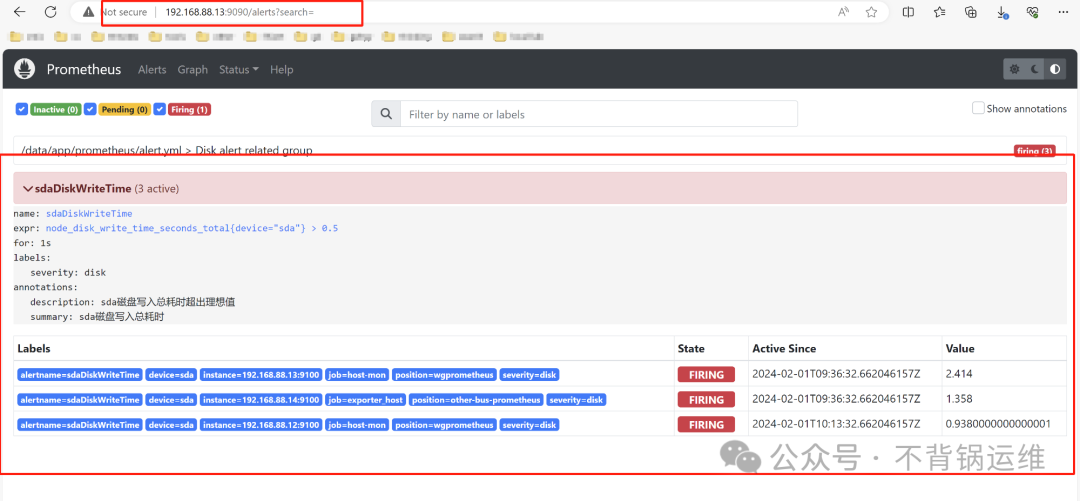
验证警报是否发出
文章转载自不背锅运维,如果涉嫌侵权,请发送邮件至:contact@modb.pro进行举报,并提供相关证据,一经查实,墨天轮将立刻删除相关内容。
