


前言
监控系统除了监控os和数据库性能相关的指标外,业务数据也是重点监控的对象。
一线驻场的运维同学应该深有体会,每天需要向甲方或者公司反馈现场的数据情况,正常情况下一天巡检两次,早上上班后和下午下班前各一次。监控项目多而杂,如果每次都手动拷贝脚本到数据库中查询,不仅麻烦,而且效率极低,因此有必要配置一个监控系统辅助业务数据的巡检工作。
监控基本方式是通过sql查询数据库相关内容状态和信息来实现,这里以监控示例业务表为例,讲解此监控项建立的过程,希望能有一定的指导作用,方便各位根据自己的实际情况,建立监控内容。
1 业务场景模拟
示例数据:
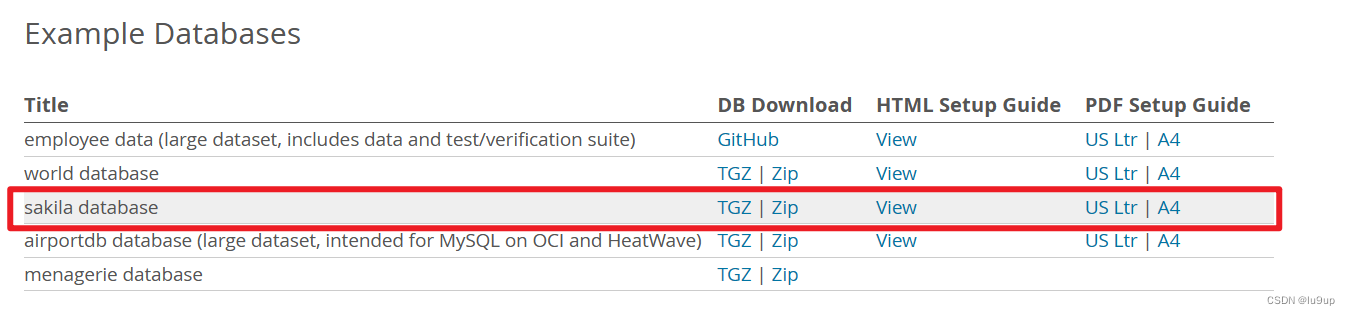
- 数据库:sakila
- 下载地址:https://dev.mysql.com/doc/index-other.html,下载后导入数据库即可完成创建。
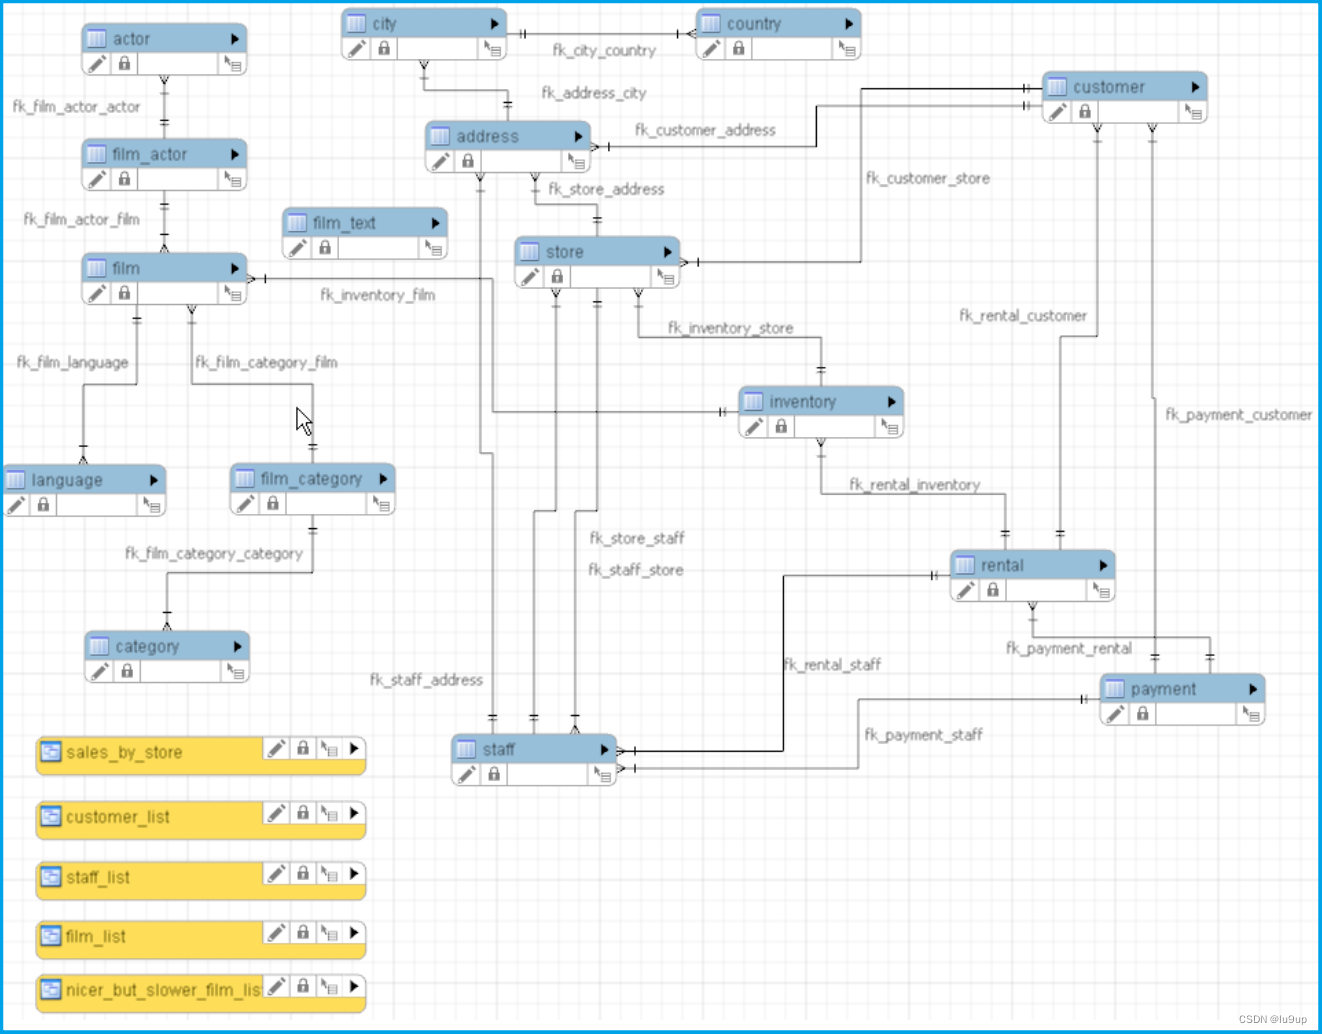
- EER图:
- 假设业务监控指标的需求为:获取Lethbridge城市当前的累计营业额。
sql如下:
mysql>
select sum(p.amount) amount
  from sakila.customer c,
	   sakila.payment p,
       sakila.store s,
	   sakila.address a,
	   sakila.city ct
 where c.customer_id = p.customer_id
   and c.store_id = s.store_id
   and s.address_id = a.address_id
   and a.city_id = ct.city_id
   and ct.city = 'Lethbridge';

+----------+
| amount   |
+----------+
| 36997.53 |
+----------+
1 row in set (0.02 sec)
2 创建监控项脚本文件
此文件用于添加监控脚本。
[root@mysql001 scripts]# touch /var/lib/zabbix/percona/scripts/business_data.sh
[root@mysql001 scripts]# chmod +x /var/lib/zabbix/percona/scripts/business_data.sh
[root@mysql001 scripts]# ll /var/lib/zabbix/percona/scripts/business_data.sh
-rwxr-xr-x 1 root root 587 Feb 25 18:15 /var/lib/zabbix/percona/scripts/business_data.sh
3 修改zabbix agent配置文件
将监控项脚本文件添加到配置文件中。
[root@mysql001 scripts]# vim /usr/local/zabbix/etc/zabbix_agentd.conf.d/userparameter_percona_mysql.conf
#添加
UserParameter=business_data[*],/var/lib/zabbix/percona/scripts/business_data.sh $1
4 监控用户赋权
给监控用户赋予sakila数据库的查询权限。
mysql> grant select on sakila.* to pmp@localhost;
Query OK, 0 rows affected (0.01 sec)

mysql> show grants for pmp@localhost;
+---------------------------------------------------------------+
| Grants for pmp@localhost                                      |
+---------------------------------------------------------------+
| GRANT PROCESS, REPLICATION CLIENT ON *.* TO `pmp`@`localhost` |
| GRANT SELECT ON `sakila`.* TO `pmp`@`localhost`               |
+---------------------------------------------------------------+
2 rows in set (0.00 sec)
5 测试监控脚本
过滤前:
[mysql@mysql001 ~]$ mysql -upmp -pPmp123456. -e "select sum(p.amount) amount from sakila.customer c, sakila.payment p, sakila.store s, sakila.address a, sakila.city ct where c.customer_id = p.customer_id and c.store_id = s.store_id and s.address_id = a.address_id and a.city_id = ct.city_id and ct.city = 'Lethbridge'\G"
mysql: [Warning] Using a password on the command line interface can be insecure.
*************************** 1. row ***************************
amount: 36997.53
过滤后:
[mysql@mysql001 ~]$ mysql -upmp -pPmp123456. -e "select sum(p.amount) amount from sakila.customer c, sakila.payment p, sakila.store s, sakila.address a, sakila.city ct where c.customer_id = p.customer_id and c.store_id = s.store_id and s.address_id = a.address_id and a.city_id = ct.city_id and ct.city = 'Lethbridge'\G" 2>/dev/null | awk 'NR==2 {print $2}'
36997.53
过滤后的结果一定要为一个数值或字符串,不能包含间隔或多列,要不然监控项不好配置。
count()等这种聚合函数无脑在脚本后加 2>/dev/null | awk ‘NR==2 {print $2}’ 就行。
命令解析:
- 2>/dev/null:去除MySQL命令行直接输入密码警告;
- awk ‘NR==2’:取第二行数据;
- awk ‘{print $2}’:取第二列数值。
6 配置监控项脚本
[root@mysql001 scripts]# vim /var/lib/zabbix/percona/scripts/business_data.sh
#添加:

#!/bin/bash
#定义一个本地用户登录mysql数据库的变量
case $1 in
        #case1: Lethbridge_Amount
        Lethbridge_Amount)
        mysql -upmp -pPmp123456. -e "select sum(p.amount) amount from sakila.customer c, sakila.payment p, sakila.store s, sakila.address a, sakila.city ct where c.customer_id = p.customer_id and c.store_id = s.store_id and s.address_id = a.address_id and a.city_id = ct.city_id and ct.city = 'Lethbridge'\G" 2>/dev/null | awk 'NR==2 {print $2}'
        ;;
        #case2: number of actors
        Number_of_Actors)
        mysql -upmp -pPmp123456. -e "select count(*) from sakila.actor\G" 2>/dev/null | awk 'NR==2 {print $2}'
        ;;
esac
此脚本不仅可以添加mysql数据库的监控,os和oracle等其他服务的监控都是可以添加的,只需要往下添加case选项就可以。
7 重启zabbix代理
[root@mysql001 scripts]# systemctl restart zabbix_agentd
[root@mysql001 scripts]# systemctl status zabbix_agentd
● zabbix_agentd.service - SYSV: Zabbix Monitoring Agent
   Loaded: loaded (/etc/rc.d/init.d/zabbix_agentd; bad; vendor preset: disabled)
   Active: active (running) since Sun 2024-02-25 21:04:38 CST; 9s ago
     Docs: man:systemd-sysv-generator(8)
  Process: 12525 ExecStop=/etc/rc.d/init.d/zabbix_agentd stop (code=exited, status=0/SUCCESS)
  Process: 12539 ExecStart=/etc/rc.d/init.d/zabbix_agentd start (code=exited, status=0/SUCCESS)
 Main PID: 12548 (zabbix_agentd)
   CGroup: /system.slice/zabbix_agentd.service
           ├─12548 /usr/local/zabbix/sbin/zabbix_agentd -c /usr/local/zabbix/etc/zabbix_agentd.conf
           ├─12549 /usr/local/zabbix/sbin/zabbix_agentd: collector [idle 1 sec]
           ├─12550 /usr/local/zabbix/sbin/zabbix_agentd: listener #1 [waiting for connection]
           ├─12551 /usr/local/zabbix/sbin/zabbix_agentd: listener #2 [waiting for connection]
           ├─12552 /usr/local/zabbix/sbin/zabbix_agentd: listener #3 [waiting for connection]
           └─12553 /usr/local/zabbix/sbin/zabbix_agentd: active checks #1 [idle 1 sec]

Feb 25 21:04:38 mysql001 systemd[1]: Starting SYSV: Zabbix Monitoring Agent...
Feb 25 21:04:38 mysql001 zabbix_agentd[12539]: Starting Zabbix Agent: [  OK  ]
Feb 25 21:04:38 mysql001 systemd[1]: Started SYSV: Zabbix Monitoring Agent.
只需要重启一次即可,以后脚本文件business_data.sh添加监控项不需要再重启zabbix代理。
8 测试
到zabbix server的bin目录下执行zabbix_get测试:
[root@zabbix6 bin]# ./zabbix_get -s 192.168.131.99 -k business_data[Lethbridge_Amount]
36997.53
测试成功!!
9 创建主机
登录zabbix server Web页面,在配置->主机->创建主机下添加主机:
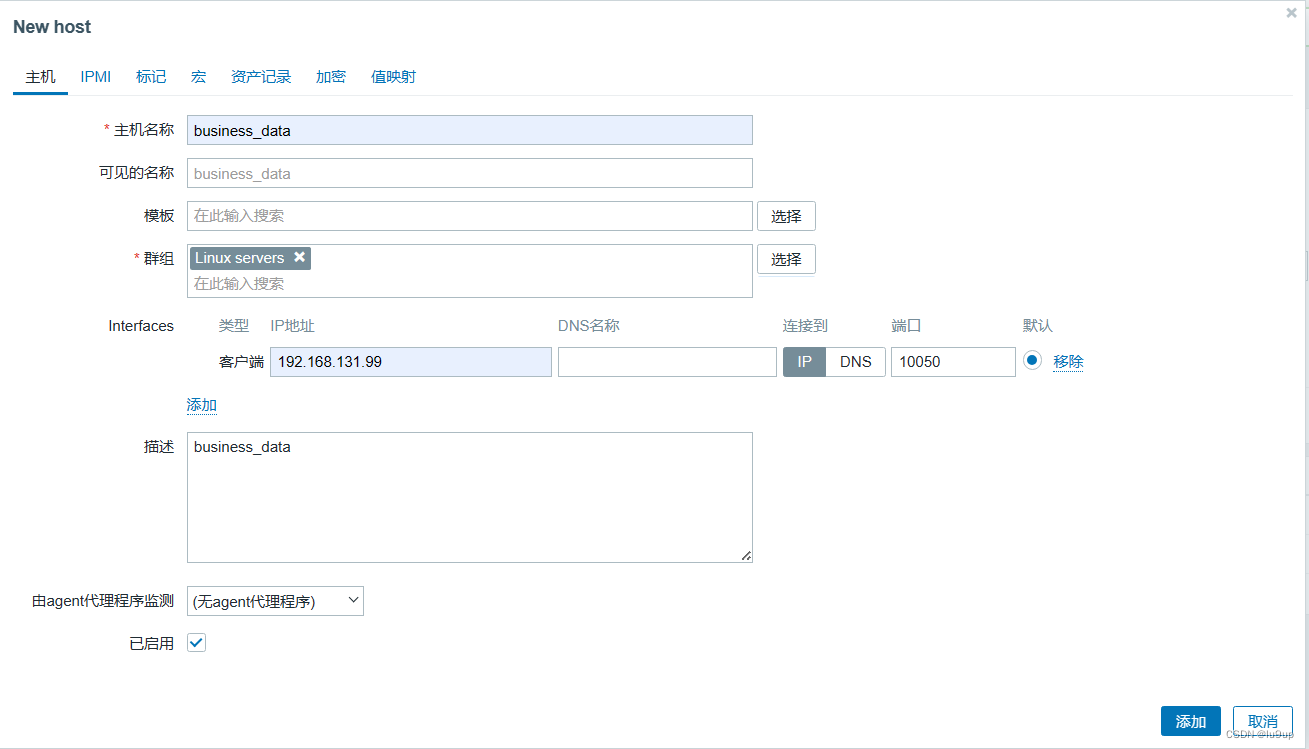
配置主机名、群组和zabbix代理端ip。
10 添加监控项
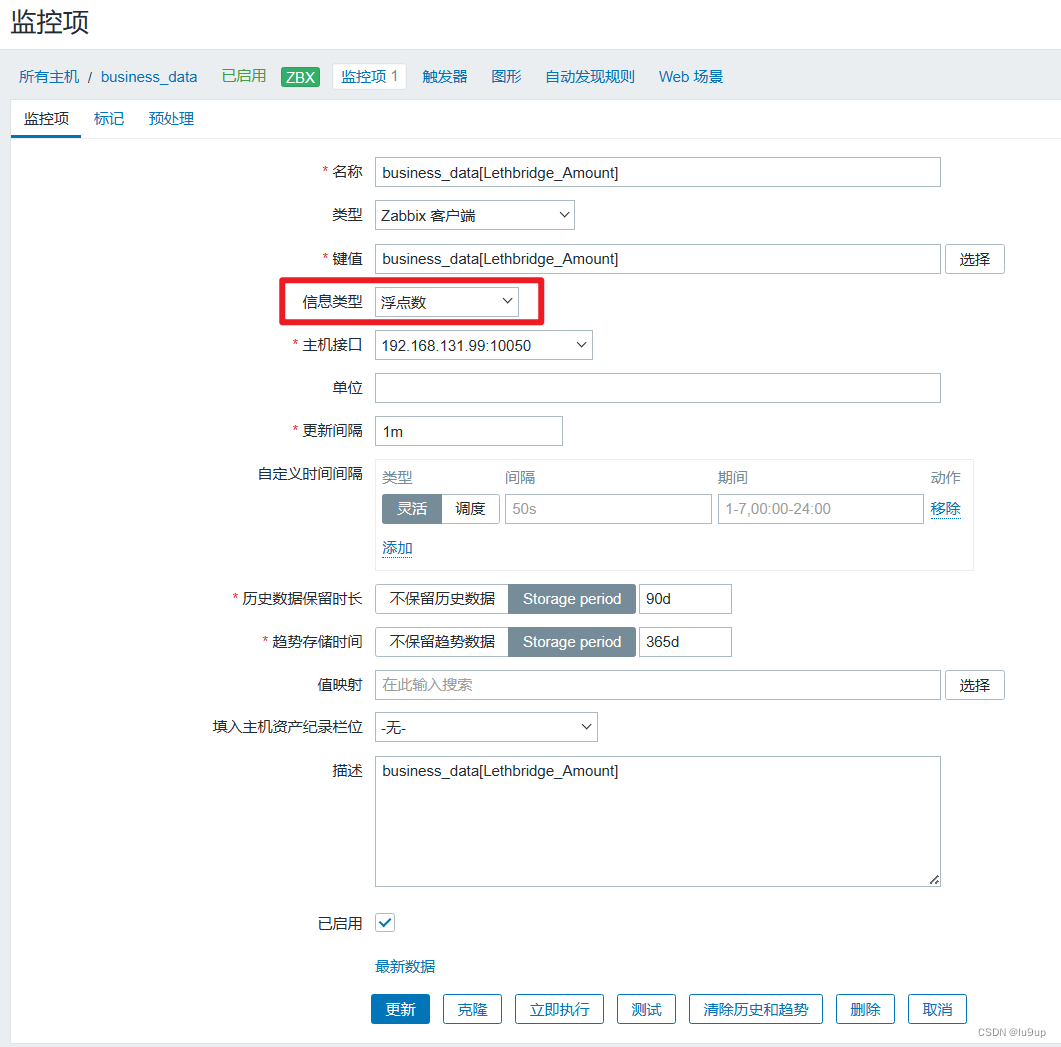
配置监控项名称、键值、数据类型和更新间隔。
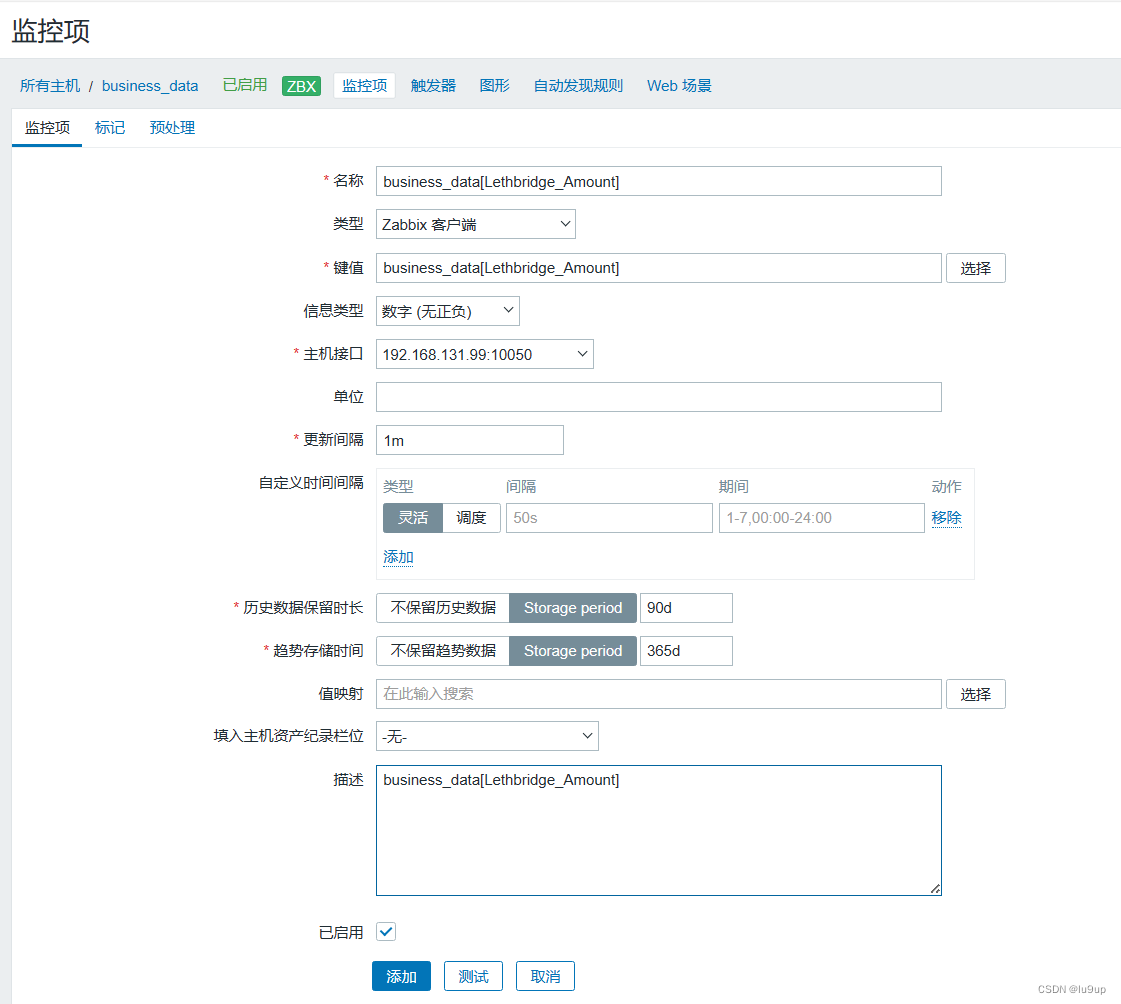
注意:此处设置更新间隔为1s,如果配置的监控项目比较多,且数据库的压力比较大,可以根据实际环境适当调大更新间隔。
监控项报错,错误信息:
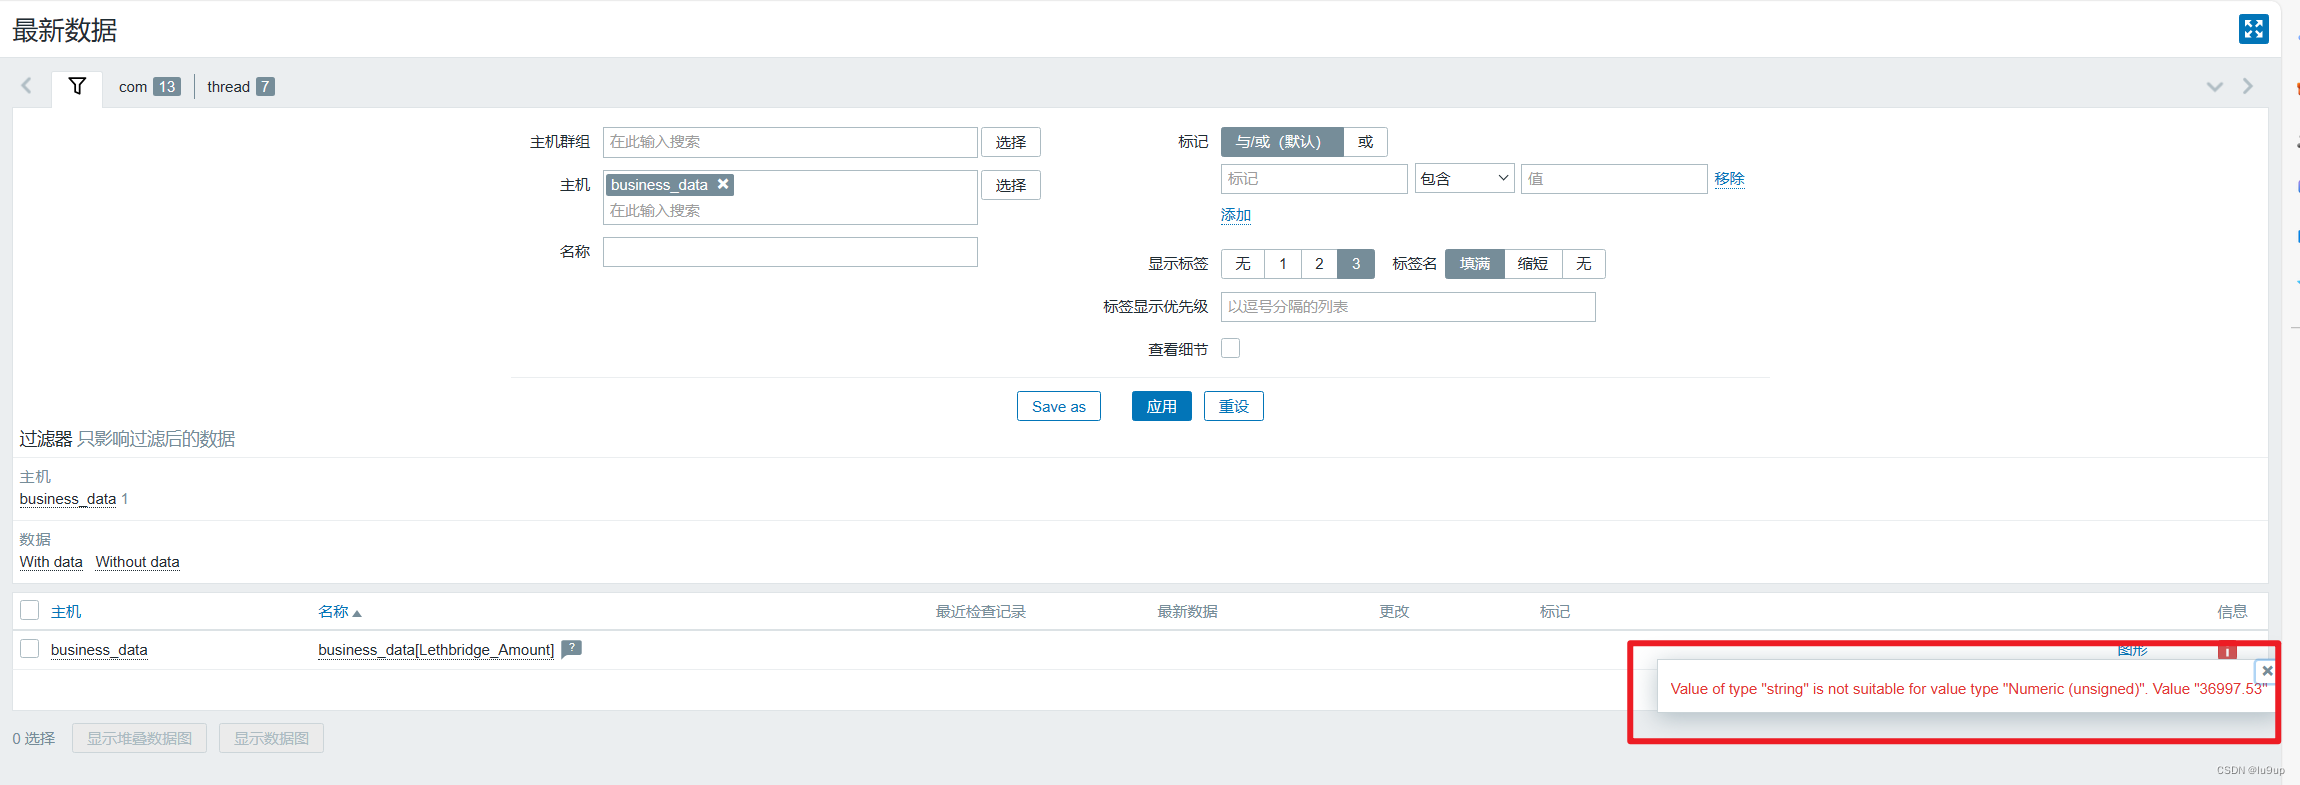
数据为浮点型,监控项配置了数值型。
修改监控项配置:
10 结果呈现
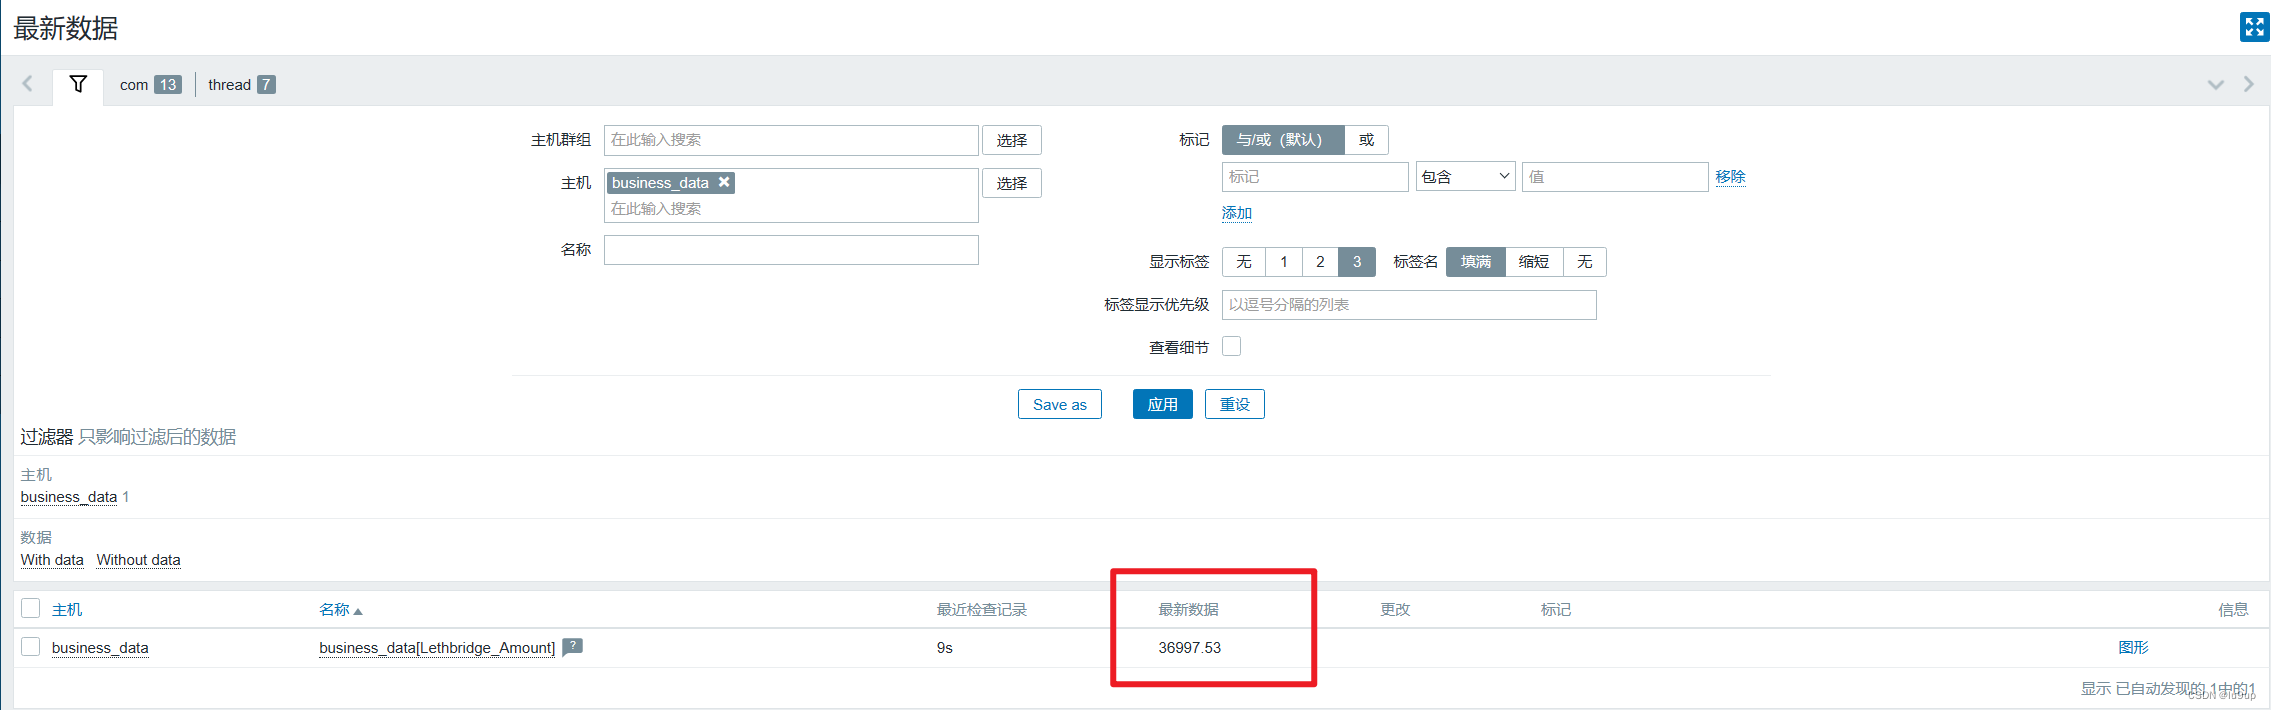
至此,完成此监控项添加。
