


前言
上周③群有位筒子问了这样一个问题:
应用连接数据库偶尔有报错:The database system is in recovery mode,好像是OOM了,暂时停不了机,是不是可以将work_mem调小点?这样能不能解决问题?
首先这个问题回答正确了一半,OOM会导致数据库崩溃当然no problem,但是不能一概而论,想当然认为数据库崩溃的原因就是OOM,曾经我还遇到过逻辑复制解析到复制槽一个位点反复崩溃的怪异场景。
所以导致数据库崩的原因千奇百怪,比如:
Bad Hardware:bad disk, bad controller,Garbage writes during power loss, Soft-RAID edge conditions Bad Software:bugs in PostgreSQL, kernel, filesystem; bugs in database systems / applications User Error:kill -9, pg_stop -mi 等等
因此还需要进一步根据数据库日志,操作系统日志和数据库 "AWR" 等进行综合分析。但是尴尬的是,这位同学并没有打开日志,失去了重要的溯源手段,全靠猜,并不能从根上解决。
今天,就让我们聊一聊PostgreSQL的日志与最佳实践,拿捏!
相关参数
将logging_collector参数打开之后,便会有一个额外的logger进程专门用于收集运行时日志。此外还有许多参数,用于控制不同的行为,简单介绍几个:
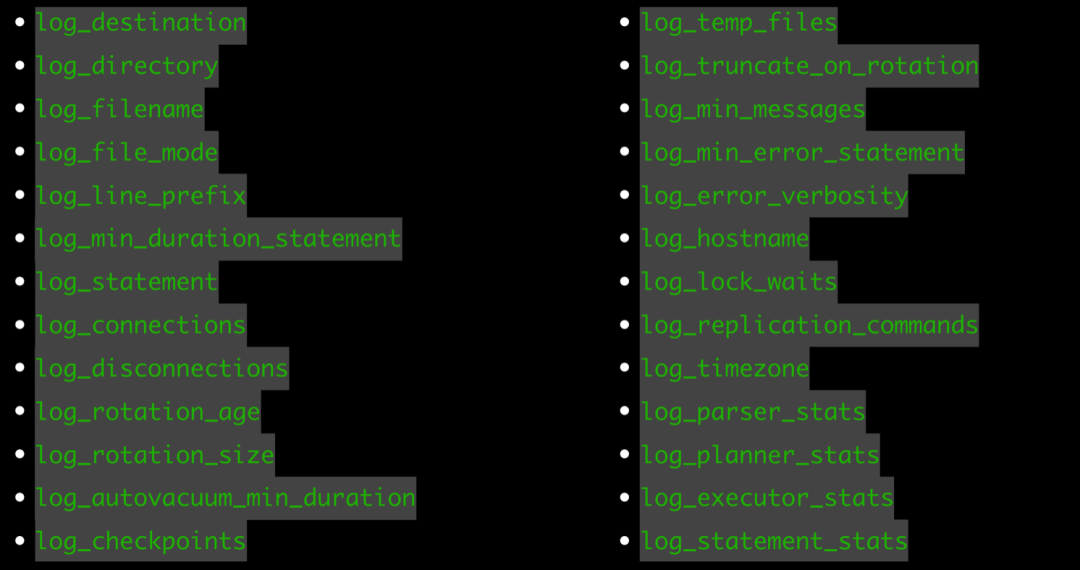
log_connections、log_disconnections:track down the origin of your queries,查找慢查询源头
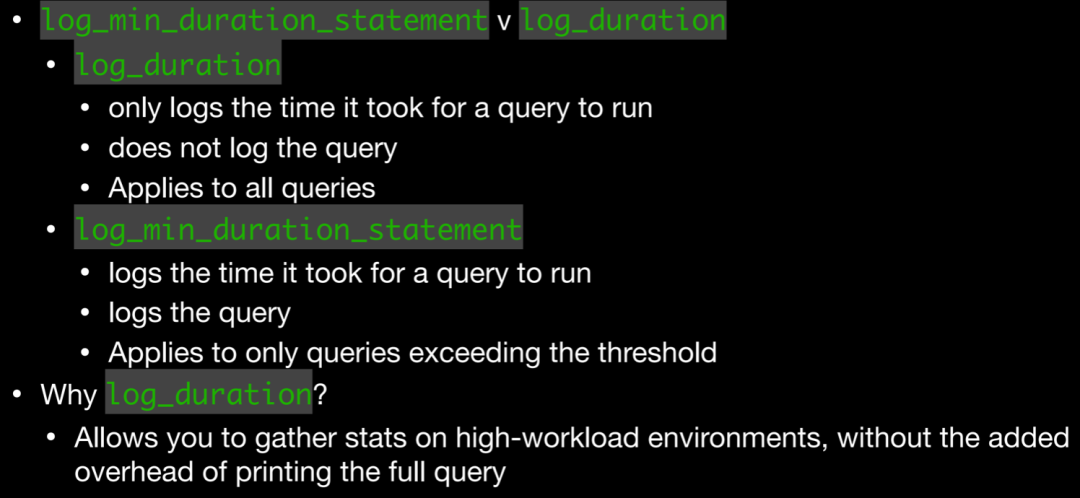
log_min_duration_statement、log_duration:用于记录SQL执行时长,log_min_duration_statement使用较多,此参数会将SQL与对应执行时长记录在一起,方便查找,对于使用extend protocal的客户端,解析、绑定和执行的时间会被分开记录。其次,当与log_statement一起使用时,已经被log_statement记录的查询不会被再次记录,这在官网上也有说明。
当然log_duration并非一无是处
Allows you to gather stats on high-workload environments, without the added overhead of printing the full query
log_checkpoints:记录检查点状态,比如写了多少BUFFER,移除了多少WAL,回收了多少WAL等等
log_lock_waits:将超过deadlock_timeout相关锁行为记录在日志中
log_autovacuum_min_duration:记录autovacuum相关信息,比如移除了多少死元组,移除了多少索引元组,平均扫描速度等
log_min_error_statement:控制记录哪些引发错误的 SQL 语句
log_recovery_conflict_waits:14版本引入,可以记录流复制冲突相关行为,在流复制场景下推荐打开
LOG:  recovery still waiting after 1024.777 ms: recovery conflict on snapshot
DETAIL:  Conflicting process: 10156.
CONTEXT:  WAL redo at 0/3044D08 for Heap2/PRUNE: latestRemovedXid 744 nredirected 0 ndead 1; blkref #0: rel 1663/13842/16385, blk 0
LOG:  recovery finished waiting after 18042.573 ms: recovery conflict on snapshot
CONTEXT:  WAL redo at 0/3044D08 for Heap2/PRUNE: latestRemovedXid 744 nredirected 0 ndead 1; blkref #0: rel 1663/13842/16385, blk 0
log_temp_files:追踪临时文件的使用情况,比如排序,HASH JOIN,中间结果存储,聚合等等,可以帮助我们分析work_mem设置是否合理、I/O spikes。搭配如下SQL更为方便:
SELECT
    filename,
    pid,
    (pg_stat_file(dir || '/' || filename)).modification AS modified_at
FROM (
    SELECT
        CAST('pg_tblspc/16384/pgsql_tmp' AS text) AS dir,
        filename,
        CAST(regexp_replace(filename, $r$ ^ pgsql_tmp (d +)..* $$ r$, $rr$ 1$rr $, 'g') AS int) AS pid
    FROM
        pg_ls_dir('pg_tblspc/16384/pgsql_tmp') AS the (filename)) AS temp_files (dir,
        filename,
        pid)
    LEFT JOIN pg_stat_activity ON procpid = pid
WHERE
    procpid IS NULL
ORDER BY
    modified_at;
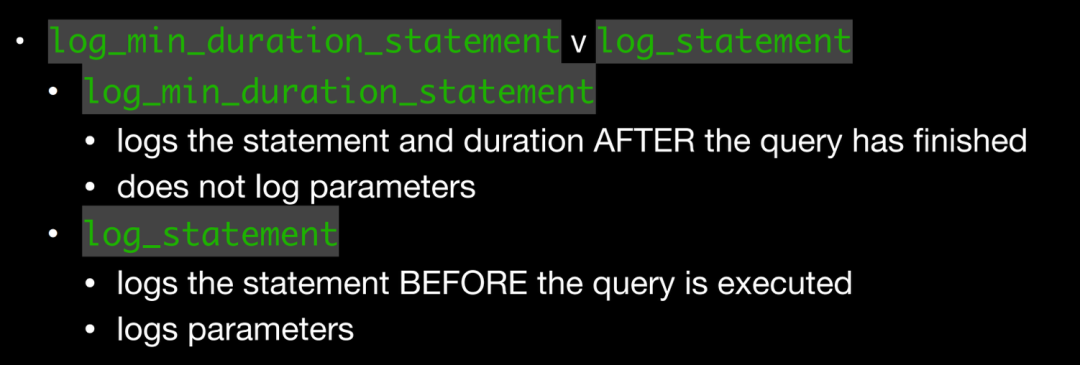
还有一个细节是关于记录日志的时机:
log_min_duration_statement在语句执行完之后才会记录(毕竟需要记录执行时长),但是其并不会记录绑定变量; log_statement在语句解析完毕,exector阶段之前记录,并且会记录相关绑定变量。
log_line_prefix
还有一个至关重要的参数是log_line_prefix,此参数是一个printf风格的字符串,在每个日志行的开头输出,默认值是'%m [%p] ',意味着只记录时间戳和进程ID,它支持很多种参数
• %a - Application Name - Allows quick reference and filtering
• %u - User Name - Allows filter by user name
• %d - Database Name - Allows filter by database name
• %r - Remote Host IP/Name (w/ port) - Helps identify suspicious activity from a host
• %p - Process ID - Helps identify specific problematic sessions
• %l - Session/Process Log Line - Helps identify what a session has done
• %v/%x - Transaction IDs - Helps identify what queries a transaction ran
• %q - Terminating non-session process output: %q:Depending on where the event is coming from, the log line prefix will show different values. Both background processes and user processes will record their messages in the log file. For system processes, I have specified %q, which will suppress any text after the process ID (%p). Any other session will show the database name, user name, client address, application name, and a numbered line for each event.,主要用于屏蔽系统进程也输出一大堆信息
以如下例子为例,让我们看看此时日志的风格。
postgres=# show log_line_prefix ;
                    log_line_prefix
-------------------------------------------------------
 %m [%p]: [%l] [txid=%x] user=%u,db=%d,app%a,client=%r
(1 row)
2024-03-03 15:01:46.076 CST [19274]: [1] [txid=0] user=[unknown],db=[unknown],app[unknown],client=[local]LOG:  connection received: host=[local]
2024-03-03 15:01:46.077 CST [19274]: [2] [txid=0] user=postgres,db=postgres,app[unknown],client=[local]LOG:  connection authorized: user=postgres database=postgres application_name=psql
2024-03-03 15:03:36.360 CST [19274]: [3] [txid=0] user=postgres,db=postgres,apppsql,client=[local]LOG:  statement: create table tt1(id int);
可以看到,添加了时间戳、进程 PID,此进程执行的命令计数、对应的事务号等等,因此通过此参数我们可以自定义很多种风格,充分发挥强大的日志系统。
另外,有些人可能发现如果将log_destination设为了csvlog之后,log_line_prefix这个参数不管如何设置都不会生效,只有在设置为stderr,此参数才生效。
设置为csvlog之后,其格式就是固定的了,每一个字段在代码中有相关记录:
/*
 * write_csvlog -- Generate and write CSV log entry
 *
 * Constructs the error message, depending on the Errordata it gets, in a CSV
 * format which is described in doc/src/sgml/config.sgml.
 */
void
write_csvlog(ErrorData *edata)
{
 StringInfoData buf;
 bool  print_stmt = false;
  ...
  /* timestamp with milliseconds */
 appendStringInfoString(&buf, get_formatted_log_time());
 appendStringInfoChar(&buf, ',');

 /* username */
 if (MyProcPort)
  appendCSVLiteral(&buf, MyProcPort->user_name);
 appendStringInfoChar(&buf, ',');

 /* database name */
 if (MyProcPort)
  appendCSVLiteral(&buf, MyProcPort->database_name);
 appendStringInfoChar(&buf, ',');

 /* Process id  */
 if (MyProcPid != 0)
  appendStringInfo(&buf, "%d", MyProcPid);
 appendStringInfoChar(&buf, ',');
  ...
以这样一段日志为例,与代码一一对应即可
postgres=# create table test1(id int);
CREATE TABLE
postgres=# insert into test1 values(1);
INSERT 0 1
postgres=# insert into test1 values(2);
INSERT 0 1
postgres=# begin;
BEGIN
postgres=*# insert into test1 values(3);
INSERT 0 1
postgres=*# commit;
COMMIT
postgres=# select txid_current();
 txid_current
--------------
         2196
(1 row)

2024-03-03 15:19:48.465 CST,"postgres","postgres",19371,"[local]",65e42489.4bab,5,"idle",2024-03-03 15:19:37 CST,3/4,0,LOG,00000,"statement: create table test1(id int);",,,,,,,,,"psql","client backend",,0
2024-03-03 15:19:52.866 CST,"postgres","postgres",19371,"[local]",65e42489.4bab,6,"idle",2024-03-03 15:19:37 CST,3/5,0,LOG,00000,"statement: insert into test1 values(1);",,,,,,,,,"psql","client backend",,0
2024-03-03 15:20:01.591 CST,"postgres","postgres",19371,"[local]",65e42489.4bab,7,"idle",2024-03-03 15:19:37 CST,3/6,0,LOG,00000,"statement: insert into test1 values(2);",,,,,,,,,"psql","client backend",,0
2024-03-03 15:20:04.635 CST,"postgres","postgres",19371,"[local]",65e42489.4bab,8,"idle",2024-03-03 15:19:37 CST,3/7,0,LOG,00000,"statement: begin;",,,,,,,,,"psql","client backend",,0
2024-03-03 15:20:06.427 CST,"postgres","postgres",19371,"[local]",65e42489.4bab,9,"idle in transaction",2024-03-03 15:19:37 CST,3/7,0,LOG,00000,"statement: insert into test1 values(3);",,,,,,,,,"psql","client backend",,0
2024-03-03 15:20:10.121 CST,"postgres","postgres",19371,"[local]",65e42489.4bab,10,"idle in transaction",2024-03-03 15:19:37 CST,3/7,2195,LOG,00000,"statement: commit;",,,,,,,,,"psql","client backend",,0
时间戳:2024-03-03 15:19:48.465 CST 用户名:postgres 数据库名:postgres 进程ID:19371 远端IP和HOST:[local] 会话ID:65e42489.4bab,可以通过SELECT to_hex(trunc(EXTRACT(EPOCH FROM backend_start))::integer) || '.' || to_hex(pid) FROM pg_stat_activity 进行查询 Line number:也就是说在这个会话中执行的第几个命令 数据库状态 会话启动时间 虚拟事务ID 事务ID:可以看到commit的事务ID是2195 日志级别:LOG 状态码:00000 对应的语句
当然csvlog的优势在于其可以很好与file_fdw进行搭配,导入到数据库中使用SQL进行分析,如果你更倾向于将CSV日志加载到数据库表中、清理和转换数据以及创建适合业务需求的自定义报告,那么就使用csvlog。
根据这个表定义也可以分析上面的日志每个字段是什么意思。
CREATE TABLE postgres_log
(
  log_time timestamp(3) with time zone,
  user_name text,
  database_name text,
  process_id integer,
  connection_from text,
  session_id text,
  session_line_num bigint,
  command_tag text,
  session_start_time timestamp with time zone,
  virtual_transaction_id text,
  transaction_id bigint,
  error_severity text,
  sql_state_code text,
  message text,
  detail text,
  hint text,
  internal_query text,
  internal_query_pos integer,
  context text,
  query text,
  query_pos integer,
  location text,
  application_name text,
  backend_type text,
  leader_pid integer,
  query_id bigint,
  PRIMARY KEY (session_id, session_line_num)
);
log_min_messages
log_min_messages参数也很重要,用于控制往日志中记录哪些内容,默认是WARNING
WARNING,我们比较熟悉的是年龄问题, WARNING: database "postgres" must be vacuumed within 9763669 transactions ERROR:更多的是SQL语法错误,表不存在等,ERROR 消息的激增通常与应用程序错误有关,当然也有可能和流复制有关,比如WAL has been removed FATAL:一般对应于密码错了,没有HBA文件或者在进行恢复:the database system is starting up,FATAL 消息的激增通常与应用程序配置错误有关 PANIC:到数据损坏,SEGMENT FAULT等
Greenplum的行为如何
聊完PostgreSQL,我们再看看远方老表——Greenplum,由于Greenplum是大号形态的PostgreSQL,出问题的时候我们要看的日志就多了,不仅要看Master,还要去看对应的Segment日志
Greenplum的日志又有所不同,在PostgreSQL基础上又增加了许多分布式相关的形态:
/*
 * syslogger_write_errordata
 *   Write the GpErrorData to the log.
 */
static void
syslogger_write_errordata(PipeProtoHeader *chunkHeader, GpErrorData *errorData, bool csv)
{
 syslogger_append_current_timestamp(true);

 /* username */
 syslogger_write_str_with_comma(errorData->username, true, csv, true);

 /* databasename */
 syslogger_write_str_with_comma(errorData->databasename, true, csv, true);

 /* Process id, thread id */
 syslogger_write_int32(false, "p", chunkHeader->pid, true, true);
 syslogger_write_int32(false, "th", chunkHeader->thid, true, true);

  ...
  /* GPDB specific options. */
 syslogger_write_int32(true, "con", errorData->fix_fields.gp_session_id, true, true);
 syslogger_write_int32(true, "cmd", errorData->fix_fields.gp_command_count, true, true);
 syslogger_write_int32(false, errorData->fix_fields.gp_is_primary == 't'? "seg" : "mir", errorData->fix_fields.gp_segment_id,
        true, true);
 syslogger_write_int32(true, "slice", errorData->fix_fields.slice_id, true, true);
 syslogger_write_int32(true, "dx", errorData->fix_fields.dist_trans_id, true, true);
 syslogger_write_int32(true, "x", errorData->fix_fields.local_trans_id, true, true);
 syslogger_write_int32(true, "sx", errorData->fix_fields.subtrans_id, true, true);
在Greenplum中,QD是负责分发SQL的进程,QE负责实际执行,那如何将QD和QE执行同一个SQL的相关日志联系起来呢?没错,就是这个con,表示gp_session_id,同一个gp_session_id表示同一个会话。
找到了session_id,我们就可以通过gpssh连接到所有机器上进行综合排查
gpssh -f <hostfile> 'ps -ef | grep con<sess_id> | grep -v idle'
排除Idle是因为idle进程是处理完自己Slice当时分配任务的进程,这样我们便可以对整体有个大致的了解。
小结
合理配置日志参数,利用好日志,可以让所有DB killer无所遁形。
参考
【Greenplum常见问题系列】 “我的SQL跑了很长时间没有结果怎么办?”
https://docs.aws.amazon.com/zh_cn/AmazonRDS/latest/AuroraUserGuide/USER_LogAccess.Concepts.PostgreSQL.html
https://www.postgresql.org/docs/current/runtime-config-logging.html
https://docs.aws.amazon.com/zh_cn/AmazonRDS/latest/AuroraUserGuide/USER_LogAccess.Concepts.PostgreSQL.html
https://techcommunity.microsoft.com/t5/azure-database-for-postgresql/how-to-configure-postgres-log-settings/ba-p/1214716
Best Practices for Logging in PostgreSQL
推荐阅读
Feel free to contact me
微信公众号:PostgreSQL学徒 Github:https://github.com/xiongcccc 微信:_xiongcc 知乎:xiongcc 墨天轮:https://www.modb.pro/u/3958
