前言
四月 6 号,由 Palak Chaturvedi 创作,Thomas Munro 提交了一个功能——驱逐缓冲,https://git.postgresql.org/gitweb/?p=postgresql.git;a=commitdiff;h=13453eedd3f692f8dcf8e334396eee84f00fdde2,这个功能十分有用,尤其是要验证缓冲对于性能影响的时候,以往,我们需要使用 pg_dropcache 插件 (不再维护,兼容到 12),或者手动重启数据库,同时为了清空 page cache,还需要使用额外的 echo xx > /proc/sys/vm/drop_caches,比较麻烦。在 17 版本中,pg_buffercache 支持了 pg_buffercache_evict,顾名思义,排除指定缓冲区。
借此机会,也顺便聊聊 PostgreSQL 经常被人诟病的双缓存。
小试牛刀
让我们试一下
postgres=# \dx+ pg_buffercache
 Objects in extension "pg_buffercache"
           Object description
----------------------------------------
 function pg_buffercache_evict(integer)
 function pg_buffercache_pages()
 function pg_buffercache_summary()
 function pg_buffercache_usage_counts()
 type pg_buffercache
 type pg_buffercache[]
 view pg_buffercache
(7 rows)

postgres=# show shared_buffers ;
 shared_buffers
----------------
 128MB
(1 row)

postgres=# create table test(id int,info text);
CREATE TABLE
postgres=# insert into test select n,'test' from generate_series(1,10000000) as n;
INSERT 0 10000000
postgres=# analyze test;
ANALYZE
postgres=# select reltuples,relpages from pg_class where relname = 'test';
   reltuples   | relpages
---------------+----------
 1.0000175e+07 |    54055
(1 row)
然后重启一下,释放 shared buffers
[postgres@mypg ~]$ psql
psql (17devel)
Type "help" for help.

postgres=# select count(*) from pg_buffercache where relfilenode = 'test'::regclass;
 count
-------
     0
(1 row)

postgres=# select pg_relation_filepath('test');
 pg_relation_filepath
----------------------
 base/5/16405
(1 row)
现在已经为 0 了。但是由于 PostgreSQL 的 Double Buffering 问题,因此无法知晓是否真正发生了 IO。
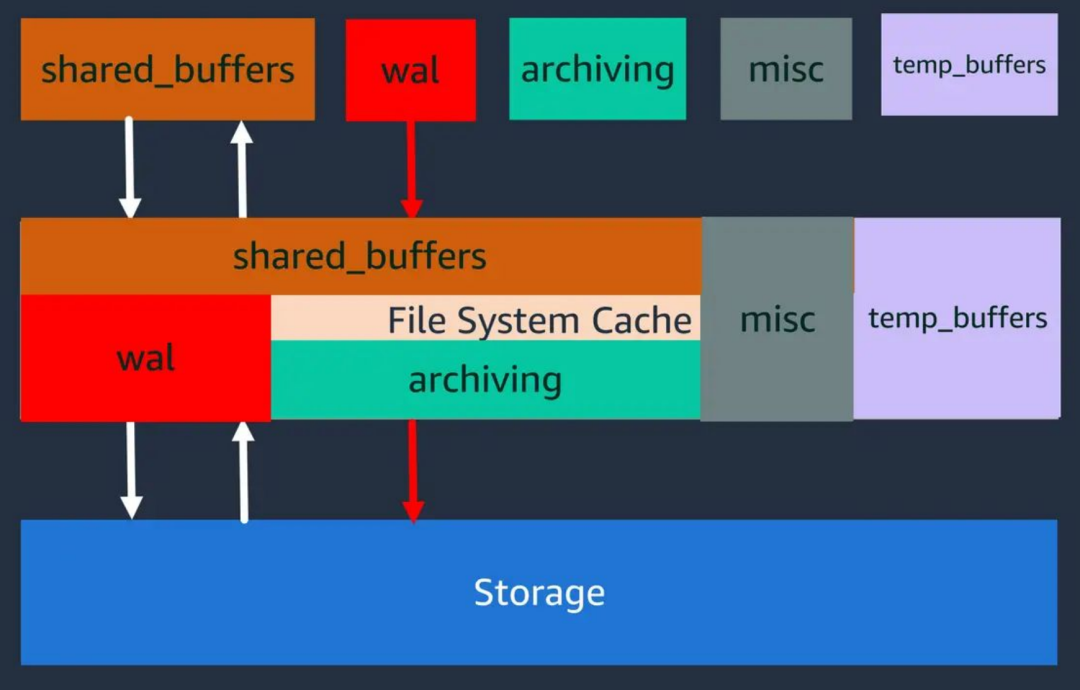
“数据库系统区分逻辑读 (来自 RAM,即来自缓冲区缓存) 和物理读 (来自磁盘)。从 PostgreSQL 的角度来看,页面既可以从缓冲区缓存中读取,也可以从操作系统请求,但是在后一种情况下,无法判断它是在 RAM 中找到的,还是从磁盘读取的。
不过我们可以借助工具,比如 fincore,fincore 的工作原理是将指定文件的相应 Inode Data 与 Kernel 的 Page Cache Table 做对比,如果 Page Cache Table 有这个 Inode 信息,就找到该 Inode 对应的 Data Block 的大小。不过这个工具不再维护了,pcstat 与 fincore 类似,使用 go 开发。
让我们使用 pcstat 瞅瞅,可以看到,test 这个表全部都在 page cache 中。
[postgres@mypg ~]$ ./pcstat 17data/base/5/16405
|---------------------+----------------+------------+-----------+---------|
| Name                | Size           | Pages      | Cached    | Percent |
|---------------------+----------------+------------+-----------+---------|
| 17data/base/5/16405 | 442818560      | 108110     | 108110    | 100.000 |
|---------------------+----------------+------------+-----------+---------|
为了更加可靠验证,让我们清空一下页缓存
[root@mypg ~]# echo 3 > /proc/sys/vm/drop_caches
[root@mypg ~]# su - postgres
Last login: Tue Apr 16 17:39:04 CST 2024 on pts/0
[postgres@mypg ~]$ ./pcstat 17data/base/5/16405
|---------------------+----------------+------------+-----------+---------|
| Name                | Size           | Pages      | Cached    | Percent |
|---------------------+----------------+------------+-----------+---------|
| 17data/base/5/16405 | 442818560      | 108110     | 0         | 000.000 |
|---------------------+----------------+------------+-----------+---------|
然后查询一下总行数,计算一下耗时:
postgres=# explain (buffers,MEMORY,analyze) select count(*) from test;
                                                                 QUERY PLAN
--------------------------------------------------------------------------------------------------------------------------------------------
 Finalize Aggregate  (cost=107138.55..107138.56 rows=1 width=8) (actual time=3997.807..3998.373 rows=1 loops=1)
   Buffers: shared hit=256 read=53799
   ->  Gather  (cost=107138.33..107138.54 rows=2 width=8) (actual time=3996.857..3998.362 rows=3 loops=1)
         Workers Planned: 2
         Workers Launched: 2
         Buffers: shared hit=256 read=53799
         ->  Partial Aggregate  (cost=106138.33..106138.34 rows=1 width=8) (actual time=3837.345..3837.346 rows=1 loops=3)
               Buffers: shared hit=256 read=53799
               ->  Parallel Seq Scan on test  (cost=0.00..95721.67 rows=4166667 width=0) (actual time=1.151..3409.149 rows=3333333 loops=3)
                     Buffers: shared hit=256 read=53799
 Planning:
   Buffers: shared hit=14 read=5
   Memory: used=12368 bytes  allocated=16384 bytes
 Planning Time: 29.235 ms
 Execution Time: 3998.479 ms
(15 rows)
说明在没有任何缓存的情况下,总共耗时约 4 秒。
让我们再次运行一下
postgres=# explain (buffers,MEMORY,analyze) select count(*) from test;
                                                                QUERY PLAN
-------------------------------------------------------------------------------------------------------------------------------------------
 Finalize Aggregate  (cost=107138.55..107138.56 rows=1 width=8) (actual time=1342.257..1342.324 rows=1 loops=1)
   Buffers: shared hit=352 read=53703
   ->  Gather  (cost=107138.33..107138.54 rows=2 width=8) (actual time=1341.114..1342.312 rows=3 loops=1)
         Workers Planned: 2
         Workers Launched: 2
         Buffers: shared hit=352 read=53703
         ->  Partial Aggregate  (cost=106138.33..106138.34 rows=1 width=8) (actual time=1331.432..1331.433 rows=1 loops=3)
               Buffers: shared hit=352 read=53703
               ->  Parallel Seq Scan on test  (cost=0.00..95721.67 rows=4166667 width=0) (actual time=0.038..727.401 rows=3333333 loops=3)
                     Buffers: shared hit=352 read=53703
 Planning:
   Memory: used=12368 bytes  allocated=16384 bytes
 Planning Time: 0.064 ms
 Execution Time: 1342.364 ms
(14 rows)

postgres=# select count(*) from pg_buffercache where relfilenode = 'test'::regclass;
 count
-------
     0
(1 row)
这次由于 Ring Buffer 的原因,可以看到,shared buffers 里面没有任何 test 的缓存,不难理解,Ring Buffer 就是为了避免缓冲区被污染,当大表的大小超过了缓冲区缓存的 1/4 时便会使用。环形缓冲区占用 256 kB。其他更多策略可以参照 Internal DB,或者 PostgreSQL 14 internal。
但是还是可以看到,时间快了接近 3 倍,这便是 page cache 的原因。
[postgres@mypg ~]$ ./pcstat 17data/base/5/16405
|---------------------+----------------+------------+-----------+---------|
| Name                | Size           | Pages      | Cached    | Percent |
|---------------------+----------------+------------+-----------+---------|
| 17data/base/5/16405 | 442818560      | 108110     | 108110    | 100.000 |
|---------------------+----------------+------------+-----------+---------|
可以看到,这个表全部在操作系统页缓存里面。因此,生产中对于延迟极为敏感的应用,可以考虑使用 pgfincore/pg_prewarm 进行预热。
缓冲逐出
让我们验证一下逐出这个功能
postgres=# create table t1(id int);
CREATE TABLE
postgres=# insert into t1 values(generate_series(1,1000));
INSERT 0 1000
postgres=# analyze t1;
ANALYZE
postgres=# select bufferid from pg_buffercache where relfilenode = 't1'::regclass;
 bufferid
----------
      990
      991
      992
      993
      994
      995
      996
      997
(8 rows)

postgres=# select pg_relation_filepath('t1');
 pg_relation_filepath
----------------------
 base/5/16408
(1 row)

postgres=# \q
[postgres@mypg ~]$ ./pcstat 17data/base/5/16408
|---------------------+----------------+------------+-----------+---------|
| Name                | Size           | Pages      | Cached    | Percent |
|---------------------+----------------+------------+-----------+---------|
| 17data/base/5/16408 | 40960          | 10         | 10        | 100.000 |
|---------------------+----------------+------------+-----------+---------|
老样子,这个表也全部在页缓存中。然后,让我们逐出 t1 表的所有 buffer
postgres=# select pg_buffercache_evict(bufferid) from pg_buffercache where relfilenode = 't1'::regclass;
 pg_buffercache_evict
----------------------
 t
 t
 t
 t
 t
 t
 t
 t
(8 rows)

postgres=# select count(*) from pg_buffercache where relfilenode = 't1'::regclass;
 count
-------
     0
(1 row)
可以看到,虽然 shared buffers 里面没有了,但是页缓存中还在,所以,切忌双缓存的影响。
[postgres@mypg ~]$ ./pcstat 17data/base/5/16408
|---------------------+----------------+------------+-----------+---------|
| Name                | Size           | Pages      | Cached    | Percent |
|---------------------+----------------+------------+-----------+---------|
| 17data/base/5/16408 | 40960          | 10         | 10        | 100.000 |
|---------------------+----------------+------------+-----------+---------|
小结
PostgreSQL 的双缓存被人诟病已久,从我这么久的经验来看,目前弊要大于利,时间一久,"直接可用"的内存就很少了,需要异步/直接回收,碰到业务高峰期的时候,会有明显延迟,尤其是 Direct Reclaim 的时候。
其次,由于双缓存的影响,查询的 RT 也不稳定,给人一种时快时慢的感觉,不过双缓存也并非完全一无是处,比如有 standby 的时候,亦或者数据库挂了重启的时候,由于页缓存,也可能不需要发生真正的 I/O,其次操作系统也可以合并一些 IO。
好在 16 已经提供了 Direct IO 的初步接口,相信在后面的大版本中会有改进。
另外,DBA Daily 5.0 已经正式定稿了,虽迟但到。目前已经在印刷中,第一期会小范围地赠送给一些朋友,后续赠送活动请关注后续消息。