


Prometheus 作为云原生时代的时序数据库, 是当下最流行的监控平台之一,尽管其整体架构一直没怎么变,但其底层的存储引擎却演进了几个版本,感兴趣的读者可参考 Prometheus 存储层的演进(https://tech.ipalfish.com/blog/2020/03/31/the-evolution-of-prometheus-storage-layer/)。本文主要介绍 Prometheus V2(即现在使用的)版本的存储格式细节,以及查询是如何定位到符合条件的数据,旨在通过本文的分析,对 Prometheus 的存储引擎有更深入了解。
说明:本文并不会涉及到查询的解析与函数求值过程。代码分析基于 v2.25.2 版本。
背景知识
时序特点
时序数据的特点可以用一话概括:垂直写(最新数据),水平查。
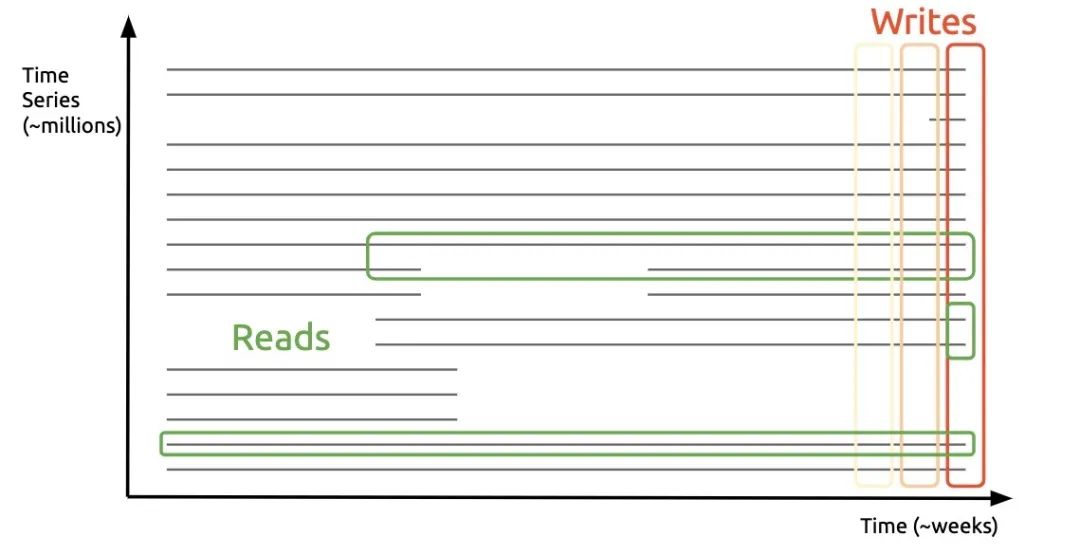
对于云原生场景来说,另一个特点是数据生命周期短,一次容器的扩缩容会导致时间线膨胀一倍。了解这两个特点后,来看看 Prometheus 是如何存储数据来迎合上述模式:
├── 01BKGV7JC0RY8A6MACW02A2PJD  // block 的 ULID
│   ├── chunks
│   │   └── 000001
│   ├── tombstones
│   ├── index
│   └── meta.json
├── chunks_head
│   └── 000001
└── wal
    ├── 000000002
    └── checkpoint.00000001
        └── 00000000
可以看到,数据目录主要有以下几部分:
block,一个时间段内(默认 2 小时)的所有数据,只读,用 ULID 命名。每一个 block 内主要包括:
chunks 固定大小(最大 128M)的 chunks 文件
index 索引文件,主要包含倒排索引的信息
meta.json 元信息,主要包括 block 的 minTime/maxTime,方便查询时过滤
chunks_head,当前在写入的 block 对应的 chunks 文件,只读,最多 120 个数据点,时间跨度最大 2 小时。
wal,Prometheus 采用攒批的方式来异步刷盘,因此需要 WAL 来保证数据可靠性
通过上面的目录结构,不难看出 Prometheus 的设计思路:
通过数据按时间分片的方式来解决数据生命周期短的问题
通过内存攒批的方式来对应只写最新数据的场景
数据模式
Prometheus 支持的模式比较简单,只支持单值模式,如下:
cpu_usage{core="1", ip="130.25.175.171"} 14.04 1618137750
metric     labels                        value timesample
倒排索引
索引是支持多维搜索的主要手段,时序中的索引结构和搜索引擎的类似,是个倒排索引,可参考下图
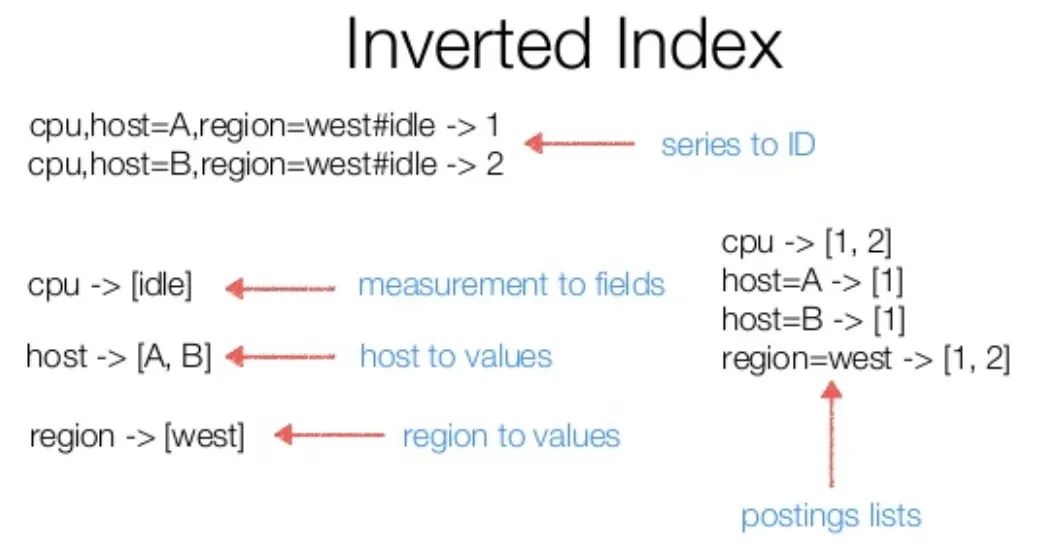
在一次查询中,会对涉及到的 label 分别求对应的 postings lists(即时间线集合),然后根据 filter 类型进行集合运算,最后根据运算结果得出的时间线,去查相应数据即可。
磁盘存储格式
数据格式
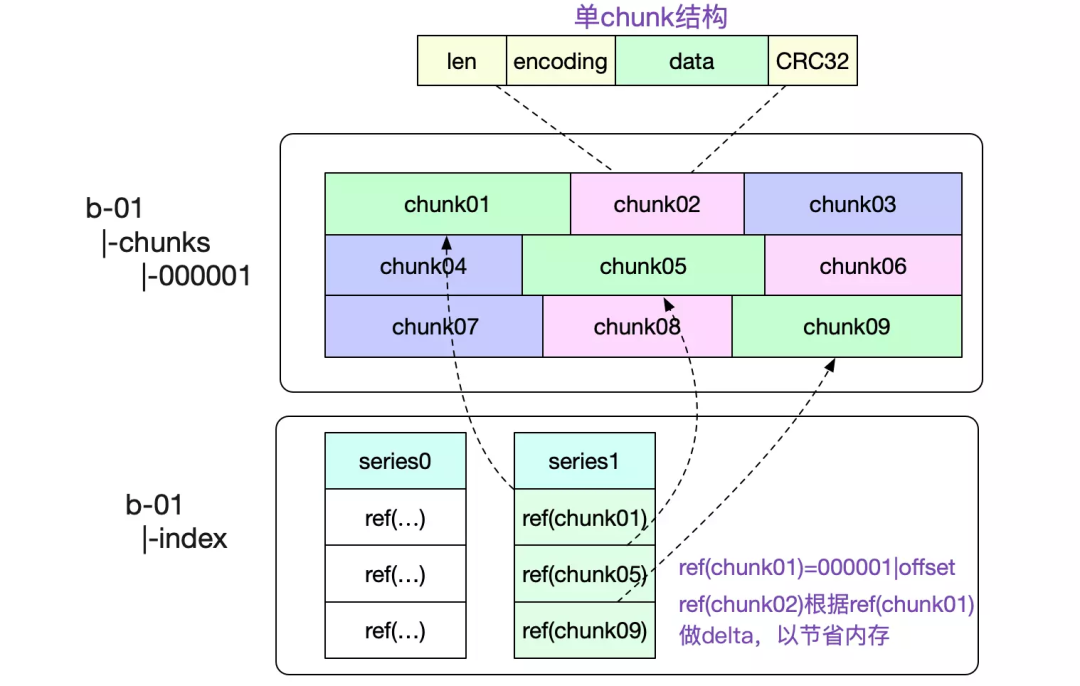
┌──────────────────────────────┐│ magic(0x0130BC91) <4 byte> │├──────────────────────────────┤│ version(1) <1 byte> │├──────────────────────────────┤│ padding(0) <3 byte> │├──────────────────────────────┤│ ┌──────────────────────────┐ ││ │ Chunk 1 │ ││ ├──────────────────────────┤ ││ │ ... │ ││ ├──────────────────────────┤ ││ │ Chunk N │ ││ └──────────────────────────┘ │└──────────────────────────────┘# 单个 chunk 内的结构┌─────────────────────┬───────────────────────┬───────────────────────┬───────────────────┬───────────────┬──────────────┬────────────────┐| series ref <8 byte> | mint <8 byte, uint64> | maxt <8 byte, uint64> | encoding <1 byte> | len <uvarint> | data <bytes> │ CRC32 <4 byte> │└─────────────────────┴───────────────────────┴───────────────────────┴───────────────────┴───────────────┴──────────────┴────────────────┘
chunk 为数据在磁盘中的最小组织单元,需要明确以下两点:
单个 chunk 的时间跨度默认是 2 小时,Prometheus 后台会有合并操作,把时间相邻的 block 合到一起
series ref 为时间线的唯一标示,由 8 个字节组成,前 4 个表示文件 id,后 4 个表示在文件内的 offset,需配合后文的索引结构来实现数据的定位
索引格式
┌────────────────────────────┬─────────────────────┐│ magic(0xBAAAD700) <4b> │ version(1) <1 byte> │├────────────────────────────┴─────────────────────┤│ ┌──────────────────────────────────────────────┐ ││ │ Symbol Table │ ││ ├──────────────────────────────────────────────┤ ││ │ Series │ ││ ├──────────────────────────────────────────────┤ ││ │ Label Index 1 │ ││ ├──────────────────────────────────────────────┤ ││ │ ... │ ││ ├──────────────────────────────────────────────┤ ││ │ Label Index N │ ││ ├──────────────────────────────────────────────┤ ││ │ Postings 1 │ ││ ├──────────────────────────────────────────────┤ ││ │ ... │ ││ ├──────────────────────────────────────────────┤ ││ │ Postings N │ ││ ├──────────────────────────────────────────────┤ ││ │ Label Offset Table │ ││ ├──────────────────────────────────────────────┤ ││ │ Postings Offset Table │ ││ ├──────────────────────────────────────────────┤ ││ │ TOC │ ││ └──────────────────────────────────────────────┘ │└──────────────────────────────────────────────────┘
在一个索引文件中,最主要的是以下几部分(从下往上):
TOC 存储的是其他部分的 offset
Postings Offset Table,用来存储倒排索引,Key 为 label name/value 序对,Value 为 Postings 在文件中的 offset。
Postings N,存储的是具体的时间线序列
Series,存储的是当前时间线,对应的 chunk 文件信息
Label Offset Table 与 Label Index 目前在查询时没有使用到,这里不再讲述
每个部分的具体编码格式,可参考官方文档 Index Disk Format,这里重点讲述一次查询是如何找到符合条件的数据的:
首先在 Posting Offset Table 中,找到对应 label 的 Postings 位置
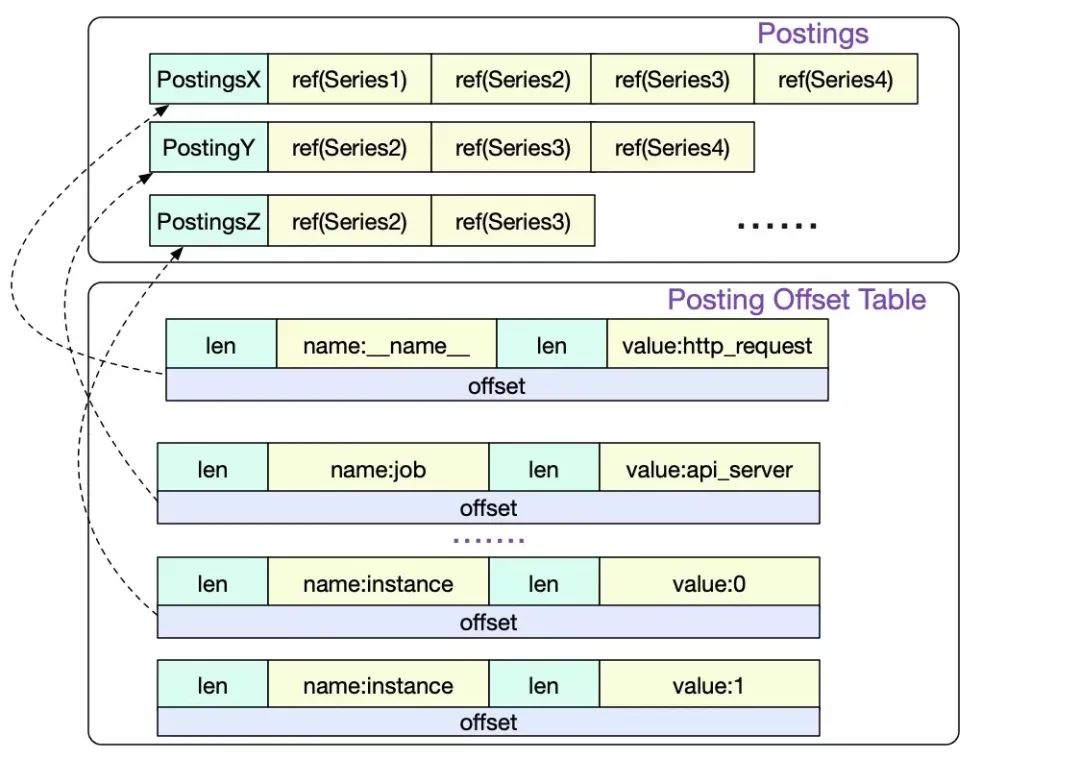
然后再根据 Postings 中的 series 信息,找到对应的 chunk 位置,即上文中的 series ref。
使用方式
Prometheus 在启动时,会去加载数据元信息到内存中。主要有下面两部分:
block 的元信息,最主要的是 mint/maxt,用来确定一次查询是否需要查看当前 block 文件,之后把 chunks 文件以 mmap 方式打开
// open all blocksbDirs, err := blockDirs(dir)for _, bDir := range bDirs {meta, _, err := readMetaFile(bDir)// See if we already have the block in memory or open it otherwise.block, open := getBlock(loaded, meta.ULID)if !open {block, err = OpenBlock(l, bDir, chunkPool)if err != nil {corrupted[meta.ULID] = errcontinue}}blocks = append(blocks, block)}// open chunk filesfor _, fn := range files {f, err := fileutil.OpenMmapFile(fn)if err != nil {return nil, tsdb_errors.NewMulti(errors.Wrap(err, "mmap files"),tsdb_errors.CloseAll(cs),).Err()}cs = append(cs, f)bs = append(bs, realByteSlice(f.Bytes()))}
block 对应的索引信息,主要是倒排索引。由于单个 label 对应的 Postings 可能会非常大,Prometheus 不是全量加载,而是每隔 32 个加载,来减轻内存压力。并且保证第一个与最后一个一定被加载,查询时采用类似跳表的方式进行 posting 定位。
下面代码为 DB 启动时,读入 postings 的逻辑:// For the postings offset table we keep every label name but only every nth// label value (plus the first and last one), to save memory.ReadOffsetTable(r.b, r.toc.PostingsTable, func(key []string, _ uint64, off int) error {if _, ok := r.postings[key[0]]; !ok {// Next label name.r.postings[key[0]] = []postingOffset{}if lastKey != nil {// Always include last value for each label name.r.postings[lastKey[0]] = append(r.postings[lastKey[0]], postingOffset{value: lastKey[1], off: lastOff})}lastKey = nilvalueCount = 0}if valueCount%32 == 0 {r.postings[key[0]] = append(r.postings[key[0]], postingOffset{value: key[1], off: off})lastKey = nil} else {lastKey = keylastOff = off}valueCount++}if lastKey != nil {r.postings[lastKey[0]] = append(r.postings[lastKey[0]], postingOffset{value: lastKey[1], off: lastOff})}
下面代码为根据 label 查询 postings 的逻辑,完整可见 index 的 Postings 方法:
e, ok := r.postings[name] // name 为 label keyif !ok || len(values) == 0 { // values 为当前需要查询的 label valuesreturn EmptyPostings(), nil}res := make([]Postings, 0, len(values))skip := 0valueIndex := 0for valueIndex < len(values) && values[valueIndex] < e[0].value {// Discard values before the start.valueIndex++}for valueIndex < len(values) {value := values[valueIndex]// 用二分查找,找到当前 value 在 postings 中的位置i := sort.Search(len(e), func(i int) bool { return e[i].value >= value })if i == len(e) {// We're past the end.break}if i > 0 && e[i].value != value { // postings 中没有该 value,需要用前面一个来在文件中搜索// Need to look from previous entry.i--}// Don't Crc32 the entire postings offset table, this is very slow// so hope any issues were caught at startup.d := encoding.NewDecbufAt(r.b, int(r.toc.PostingsTable), nil)d.Skip(e[i].off)// Iterate on the offset table.var postingsOff uint64 // The offset into the postings table.for d.Err() == nil {// ... skip 逻辑省略v := d.UvarintBytes() // Label value.postingsOff = d.Uvarint64() // Offset.for string(v) >= value {if string(v) == value {// Read from the postings table.d2 := encoding.NewDecbufAt(r.b, int(postingsOff), castagnoliTable)_, p, err := r.dec.Postings(d2.Get())res = append(res, p)}valueIndex++if valueIndex == len(values) {break}value = values[valueIndex]}if i+1 == len(e) || value >= e[i+1].value || valueIndex == len(values) {// Need to go to a later postings offset entry, if there is one.break}}}
内存结构
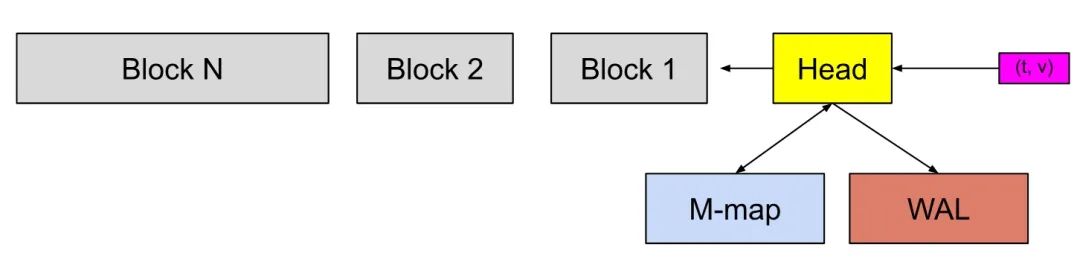
Block 在 Prometheus 实现中,主要分为两类:
当前正在写入的,称为 head。当超过 2 小时或超过 120 个点时,head 会将 chunk 写入到本地磁盘中,并使用 mmap 映射到内存中,保存在下文的 mmappedChunk 中。
历史只读的,存放在一数组中
type DB struct {blocks []*Blockhead *Head// ... 忽略其他字段}// Block 内的主要字段是 IndexReader,其内部主要是 postings,即倒排索引// Map of LabelName to a list of some LabelValues's position in the offset table.// The first and last values for each name are always present.postings map[string][]postingOffsettype postingOffset struct {value string // label valueoff int // posting 在对于文件中的 offset}
在上文磁盘结构中介绍过,postingOffset 不是全量加载,而是每隔 32 个。
Head
type Head struct {postings *index.MemPostings // Postings lists for terms.// All series addressable by their ID or hash.series *stripeSeries// ... 忽略其他字段}type MemPostings struct {mtx sync.RWMutexm map[string]map[string][]uint64 // label key -> label value -> posting listsordered bool}
MemPostings 是 Head 中的索引结构,与 Block 的 postingOffset 不同,posting 是全量加载的,毕竟 Head 保存的数据较小,对内存压力也小。
type stripeSeries struct {size intseries []map[uint64]*memSerieshashes []seriesHashmaplocks []stripeLockseriesLifecycleCallback SeriesLifecycleCallback}type memSeries struct {sync.RWMutexmmappedChunks []*mmappedChunk // 只读headChunk *memChunk // 读写...... // 省略其他字段}type mmappedChunk struct {// 数据文件在磁盘上的位置,即上文中的 series refref uint64numSamples uint16minTime, maxTime int64}
stripeSeries 是比较的核心结构,series 字段的 key 为时间线,采用自增方式生成;value 为 memSeries,内部有存储具体数据的 chunk,采用分段锁思路来减少锁竞争。
使用方式
对于一个查询,大概涉及的步骤:
根据 label 查出所涉及到的时间线,然后根据 filter 类型,进行集合运算,找出符合要求的时间线
根据时间线信息与时间范围信息,去 block 内查询符合条件的数据
在第一步主要在 PostingsForMatchers 函数中完成,主要有下面几个优化点:
对于取反的 filter(
!=
!~
),转化为等于的形式,这样因为等于形式对应的时间线往往会少于取反的效果,最后在合并时,减去这些取反的时间线即可。可参考:Be smarter in how we look at matchers. #572
不同 label 的时间线合并时,利用了时间线有序的特点,采用类似 mergesort 的方式来惰性合并,大致过程如下:
type intersectPostings struct {arr []Postings // 需要合并的时间线数组cur uint64 // 当前的时间线}func (it *intersectPostings) doNext() bool {Loop:for {for _, p := range it.arr {if !p.Seek(it.cur) {return false}if p.At() > it.cur {it.cur = p.At()continue Loop}}return true}}func (it *intersectPostings) Next() bool {for _, p := range it.arr {if !p.Next() {return false}if p.At() > it.cur {it.cur = p.At()}}return it.doNext()}
在第一步查出符合条件的 chunk 所在文件以及 offset 信息之后,第二步的取数据则相对简单,直接使用 mmap 读数据即可,这间接利用操作系统的 page cache 来做缓存,自身不需要再去实现 Buffer Pool 之类的数据结构。
总结
通过上文的分析,大体上把 Prometheus 的存储结构以及查询流程分析了一遍,还有些细节没再展开去介绍,比如为了节约内存使用,label 使用了字典压缩,但这并不妨碍读者理解其原理。
此外,Prometheus 默认 2 小时一个 Block 对大时间范围查询不友好,因此其后台会对定期 chunk 文件进行 compaction,合并后的文件大小为 min(31d, retention_time * 0.1)
,相关细节后面有机会再单独介绍吧。
关于我们
我们是蚂蚁智能监控技术中台的时序存储团队,我们正在使用 Rust 构建高性能、低成本并具备实时分析能力的新一代时序数据库,欢迎加入或者推荐,目前我们也正在寻找优秀的实习生,也欢迎广大应届同学来我们团队实习,请联系:jiachun.fjc@antgroup.com
参考
Prometheus时序数据库-数据的查询 https://my.oschina.net/alchemystar/blog/4985328
Prometheus时序数据库-磁盘中的存储结构 https://my.oschina.net/alchemystar/blog/4965684
Prometheus TSDB (Part 1): The Head Block https://ganeshvernekar.com/blog/prometheus-tsdb-the-head-block/
Prometheus TSDB (Part 4): Persistent Block and its Index https://ganeshvernekar.com/blog/prometheus-tsdb-persistent-block-and-its-index/
Prometheus TSDB (Part 5): Queries https://ganeshvernekar.com/blog/prometheus-tsdb-queries/
Prometheus: The Unicorn in Metrics https://www.alibabacloud.com/blog/prometheus-the-unicorn-in-metrics_595168
Writing a Time Series Database from Scratch https://fabxc.org/tsdb/
https://github.com/prometheus/prometheus/blob/main/tsdb/docs/format/index.md
