1. 什么是Spread?
Vertica 使用开源工具包 Spread 来提供高性能消息服务,该服务能够应对网络故障。当您的数据库首次启动时,Spread 守护程序会自动启动。Spread 守护程序在集群中的控制节点上运行。控制节点管理消息通信。
注意:
集群规模小于120节点时,一般没有控制节点,即每个节点上都会有自己的spread守护程序。
集群规模超过120节点时,创建数据库时会设置控制节点,这时spread守护进程只在控制节点上,且如果该控制节点上的spread进程关闭,该组的所有节点均会宕机。
2. Vertica 进程和 Spread 守护进程
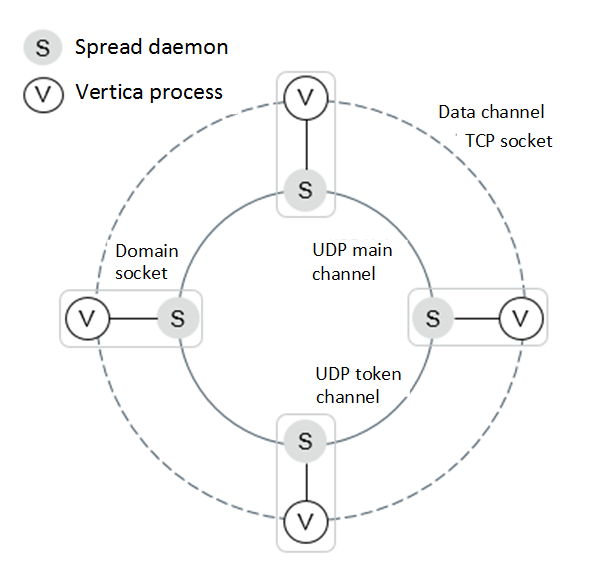
Vertica 安装过程会在您的数据库上安装 Spread 守护进程。Vertica 进程中的节点使用域套接字(domain socket)与 Spread 守护进程通信。
节点之间的通信通过 2 个通道进行 - 数据通道和控制通道(UDP main channel 和 UDP token channel)。
下图显示了一个具有域套接字(domain socket)和 2 个通道的 4 节点集群。
- 同一节点上的 Vertica 进程和 Spread 守护进程通过域套接字(domain socket)相互连接。
- 一个节点上的 Vertica 进程通过 TCP 套接字(TCP socket)与另一个节点上的 Vertica 进程连接。
- 一个节点上的 Spread 守护进程通过 UDP 令牌(UDP token)和主通道(main channels)连接到另一个节点上的 Spread 守护进程。
3. Vertica 和 Spread 如何协同工作?
如果所有节点都运行正常,Vertica 和 Spread 可以无缝地相互通信。
Spread 守护进程通过交换 UDP 数据包相互通信。使用的两个 UDP 通道(或端口)是:
- 主通道 - Spread 守护进程在此向其他守护进程发送与 Spread 相关的控制消息,Vertica 相关的控制消息源自 Vertica 服务器。
- 令牌通道 - 一个称为 Spread 令牌的特殊消息从一个 Spread 守护进程传递到下一个 Spread 守护进程。令牌对于成员资格、容错以及强制执行一致的控制消息排序非常重要。
如果一个节点上的 Spread 停止与集群中的其他 Spread 通信,则 Spread 守护进程会从集群成员资格中删除该节点。Spread 守护进程会等待特定时间(称为 Spread Token Timeout),然后再从成员资格中删除节点。
节点上的 Spread 通过Domain socket与该节点上的 Vertica 进程通信,并发送心跳以检查其健康状况。如果心跳丢失超过 5 次,则该节点上的 Spread 守护程序将驱逐 Vertica 进程并通过 UDP socket通知所有其他节点。
4. 什么时候Vertica 和 Spread 会无法通信?
您可能会遇到 Spread 守护程序与 Vertica 之间通信失败的情况。
4.1 Spread Token 超时
Spread 守护程序使用令牌机制监视彼此的运行状况。令牌是通过User Datagram Protocol (UDP) 在当前活跃节点之间传递的一种特殊 Spread 消息。令牌验证所有节点中的 Spread 守护程序是否处于活动状态。令牌在特定时间内处于活动状态,称为 Spread 令牌超时(Spread Token Timeout)。如果用户终止 Spread 守护程序,则集群中其他节点上的 Spread 守护程序将通过令牌超时检测已终止的 Spread 守护程序。
Vertica 9.1 及更早版本中的默认 Spread Token Timeout 为 8 秒。在 Vertica 9.2 及更高版本中,默认 Spread Token Timeout 取决于配置的 Spread segments数量。如果配置的 Spread segments为 1,则默认超时为 8 秒。如果大于 1,则默认超时为 25 秒。如果网络延迟或虚拟环境的临时暂停持续时间超过 Spread 超时期限,您可能会看到 UP 节点离开数据库。在这些情况下,您可以增加 Spread 超时以减少或消除 UP 节点离开数据库的情况。
在 Azure 中,您可能会看到正在运行的节点由于计划维护而离开数据库。 Azure 的维护停机时间通常定义明确。例如,Azure 的内存保留更新可以在对托管 VM 的系统执行维护时将 VM 暂停长达 30 秒。此暂停不会中断节点。一旦 Azure 恢复它,它将继续正常运行。如果您使用 Azure Marketplace 部署 Vertica 群集,则扩展超时默认为 35 秒。如果您在 Azure 中手动创建群集,则扩展超时默认为 8 或 25 秒,如前所述。
长token timeout需要更多时间,直到 Spread 识别出 DOWN 节点并从集群中删除节点。
有关如何调整 Spread 令牌超时的更多信息,请参阅调整虚拟环境的 Spread 守护进程超时。
有关超时原因的更多信息,请参阅本文档中的“对 Spread 令牌超时和不健康节点进行故障排除”部分。
4.2 不健康节点
为了减少 Vertica 数据库中不健康节点的影响,Vertica 会定期执行健康检查。健康检查会定期执行。每次检查的时间间隔由 DatabaseHeartBeatInterval 参数设置。此参数指定每个节点执行的内部健康检查之间的时间间隔。健康检查成功后,节点会发送心跳。如果在 5 个间隔过去后仍未检测到心跳,则该节点将从数据库集群中逐出。
有关超时原因的更多信息,请参阅本文档中的“对 Spread Token 超时和不健康节点进行故障排除”部分。
4.3 Vertica 进程崩溃或使用 kill-9 突然终止
Vertica 进程为 Spread 守护程序创建 PROBE 消息。但是,如果 Vertica 进程崩溃或使用 kill-9 突然终止,则该 Vertica 进程无法向其他节点发送 PROBE 消息或调用 Spread API SP_disconnect。
如果已终止 Vertica 进程的 Spread 守护程序仍在运行,则 Spread 守护程序会通过 TCP 套接字连接收到有关已终止 Vertica 进程的消息。然后,Spread 守护程序会通知集群中的其他节点,Vertica 进程已离开当前成员资格。
4.4 数据库宕机
如果节点发生故障,其他节点上的 Spread 守护程序会通过令牌超时检测已关闭的 Spread 守护程序。假设您有一个 8 节点集群,K-safety 值为 1。如果 4 个节点发生故障或 2 个伙伴节点(逻辑相邻节点)发生故障,则数据库将发生故障。当节点发生故障且数据库仍可继续运行时,Vertica 进程将调用成员资格协议以启用其余的 Spread 守护程序来创建新的成员资格。
5. 解决 Spread Token 超时和节点不健康问题
Spread Token Timeout 和 Unhealthy Node 有几种情况。以 dbadmin 用户身份运行以下脚本,从集群收集信息,并考虑每种情况的可能性。
$ ./collect_for_spread.sh [-U username] [-w password] [-p port] [-f output_format] [-z dbhost] -s start_time -e end_time

Arguments description:
-U Use database administrator account for username.
-w Database administrator account password in single quotes. Can be skipped in case no password is set.
-p Database server port. Can be skipped if database is running on default port 5433.
-f Specifies output mode. Can be stdout or file. Default is stdout.
-s Specifies start time in single quotes. Format is YYYY-MM-DD HH24:MI:SS.
-e Specifies start time in single quotes. Format is YYYY-MM-DD HH24:MI:SS.
-z is optional if dbhost is needed for connecting to Vertica.
5.1 Spring Ring Size
随着 Spread 守护进程的数量增加,传递令牌和创建成员资格时会出现超时。Spread 将每条消息(使用 UDP)广播到配置中的每个其他守护进程,从而导致网络拥塞增加。如果您有超过 50 个节点,则必须转到大型集群模式。
有关如何配置大型集群模式的更多信息,请参阅 Vertica 管理员指南中的大型集群。
5.2 网络带宽不足
高网络使用率会延迟节点之间的通信。
a. 通过查询 DC_NETWORK_INFO 系统表检查系统的网络使用情况。
先前运行的脚本还收集了以下网络使用信息。
=======================================================
b. Network Bandwidth Starvation
=======================================================
b-1. Network usage from DC_NETWORK_INFO
=======================================================
node_name     |     start_time      |      end_time       | tx_kbytes_per_sec | rx_kbytes_per_sec | total_kbytes_per_sec
------------------+---------------------+---------------------+-------------------+-------------------+----------------------
v_trial_node0001 | 2020-08-04 04:44:59 | 2020-08-04 04:45:00 |          44035.44 |          11274.09 |             55309.53
v_trial_node0002 | 2020-08-04 04:44:59 | 2020-08-04 04:45:00 |          13098.37 |          22710.12 |             35808.49
v_trial_node0003 | 2020-08-04 04:44:59 | 2020-08-04 04:45:00 |           3116.41 |          24514.25 |             27630.66
v_trial_node0004 | 2020-08-04 04:44:59 | 2020-08-04 04:45:00 |            5334.8 |          23950.17 |             29284.97
v_trial_node0001 | 2020-08-04 04:45:00 | 2020-08-04 04:45:01 |          17377.85 |          28435.98 |             45813.83
v_trial_node0002 | 2020-08-04 04:45:00 | 2020-08-04 04:45:01 |          17255.69 |          25164.83 |             42420.52
v_trial_node0003 | 2020-08-04 04:45:00 | 2020-08-04 04:45:01 |          46322.48 |          19192.34 |             65514.82
v_trial_node0004 | 2020-08-04 04:45:00 | 2020-08-04 04:45:01 |           9300.44 |             31563 |             40863.44
.....
b. 使用 vnetperf 测量主机的网络性能。
使用 vnetperf 将发送的兆字节数和接收的兆字节数与可用带宽进行比较。之前运行的脚本还收集了 vnetperf 的结果。
在以下示例中,可用带宽约为 600 MB(4.6 Gbps)。
=======================================================
b-2. Network performance from vnetperf
=======================================================
date                    | test              | rate limit (MB/s) | node    | MB/s (sent) | MB/s (rec)
-----------------------------------------------------------------------------------------------------
2020-08-04_05:38:35,962 | tcp-throughput    | 32                | average | 30.6099     | 30.6099
2020-08-04_05:38:37,968 | tcp-throughput    | 64                | average | 61.1261     | 61.1261
2020-08-04_05:38:39,972 | tcp-throughput    | 128               | average | 122.137     | 122.137
2020-08-04_05:38:41,977 | tcp-throughput    | 256               | average | 244.212     | 244.212
2020-08-04_05:38:43,980 | tcp-throughput    | 512               | average | 488.345     | 488.345
2020-08-04_05:38:45,984 | tcp-throughput    | 640               | average | 588.28      | 588.204
2020-08-04_05:38:47,988 | tcp-throughput    | 768               | average | 663.714     | 663.59
2020-08-04_05:38:49,994 | tcp-throughput    | 1024              | average | 779.429     | 778.769
2020-08-04_05:38:52,83  | tcp-throughput    | 2048              | average | 688.616     | 688.431
c. 使用数据库设计器调整查询或手动调整。
未优化的投影可能会因 RESEGMENT/BROADCAST 运算符而导致高网络使用率。
d. 如果您仍然看到网络使用率过高,请升级您的网络。
如果 CPU 使用率不高,您可以通过启用 CompressNetworkData 配置参数来压缩网络数据。例如:
=> ALTER DATABASE DEFAULT SET CompressNetworkData = 1;
5.3 磁盘 I/O 带宽不足
如果 Vertica 数据库具有大 RAM 和大内存,则默认内存将用于写入缓存,再将WOS中的数据全量写入到磁盘。写入磁盘时会长时间阻止 Spread 守护进程,从而触发令牌超时。
如果磁盘无法跟上传入的写入请求,系统会将数据从应用程序写入磁盘。这会导致写入缓存增长超过阈值。内核会阻止所有 IO 请求,直到缓存刷新到定义的阈值以下。有时,在高负载下,这会导致节点退出集群。
vm.dirty_background_ratio = 3
vm.dirty_ratio = 5
第一个参数 vm.dirty_background ratio 定义写入缓存使用率的阈值。达到阈值后,内核将执行后台刷新到磁盘。
第二个参数 vm.dirty_ratio 定义内存阈值。如果阈值变脏,内核将开始阻止其他 IO 请求,直到刷新完成。
有关如何调整这些阈值的更多信息,请参阅调整 Vertica 的 Linux 脏数据参数。
您可以使用以下步骤检查磁盘 I/O 使用情况。
a. 通过查询 DC_IO_INFO 系统表检查系统的磁盘 I/O 使用情况。
之前运行的脚本还收集以下磁盘 I/O 使用情况信息。
=======================================================
c. Disk I/O Bandwidth Starvation
=======================================================
c-1. Disk I/O usage from DC_IO_INFO
=======================================================
node_name     | device_name |     start_time      |      end_time       | read_mbytes_per_sec | written_mbytes_per_sec | total_mbytes_per_sec
------------------+-------------+---------------------+---------------------+---------------------+------------------------+----------------------
v_trial_node0001 | sda3        | 2020-08-05 06:12:50 | 2020-08-05 06:12:51 |               78.43 |                 272.11 |               350.54
v_trial_node0002 | sda3        | 2020-08-05 06:12:50 | 2020-08-05 06:12:51 |                  89 |                   22.5 |                111.5
v_trial_node0003 | sda3        | 2020-08-05 06:12:50 | 2020-08-05 06:12:51 |                9.92 |                  72.07 |                81.99
v_trial_node0004 | sda3        | 2020-08-05 06:12:50 | 2020-08-05 06:12:51 |               12.07 |                   50.4 |                62.47
v_trial_node0001 | sda3        | 2020-08-05 06:12:51 | 2020-08-05 06:12:52 |                95.6 |                 188.33 |               283.93
v_trial_node0002 | sda3        | 2020-08-05 06:12:51 | 2020-08-05 06:12:52 |                  76 |                 196.23 |               272.23
v_trial_node0003 | sda3        | 2020-08-05 06:12:51 | 2020-08-05 06:12:52 |                5.98 |                 107.47 |               113.45
v_trial_node0004 | sda3        | 2020-08-05 06:12:51 | 2020-08-05 06:12:52 |               19.91 |                    133 |               152.91
v_trial_node0001 | sda3        | 2020-08-05 06:12:52 | 2020-08-05 06:12:53 |               88.32 |                  86.67 |               174.99
v_trial_node0002 | sda3        | 2020-08-05 06:12:52 | 2020-08-05 06:12:53 |               78.01 |                 195.02 |               273.03
v_trial_node0003 | sda3        | 2020-08-05 06:12:52 | 2020-08-05 06:12:53 |                   2 |                  92.27 |                94.27
v_trial_node0004 | sda3        | 2020-08-05 06:12:52 | 2020-08-05 06:12:53 |                  19 |                   71.5 |                 90.5
v_trial_node0001 | sda3        | 2020-08-05 06:12:53 | 2020-08-05 06:12:54 |                97.5 |                 164.29 |               261.79
v_trial_node0002 | sda3        | 2020-08-05 06:12:53 | 2020-08-05 06:12:54 |                72.5 |                 213.17 |               285.67
v_trial_node0003 | sda3        | 2020-08-05 06:12:53 | 2020-08-05 06:12:54 |                   0 |                  93.29 |                93.29
v_trial_node0004 | sda3        | 2020-08-05 06:12:53 | 2020-08-05 06:12:54 |               18.85 |                  76.27 |                95.12
.....
b. 使用 vioperf 测量主机的磁盘 I/O 性能。
使用 vioperf 将读取的兆字节数和写入的兆字节数与可用带宽进行比较。之前运行的脚本还收集了 vioperf 的结果。在下面的示例中,可用带宽约为写入 340 MB/s、读取 250 MB/s、读写 200 MB/s。
=======================================================
c-2. Disk I/O performance from vioperf
=======================================================
test      | directory                                       | counter name        | counter value | thread count | %CPU | %IO Wait
---------------------------s--------------------------------------------------------------------------------------------------------
Write     | ...badmin/trial/v_trial_node0001_catalog/Catalog| MB/s                | 340           | 4            | 28   | 49
ReWrite   | ...badmin/trial/v_trial_node0001_catalog/Catalog| (MB-read+MB-write)/s| 100+100       | 4            | 7    | 46
Read      | ...badmin/trial/v_trial_node0001_catalog/Catalog| MB/s                | 250           | 4            | 17   | 45
SkipRead  | ...badmin/trial/v_trial_node0001_catalog/Catalog| seeks/s             | 3199          | 4            | 2    | 38
c. 按照前面所述调整 Linux 脏页参数。
使用 Database Designer 调整查询或手动调整。未优化的投影可能会因未优化的编码类型而导致磁盘 I/O 使用率过高。
5.4 网络 UDP 接收错误和 TCP 重传
如果您看到大量 UDP 数据包接收错误或 TCP 重传段,则可能需要按如下方式调整内核参数。
a. 通过查询 DC_NETSTATS 系统表检查 UDP 网络数据包接收错误和 TCP 重传段的数量。
之前运行的脚本也收集了这些数字和比率。
=======================================================
d. Network UDP Receive Error and TCP Retransmitted
=======================================================
node_name     |     start_time      |      end_time       | upd_packet_receive_errors | udp_packets_received | upd_packet_receive_error_ratio | tcp_segments_retransmited | tcp_segments_received | tcp_segments_retrans_ratio
------------------+---------------------+---------------------+---------------------------+----------------------+--------------------------------+---------------------------+-----------------------+----------------------------
v_trial_node0001 | 2020-08-04 05:05:33 | 2020-08-04 05:05:34 |                         0 |                   63 |                              0 |                         0 |                 26233 |                          0
v_trial_node0002 | 2020-08-04 05:05:33 | 2020-08-04 05:05:34 |                         0 |                   30 |                              0 |                         0 |                 12317 |                          0
v_trial_node0003 | 2020-08-04 05:05:33 | 2020-08-04 05:05:34 |                         0 |                  260 |                              0 |                         0 |                 23149 |                          0
v_trial_node0004 | 2020-08-04 05:05:33 | 2020-08-04 05:05:34 |                         0 |                  260 |                              0 |                         0 |                 21644 |                          0
v_trial_node0001 | 2020-08-04 05:05:34 | 2020-08-04 05:05:35 |                         0 |                    0 |                              0 |                         0 |                 39041 |                          0
v_trial_node0002 | 2020-08-04 05:05:34 | 2020-08-04 05:05:35 |                         0 |                  234 |                              0 |                         0 |                 35312 |                          0
v_trial_node0003 | 2020-08-04 05:05:34 | 2020-08-04 05:05:35 |                         0 |                    0 |                              0 |                         0 |                 38657 |                          0
v_trial_node0004 | 2020-08-04 05:05:34 | 2020-08-04 05:05:35 |                         0 |                    0 |                              0 |                         0 |                 35711 |                          0
.....
b. 如果您看到大量 UDP 数据包接收错误或 TCP 重传段,请将以下参数添加到 /etc/sysctl.conf 文件中。
# Sets the number of incoming connections
net.core.somaxconn = 1024
net.ipv4.tcp_max_syn_backlog = 1024

# Sets the send socket buffer default size in bytes.
net.core.wmem_default = 262144

# Sets the receive socket buffer default size in bytes.
net.core.rmem_default = 262144

# Sets the send socket buffer maximum size in bytes.
net.core.wmem_max = 16777216

# Sets the receive socket buffer maximum size in bytes.
# If you see UDP packet errors with the following number, you can increase this value by 33554432.
net.core.rmem_max = 16777216

# Sets the maximum number of packets allowed to queue when a particular interface receives packets faster than the kernel can process them.
# Increase the length of the processor input queue
net.core.netdev_max_backlog = 100000

# Sets the minimum, pressure, maximum number of memory pages used by TCP socket.
net.ipv4.tcp_mem = 16777216 16777216 16777216

# Sets the TCP socket buffer minimum, default, maximum size in bytes.
net.ipv4.tcp_wmem = 8192 262144 8388608
net.ipv4.tcp_rmem = 8192 262144 8388608

# Sets the minimum, pressure, maximum number of memory pages used by UDP socket.
net.ipv4.udp_mem = 16777216 16777216 16777216

# Sets the UDP socket buffer minimum size in bytes.
net.ipv4.udp_rmem_min = 16384
net.ipv4.udp_wmem_min = 16384
在/etc/sysctl.conf文件中添加参数后,运行以下命令:
$ sysctl -p
如果您继续看到大量 UDP 数据包接收错误或 TCP 重新传输段,则可能需要关闭网络接口卡上的 TCP offload功能。
c. 使用以下命令检查 TCP offload功能的当前配置。
内核协议栈在传输数据时(内核数据的传输流程可以参考Linux网络协议之数据发送流程, 除了从内核空间拷贝数据耗时外, 还有两件事情需要消耗CPU资源:
- 数据包传送到网络层L2时, 需要按照网卡的MTU对数据包进行分片
- 传送数据时需要对数据包进行校验和计算(checksum)
一般来说网卡的MTU都默认设置为1500字节, 一旦TCP/UDP等L3的数据包超过了设定的MTU, 网络层L2就需要将其分割成MTU大小的数据段. 比如为了传输3200bytes的数据, 通常需要分割成3个包进行发送. 为了避免分片, 可以通过设置一个大的MTU, 比如在需要高速网络传输时将MTU设置为9000(JUBO frame), 但这个在广域网中很难行的通, 因为不同的通讯节点很难保持统一的MTU设置. 这时就需要用到segmentation offload(分片卸荷)技术. offloads本质上就是将原本需要CPU处理的部分丢给网卡来处理, 其最高可支持64KB大小的数据包, 这样可以减少网络包的数量, 降低网络中断数量, 增加网络吞吐量.
常见的offload有如下几种:
- TSO(
TCP Segmentation Offload): 开启TSO功能的网卡可以将一个大的单帧数据分割成固定大小(MTU)多个帧. TSO一般需要与网卡的checksum offload以及scatter-gather功能一起配置使用. - UFO(
UDP Fragmentation Offload): 网卡可以将一个大的UDP报文分割成固定MTU大小的数据包; UFO目前已经废弃不用, 大部分内核不再支持. - GSO(
Generic Segmentation Offload): GSO可以看作是TSO的补充, 当网卡无法支持TSO/UFO时, GSO可以确保数据包进入驱动处理时按照MTU的大小进行分片处理, 从而避免数据包无法发送的情况. GSO一般要与GRO(Generic Receive Offload)一起使用. - LRO(
Large Receive Offload): 在数据包进入协议栈之前进行重新组合成一个更大的报文, 以减少数据包的数量, 降低CPU负载. LRO通常会忽略数据包头中的差异以及其他存在的错误. 通常来说, LRO无法与内核中的IP转发(IP Forwarding)功能一起使用, 因此在开启LRO时需要关闭IP转发功能. - GRO(
Generic Receive Offload): 与LRO类似, 不过在合成包时会对每个数据包进行更严格的检查, 比如会检查数据包的MAC头; 查看TCP的时间戳. GRO可以通过软件或者在网卡中实现.
‘eth0’ 是网络接口卡的设备名称。指定 Spread 通信使用的网络接口卡的设备名称。
$ /sbin/ethtool -k eth0
Features for eth0:
rx-checksumming: on
tx-checksumming: on
tx-checksum-ipv4: off
tx-checksum-unneeded: off
tx-checksum-ip-generic: on
tx-checksum-ipv6: off
tx-checksum-fcoe-crc: off [fixed]
tx-checksum-sctp: off [fixed]
scatter-gather: on
tx-scatter-gather: on
tx-scatter-gather-fraglist: off [fixed]
tcp-segmentation-offload: on
tx-tcp-segmentation: on
tx-tcp-ecn-segmentation: off
tx-tcp6-segmentation: on
udp-fragmentation-offload: off [fixed]
generic-segmentation-offload: on
generic-receive-offload: on
large-receive-offload: on
rx-vlan-offload: on
tx-vlan-offload: on
ntuple-filters: off
receive-hashing: on
highdma: on [fixed]
rx-vlan-filter: on [fixed]
vlan-challenged: off [fixed]
tx-lockless: off [fixed]
netns-local: off [fixed]
tx-gso-robust: off [fixed]
tx-fcoe-segmentation: off [fixed]
tx-gre-segmentation: off [fixed]
tx-udp_tnl-segmentation: off [fixed]
fcoe-mtu: off [fixed]
loopback: off [fixed]
d. 使用以下命令关闭 TCP offload功能。
例如:
$ /sbin/ethtool -K eth0 sg off tso off gso off gro off lro off rx off tx off
5.5 内存不足
高内存使用率使 Spread 交换到磁盘,从而导致节点之间的通信延迟。
a. 通过查询 DC_MEMORY_INFO 系统表检查系统的内存使用情况。
先前运行的脚本还收集了以下内存使用信息。
=======================================================
e. Memory Starvation
=======================================================
e-1. Memory usage from DC_MEMORY_INFO
=======================================================
    node_name     |     start_time      |      end_time       | average_memory_usage_percent
------------------+---------------------+---------------------+------------------------------
 v_trial_node0001 | 2020-08-04 05:08:59 | 2020-08-04 05:09:00 |                        43.53
 v_trial_node0002 | 2020-08-04 05:08:59 | 2020-08-04 05:09:00 |                        42.23
 v_trial_node0003 | 2020-08-04 05:08:59 | 2020-08-04 05:09:00 |                        42.42
 v_trial_node0004 | 2020-08-04 05:08:59 | 2020-08-04 05:09:00 |                         42.1
 v_trial_node0001 | 2020-08-04 05:09:00 | 2020-08-04 05:09:01 |                        43.59
 v_trial_node0002 | 2020-08-04 05:09:00 | 2020-08-04 05:09:01 |                        42.23
 v_trial_node0003 | 2020-08-04 05:09:00 | 2020-08-04 05:09:01 |                        42.48
 v_trial_node0004 | 2020-08-04 05:09:00 | 2020-08-04 05:09:01 |                        42.12
 .....
b. 通过查询 DC_ALLOCATION_POOL_STATISTICS 系统表检查目录的大小。
先前运行的脚本还收集了以下目录大小信息。
=======================================================
e-2. Catalog size
=======================================================
    node_name     |         ts          |            catalog_size_in_mb
------------------+---------------------+------------------------------------------
 v_trial_node0001 | 2020-08-04 05:45:14 | 105.914031982421875000000000000000000000
 v_trial_node0002 | 2020-08-04 05:44:57 | 134.056930541992187500000000000000000000
 v_trial_node0003 | 2020-08-04 05:45:14 | 133.696777343750000000000000000000000000
 v_trial_node0004 | 2020-08-04 05:45:14 | 134.865783691406250000000000000000000000
c. 如果目录大小大于总内存大小的 4%,请减少通用资源池内存使用量,然后重新启动集群。
例如,如果catalog大小为 5 GB,物理内存大小为 100 GB,则 general资源池95% 内存大小为 95 GB。catalog信息加载在 Vertica 内存空间之外。因此,您需要减少general资源池的 MAXMEMORYSIZE。
要减少general资源池的 MAXMEMORYSIZE,请使用以下命令:
=> SELECT name, maxmemorysize FROM v_catalog.resource_pools WHERE name = 'general';
  name   | maxmemorysize
---------+---------------
 general | Special: 95%

=> ALTER RESOURCE POOL general maxmemorysize '90%';
NOTICE 2585:  Change takes effect upon restart.  Recovering nodes will use the new value

=> SELECT name, maxmemorysize FROM v_catalog.resource_pools WHERE name = 'general';
  name   | maxmemorysize
---------+---------------
 general | Special: 90%
另一种方法是为目录创建一个新的专用资源池。不要在任何查询中使用它。
要创建专用资源池,请使用以下命令:
=> CREATE RESOURCE POOL catalog_pool memorysize '5G';
d. 减少 Vertica 进程分配内存的另一种方法是调整 glibc 内存分配。
请参阅以下页面了解调整的详细步骤。
https://forum.vertica.com/discussion/comment/243701
5.6 CPU 限制
高 CPU 使用率会导致节点之间的通信延迟。
a. 通过查询 DC_CPU_AGGREGATE 系统表检查系统的 CPU 使用率。
先前运行的脚本还收集了以下 CPU 使用率信息。
=======================================================
f. CPU Bound
=======================================================

    node_name     | processor_id |     start_time      |      end_time       | average_cpu_usage_percent
------------------+--------------+---------------------+---------------------+---------------------------
 v_trial_node0001 | aggregate    | 2020-08-04 04:30:29 | 2020-08-04 04:30:30 |    83.8400000000000000000
 v_trial_node0002 | aggregate    | 2020-08-04 04:30:29 | 2020-08-04 04:30:30 |   100.0000000000000000000
 v_trial_node0003 | aggregate    | 2020-08-04 04:30:29 | 2020-08-04 04:30:30 |   100.0000000000000000000
 v_trial_node0004 | aggregate    | 2020-08-04 04:30:29 | 2020-08-04 04:30:30 |    99.7500000000000000000
 v_trial_node0001 | aggregate    | 2020-08-04 04:30:30 | 2020-08-04 04:30:31 |    61.1700000000000000000
 v_trial_node0002 | aggregate    | 2020-08-04 04:30:30 | 2020-08-04 04:30:31 |    99.7500000000000000000
 v_trial_node0003 | aggregate    | 2020-08-04 04:30:30 | 2020-08-04 04:30:31 |   100.0000000000000000000
 v_trial_node0004 | aggregate    | 2020-08-04 04:30:30 | 2020-08-04 04:30:31 |   100.0000000000000000000
 .....
b. 如果 CPU 使用率很高,请为spread分配一个core。
要检查 CPU 核心的数量,请使用以下命令:
$ grep processor /proc/cpuinfo
processor       : 0
processor       : 1
processor       : 2
processor       : 3
准备 2 个配置文件,内容如下。除了分配给 spread 的单个核心外,将所有 CPU 核心指定为 CPU_Vertica_Group 的 cpuset.cpus 值。
/etc/cgconfig.conf
group CPU_Vertica_Group {
cpuset {
cpuset.mems="0";
cpuset.cpus="0-2";
}
}
group CPU_Spread_Group {
cpuset {
cpuset.mems="0";
cpuset.cpus="3";
}
}
/etc/cgrules.conf
dbadmin:/opt/vertica/bin/vertica        cpuset  CPU_Vertica_Group
dbadmin:/opt/vertica/spread/sbin/spread cpuset  CPU_Spread_Group
在所有节点上安装 cgroup(控制组)包并启动相关服务。
例如,在 RHEL/CentOS 6 的情况下:
$ yum install libcgroup
$ chkconfig cgconfig on
$ chkconfig cgred on
$ service cgconfig start
$ service cgred start
在 RHEL/CentOS 7 的情况下:
$ yum install libcgroup libcgroup-tools
$ systemctl start cgconfig
$ systemctl start cgred
$ systemctl enable cgconfig
$ systemctl enable cgred
在 RHEL/CentOS 8的情况下:
$ dnf install gcc byacc flex pam-devel redhat-lsb-core

$ wget https://github.com/libcgroup/libcgroup/releases/download/v2.0/libcgroup-2.0.tar.gz
$ tar zxvf libcgroup-2.0.tar.gz
$ cd libcgroup-2.0/
$ ./configure --enable-initscript-install
$ make
$ make install

$ mkdir /etc/cgconfig.d

$ cp /usr/local/etc/rc.d/init.d/cgconfig /etc/rc.d/init.d/
$ cp /usr/local/etc/rc.d/init.d/cgred /etc/rc.d/init.d/
在执行 configure 命令期间,libcgroup-2.0 和 2.0.1 中会出现以下错误。如果 configure 命令成功完成,则可以忽略此错误。
libcgroup-2.0
$ ./configure --enable-initscript-install
.....
checking whether to build static libraries... yes
./configure: line 12526: with_bindings: command not found
checking for g++... g++
libcgroup-2.0.1
$ ./configure --enable-initscript-install
.....
checking whether to build static libraries... yes
./configure: line 12510: with_bindings: command not found
checking for g++... g++
如果您不想忽略它,请添加–enable-bindings 选项。
$ ./configure --enable-initscript-install --enable-bindings
此选项启用 Python 绑定功能。它可能没有任何影响。
此外,对于 RHEL/CentOS 8,请修改以下文件:
[/etc/rc.d/init.d/cgred]
# Should-Start:     --(modify to)--> # Default-Start:      2 3 4 5
# Should-Stop:      --(modify to)--> # Default-Stop:       0 1 6

[/etc/rc.d/init.d/cgconfig]
# Should-Start:     --(modify to)--> # Default-Start:      2 3 4 5
# Should-Stop:      --(modify to)--> # Default-Stop:       0 1 6
然后,通过运行以下命令启动服务:
$ systemctl enable cgconfig.service
$ systemctl start cgconfig.service
$ systemctl enable cgred.service
$ systemctl start cgred.service
对于 Ubuntu 16.04 LTS:
$ apt install cgroup-bin cgroup-lite cgroup-tools cgroupfs-mount libcgroup1
$ cp /usr/share/doc/cgroup-tools/examples/cgred.conf /etc/
$ cp /usr/share/doc/cgroup-tools/examples/cgsnapshot_blacklist.conf /etc/
$ cp /usr/share/doc/cgroup-tools/examples/cgconfig /etc/init.d/
$ cp /usr/share/doc/cgroup-tools/examples/cgred /etc/init.d/
$ chmod 755 /etc/init.d/cgconfig
$ chmod 755 /etc/init.d/cgred
另外,在Ubuntu 16.04 LTS中,修改以下文件:
[/etc/init.d/cgred]
# Should-Start:     --(modify to)--> # Default-Start:      2 3 4 5
# Should-Stop:      --(modify to)--> # Default-Stop:       0 1 6

. /etc/rc.d/init.d/functions (remove this line)

daemon --check $servicename --pidfile $pidfile $CGRED_BIN $OPTIONS     --(modify to)--> start_daemon -p $pidfile $CGRED_BIN $OPTIONS

[/etc/init.d/cgconfig]
# Should-Start:     --(modify to)--> # Default-Start:      2 3 4 5
# Should-Stop:      --(modify to)--> # Default-Stop:       0 1 6
然后,通过以下命令启动服务:
$ systemctl start cgroupfs-mount.service
$ systemctl start cgconfig.service
$ systemctl start cgred.service
$ systemctl enable cgroupfs-mount.service
$ systemctl enable cgconfig.service
$ systemctl enable cgred.service
5.7 Spread 日志
如果仍然遇到 Spread 问题,则需要启用 Spread Logging 并查看是否出现任何消息以了解潜在原因。
要启用扩展日志记录,请运行以下查询:
=> SELECT set_spread_options('/opt/vertica/log/spread.log', 'MEMBERSHIP PRINT CONFIGURATION GROUPS SESSION PROTOCOL EXIT', 'ExitOnIdle = yes');
=> SELECT reload_spread(true);
set_spread_options 的第一个参数是日志文件名。请注意,此日志文件的大小会立即增加,并可能导致性能下降。
第二个参数是调试标志列表。可用的调试标志如下。
| Flag | Function |
|---|---|
| General info that should always be printed. 应始终打印的一般信息。 |
|
| EXIT | Errors or other events that cause Spread to quit. 导致 Spread 退出的错误或其他事件。 |
| DEBUG | Debugging information. 调试信息。 |
| DATA_LINK | Lowest level of sending and receiving datagrams. 发送和接收数据报的最低级别. |
| NETWORK | Packing messages and setting who to talk with. 打包消息并设置与谁交互。 |
| PROTOCOL | Ordering, Token handling, and delivery algorithms. 排序、令牌处理和传递算法。 |
| SESSION | Per user connection management. 每个用户的连接管理。 |
| CONFIGURATION | Parsing and loading configuration file. 解析和加载配置文件。 |
| MEMBERSHIP | State and messages sent during membership changes. 成员资格更改期间发送的状态和消息。 |
| FLOW_CONTROL | Flow control state of the ring. 环的流控制状态。 |
| STATUS | Reporting of status information to the monitor. 向监视器报告状态信息。 |
| EVENTS | All events (timed, fd based) and main loop. 所有事件(定时、基于 fd)和主循环。 |
| GROUPS | Group state and group membership changes. 组状态和组成员资格更改。 |
| MEMORY | Memory debugging and allocation. 内存调试和分配。 |
| SKIPLIST | State of data structure. 数据结构的状态。 |
| ALL | Enables all flags. 启用所有标志。 |
| NONE | Disables all flags. 禁用所有标志。 |
第三个参数是额外配置。请勿更改它。
要禁用 Spread Logging,请运行以下查询:
=> SELECT set_spread_options('/dev/null', 'PRINT EXIT', 'ExitOnIdle = yes');
=> SELECT reload_spread(true);
5.7.1 案例
本节以以下 3 节点集群为示例:
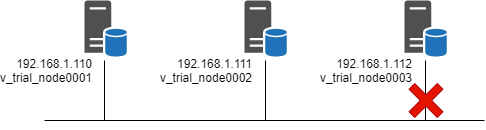
当节点 3 与网络断开连接时,您可以在每个节点上的 vertica.log 文件中看到以下消息。
vertica.log on node#1 and node#2
Spread Service InOrder Queue:0x7fb7f05bc700 [Comms] <INFO> NETWORK change with 1 VS sets
Spread Service InOrder Queue:0x7fb7f05bc700 [Comms] <INFO> VS set #0 (mine) has 2 members (offset=24)
Spread Service InOrder Queue:0x7fb7f05bc700 [Comms] <INFO> VS set #0, member 0: #node_a#N192168001110
Spread Service InOrder Queue:0x7fb7f05bc700 [Comms] <INFO> VS set #0, member 1: #node_b#N192168001111
Spread Service InOrder Queue:0x7fb7f05bc700 [Comms] <INFO> DB Group changed
vertica.log on node#3
Poll dispatch:0x7fcc6cd23700 [Comms] <WARNING> Failed to send spmonitor request: Network is unreachable
Spread Mailbox Dequeue:0x7fcc167fd700 [Comms] <WARNING> error SP_receive: Connection closed by spread
Spread Mailbox Dequeue:0x7fcc167fd700 [Comms] <WARNING> error SP_receive: The network socket experienced an error. This Spread mailbox will no longer work until the connection is disconnected and then reconnected
Spread Mailbox Dequeue:0x7fcc167fd700 [Comms] <INFO> stop: disconnecting #node_c#N192168001112 from spread daemon, Mbox=9
Spread Mailbox Dequeue:0x7fcc167fd700 [Comms] <INFO> connected: false
Spread Mailbox Dequeue:0x7fcc167fd700 [Comms] <INFO> DB Group changed
Spread Mailbox Dequeue:0x7fcc167fd700 [Comms] <INFO> Change in vDBgroupState clerk: was #node_a#N192168001110, now [none] (not me)
Spread Mailbox Dequeue:0x7fcc167fd700 [VMPI] <INFO> DistCall: Set current group members called with 0 members
Spread Mailbox Dequeue:0x7fcc167fd700 [VMPI] <INFO> Ending session v_trial_node0001-18304:0x3d due to loss of 45035996273704978
Spread Mailbox Dequeue:0x7fcc167fd700 [Comms] <INFO> nodeSetNotifier: node v_trial_node0001 left the cluster
Spread Mailbox Dequeue:0x7fcc167fd700 [Recover] <INFO> Running hooks after detecting a node loss
Spread Mailbox Dequeue:0x7fcc167fd700 [Session] <INFO> Resetting load balance cache. Internal version reset? [no]
Spread Mailbox Dequeue:0x7fcc167fd700 [Session] <INFO> Invalidating Load Balance Cache. Resetting internal version? no
Spread Mailbox Dequeue:0x7fcc167fd700 [Recover] <INFO> Node left cluster, reassessing k-safety...
Spread Mailbox Dequeue:0x7fcc167fd700 [Recover] <INFO> Setting node v_trial_node0003 to UNSAFE
Spread Mailbox Dequeue:0x7fcc167fd700 [Comms] <INFO> Node v_trial_node0001 erased from nodeToState map
Spread Mailbox Dequeue:0x7fcc167fd700 <LOG> @v_trial_node0003: 00000/3298: Event Posted: Event Code:6 Event Id:5 Event Severity: Informational [6] PostedTimestamp: 2020-08-31 10:41:47.188686 ExpirationTimestamp: 2088-09-18 13:55:54.188686 EventCodeDescription: Node State Change ProblemDescription: Changing node v_trial_node0003 startup state to UNSAFE DatabaseName: trial Hostname: vertica03c8.corp.vertica.local
Spread Mailbox Dequeue:0x7fcc167fd700 <LOG> @v_trial_node0003: 00000/3293: Event Cleared: Event Code:6 Event Id:6 Event Severity: Informational [6] PostedTimestamp: 2020-08-31 10:41:47.188734 ExpirationTimestamp: 2020-08-31 10:41:47.188734 EventCodeDescription: Node State Change ProblemDescription: Changing node v_trial_node0003 leaving startup state UP DatabaseName: trial Hostname: vertica03c8.corp.vertica.local
Spread Mailbox Dequeue:0x7fcc167fd700 [Recover] <INFO> Changing node v_trial_node0003 startup state from UP to UNSAFE
Spread Mailbox Dequeue:0x7fcc167fd700 <LOG> @v_trial_node0003: 00000/3298: Event Posted: Event Code:2 Event Id:0 Event Severity: Emergency [0] PostedTimestamp: 2020-08-31 10:41:47.188765 ExpirationTimestamp: 2020-08-31 10:51:47.188765 EventCodeDescription: Loss Of K Safety ProblemDescription: System is not K-safe: K=1 total number of nodes=3 DatabaseName: trial Hostname: vertica03c8.corp.vertica.local
Spread Mailbox Dequeue:0x7fcc167fd700 [Comms] <INFO> nodeSetNotifier: node v_trial_node0002 left the cluster
Spread Mailbox Dequeue:0x7fcc167fd700 [Recover] <INFO> Running hooks after detecting a node loss
Spread Mailbox Dequeue:0x7fcc167fd700 [Session] <INFO> Resetting load balance cache. Internal version reset? [no]
Spread Mailbox Dequeue:0x7fcc167fd700 [Session] <INFO> Invalidating Load Balance Cache. Resetting internal version? no
Spread Mailbox Dequeue:0x7fcc167fd700 [Recover] <INFO> Node left cluster, reassessing k-safety...
Spread Mailbox Dequeue:0x7fcc167fd700 [Comms] <INFO> Node v_trial_node0002 erased from nodeToState map
Spread Mailbox Dequeue:0x7fcc167fd700 [Comms] <INFO> nodeSetNotifier: node v_trial_node0003 left the cluster
Spread Mailbox Dequeue:0x7fcc167fd700 [Recover] <INFO> Running hooks after detecting a node loss
Spread Mailbox Dequeue:0x7fcc167fd700 [Recover] <INFO> Node left cluster, reassessing k-safety...
Spread Mailbox Dequeue:0x7fcc167fd700 [Comms] <INFO> Node v_trial_node0003 erased from nodeToState map
Spread Mailbox Dequeue:0x7fcc167fd700 [Comms] <INFO> NodeHeartbeatManager: SP_stop_monitoring invoked
Spread Mailbox Dequeue:0x7fcc167fd700 [Comms] <WARNING> NodeHeartbeatManager: SP_stop_monitoring failed with return code -18
Spread Mailbox Dequeue:0x7fcc167fd700 [Comms] <INFO> NodeHeartbeatManager: Notifying the thread waiting on health_check message before disabling HeartbeatGenerator service
Spread Mailbox Dequeue:0x7fcc167fd700 [Comms] <INFO> Lost membership of the DB group
Spread Mailbox Dequeue:0x7fcc167fd700 [Comms] <INFO> Removing #node_a#N192168001110->v_trial_node0001 from processToNode and other maps due to departure from Vertica:all
Spread Mailbox Dequeue:0x7fcc167fd700 [Comms] <INFO> nodeToState map:
Spread Mailbox Dequeue:0x7fcc167fd700 [Comms] <INFO> Removing #node_b#N192168001111->v_trial_node0002 from processToNode and other maps due to departure from Vertica:all
Spread Mailbox Dequeue:0x7fcc167fd700 [Comms] <INFO> nodeToState map:
Spread Mailbox Dequeue:0x7fcc167fd700 [Comms] <INFO> Removing #node_c#N192168001112->v_trial_node0003 from processToNode and other maps due to departure from Vertica:all
Spread Mailbox Dequeue:0x7fcc167fd700 [Comms] <INFO> nodeToState map:
Spread Mailbox Dequeue:0x7fcc167fd700 [Comms] <INFO> Lost membership of V:All
Spread Mailbox Dequeue:0x7fcc167fd700 [Dist] <INFO> TS: cluster (V:all) changed
Spread Mailbox Dequeue:0x7fcc167fd700 [Comms] <WARNING> VSpread disconnected: lost connection to daemon /opt/vertica/spread/tmp/4803
Spread Mailbox Dequeue:0x7fcc167fd700 [Comms] <INFO> Spread dequeue thread exiting
SafetyShutdown:0x7fcbfdfff700 [Shutdown] <INFO> Shutting down this node
在spread.log文件中,您可以在每个节点上看到以下消息:
spread.log on node#1
Prot_token_hurry: retransmiting token 6 1
Prot_token_hurry: retransmiting token 6 2
Prot_token_hurry: retransmiting token 6 3
Prot_token_hurry: retransmiting token 6 4
Prot_token_hurry: retransmiting token 6 5
Prot_token_hurry: retransmiting token 6 6
Prot_token_hurry: retransmiting token 6 7
Prot_token_hurry: retransmiting token 6 8
Prot_token_hurry: retransmiting token 6 9
Prot_token_hurry: retransmiting token 6 10
Prot_token_hurry: retransmiting token 6 11
Prot_token_hurry: retransmiting token 6 12
Prot_token_hurry: retransmiting token 6 13
Prot_token_hurry: retransmiting token 6 14
Prot_token_hurry: retransmiting token 6 15
Prot_token_hurry: retransmiting token 6 0
Prot_token_hurry: retransmiting token 6 1
Prot_token_hurry: retransmiting token 6 2
Prot_token_hurry: retransmiting token 6 3
Prot_token_hurry: retransmiting token 6 4
Prot_token_hurry: retransmiting token 6 5
Prot_token_hurry: retransmiting token 6 6
Prot_token_hurry: retransmiting token 6 7
Sess_disable_heartbeats: explict = 1, thresh = 0, heartbeats_on = 1
Sess_disable_heartbeats: disabling heartbeat monitoring on 'node_a' ( mailbox 9 ).
Memb_token_loss: ############### I lost my token, state was 1
Scast_alive: State is 2
Send_join: State is 4
Memb_handle_message: handling join message from 192.168.1.111 (1862379712), State is 4
Sess_read: received a heartbeat on 'node_a' ( mailbox 9 )
Pushed eviction timeout back 600.000000s
Create_form1: putting Aru = 11614 and Highest_Seq = 11614 on rg_info form1 token
Create_form1: SENT following token:
=========== Form Token ==========
FORM 1 Token, sent by 192.168.1.110 (1845602496). Seq: 14947
Configuration hash: 536829647 (local hash 536829647)
ProcID: 192.168.1.110 (1845602496)	 ARU: 0
ARU LastID: unknown (0)
FlowControl: 0	RTR Len: 45
Form Token members list -- Active (1) Pending (0)
0: 192.168.1.110 (1845602496)
Pending Members:
Form Token reps list -- Count (2) index (1)
0: 192.168.1.110 (1845602496) (T 1 SegInd 0) 	1: 192.168.1.111 (1862379712) (T 1 SegInd 1)
Form Token RING list -- Count (1)
Ring 0: MembID 192.168.1.110 (1845602496) - 1598592925	TransTime 0
ARU: 11614	HighSeq: 11614	NumHoles: 0
NumCommit: 1	NumTrans: 1
Message Holes:
Trans List:	0: 192.168.1.110
Commit List:
====================================================
spread.log on node#2
Memb_token_loss: ############### I lost my token, state was 1
Scast_alive: State is 2
Memb_handle_message: handling join message from 192.168.1.110 (1845602496), State is 2
Send_join: State is 4
Memb_handle_message: handling join message from 192.168.1.110 (1845602496), State is 4
Prot_handle_token: it is a Form Token.
Memb_handle_token: handling form1 token
Handle_form1 in GATHER
Fill_form1: RECEIVED following token:
=========== Form Token ==========
FORM 1 Token, sent by 192.168.1.110 (1845602496). Seq: 14947
Configuration hash: 536829647 (local hash 536829647)
ProcID: 192.168.1.110 (1845602496)	 ARU: 0
ARU LastID: unknown (0)
FlowControl: 0	RTR Len: 45
Form Token members list -- Active (1) Pending (0)
0: 192.168.1.110 (1845602496)
Pending Members:
Form Token reps list -- Count (2) index (1)
0: 192.168.1.110 (1845602496) (T 1 SegInd 0) 	1: 192.168.1.111 (1862379712) (T 1 SegInd 1)
Form Token RING list -- Count (1)
Ring 0: MembID 192.168.1.110 (1845602496) - 1598592925	TransTime 0
ARU: 11614	HighSeq: 11614	NumHoles: 0
NumCommit: 1	NumTrans: 1
Message Holes:
Trans List:	0: 192.168.1.110
Commit List:
====================================================
spread.log on node#3
Memb_token_loss: ############### I lost my token, state was 1
Scast_alive: State is 2
Scast_alive: State is 2
Scast_alive: State is 2
Scast_alive: State is 2
Send_join: State is 4
Send_join: State is 4
Send_join: State is 4
Send_join: State is 4
Send_join: State is 4
Send_join: State is 4
Send_join: State is 4
Send_join: State is 4
Send_join: State is 4
Send_join: State is 4
Create_form1: putting Aru = 11614 and Highest_Seq = 11614 on rg_info form1 token
Create_form1: SENT following token:
=========== Form Token ==========
FORM 2 Token, sent by 192.168.1.112 (1879156928). Seq: 14947
Configuration hash: 536829647 (local hash 536829647)
ProcID: 192.168.1.112 (1879156928)	 ARU: 0
ARU LastID: unknown (0)
FlowControl: 0	RTR Len: 45
Form Token members list -- Active (0) Pending (1)
Pending Members:
0: 192.168.1.112 (1879156928)
Form Token Membership ID unknown (0) : 0
Form Token RING list -- Count (1)
Ring 0: MembID 192.168.1.110 (1845602496) - 1598592925	TransTime 0
ARU: 11614	HighSeq: 11614	NumHoles: 0
NumCommit: 1	NumTrans: 1
Message Holes:
Trans List:	0: 192.168.1.112
Commit List:
====================================================
Sess_disable_heartbeats: explict = 1, thresh = 0, heartbeats_on = 0
Sess_disable_heartbeats: disabling heartbeat monitoring on 'r9112-9' ( mailbox 9 ).
Cannot form trivial self-ring. Network is probably broken.Exit caused by Alarm!
Sess: unlinked domain socket file /opt/vertica/spread/tmp/4803; ret=0
Spread daemon exiting normally!