


1、问题现象
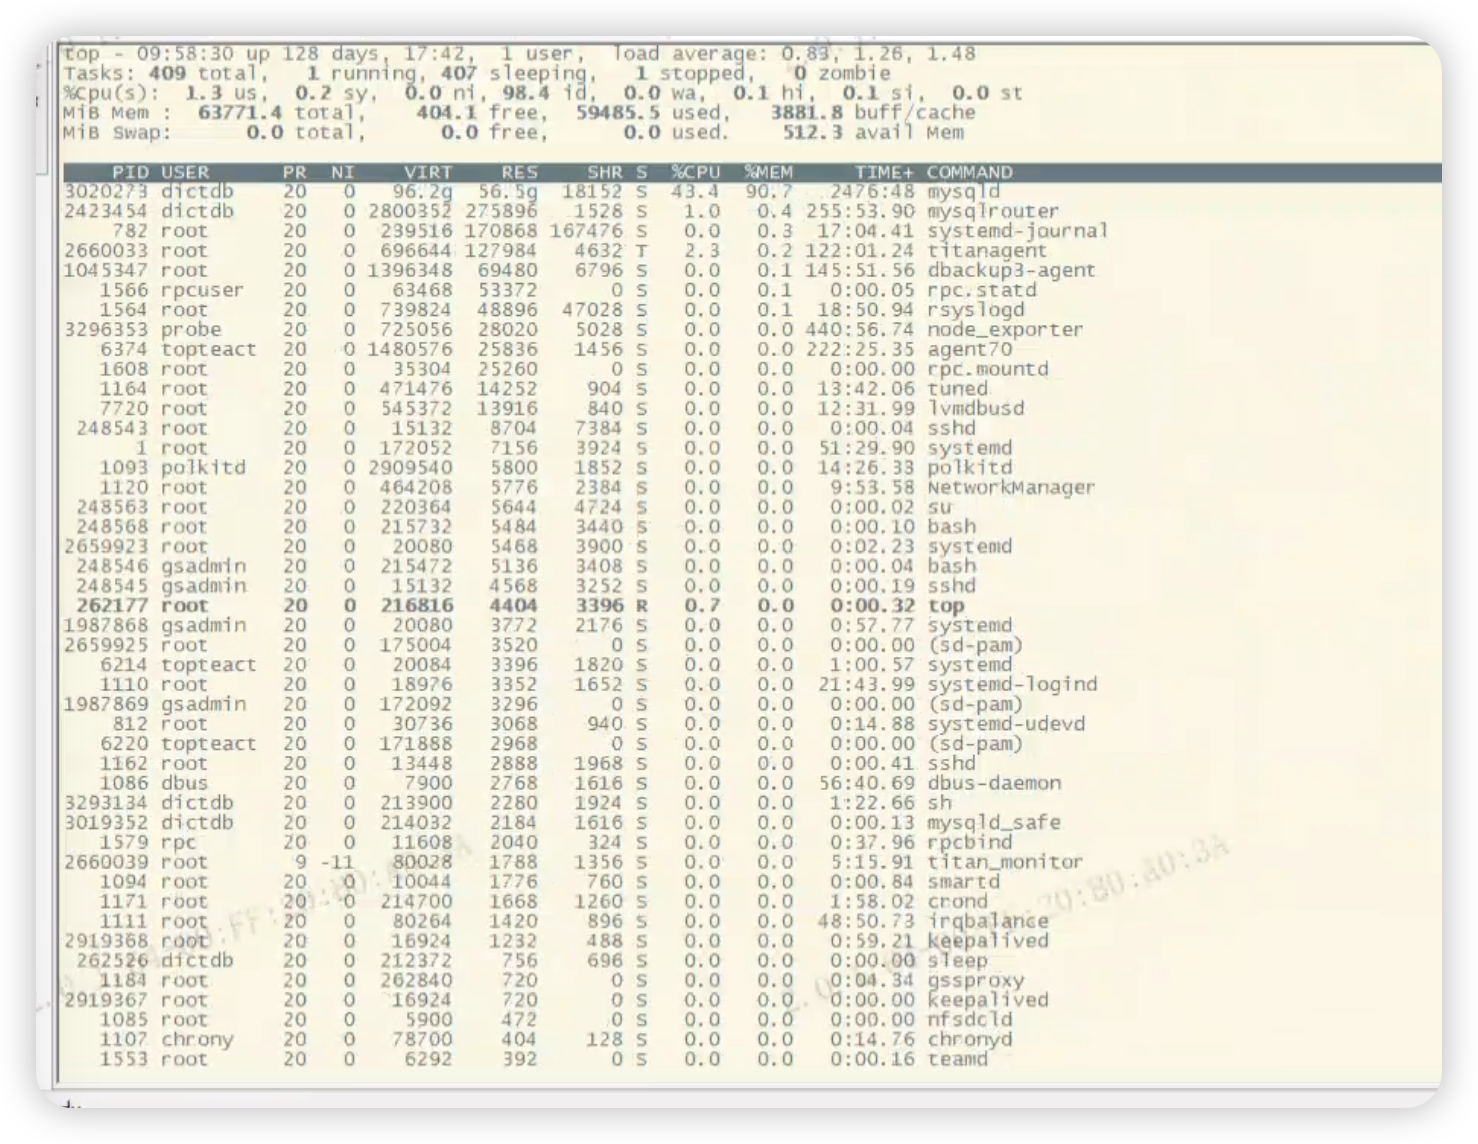
问题实例mysql进程实际内存使用率过高
2、 问题排查
2.1 参数检查
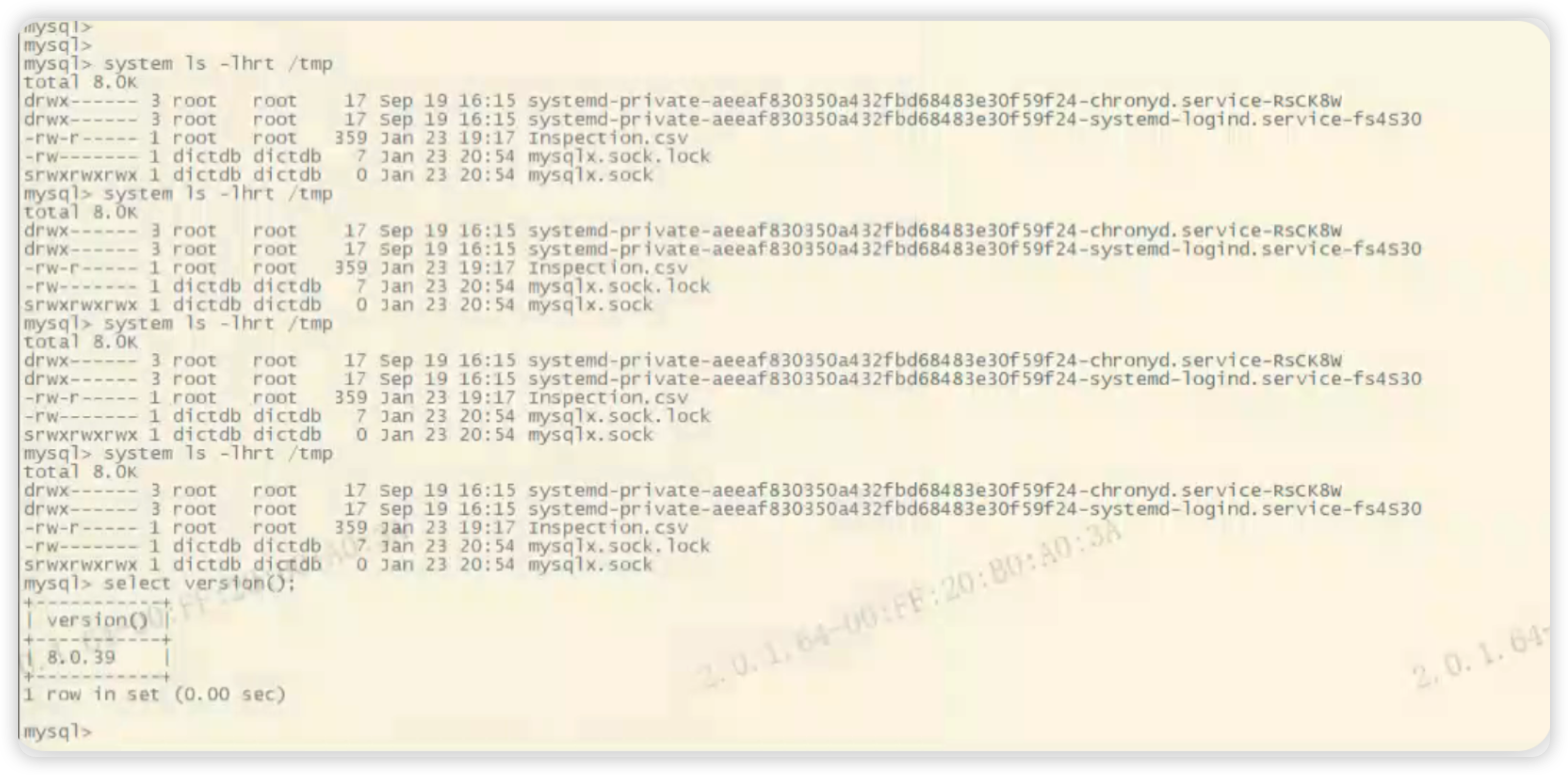
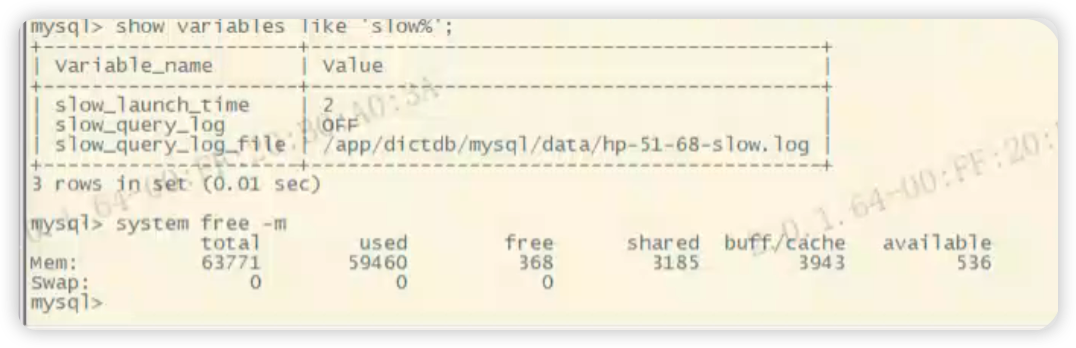
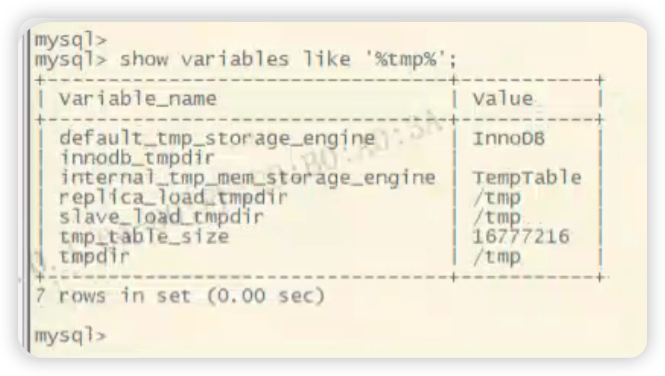
mysql版本 :8.0.39,慢日志没有开启,innodb_buffer_pool_size 12G(机器内存62G,相对配置较低),临时文件在/tmp目录下
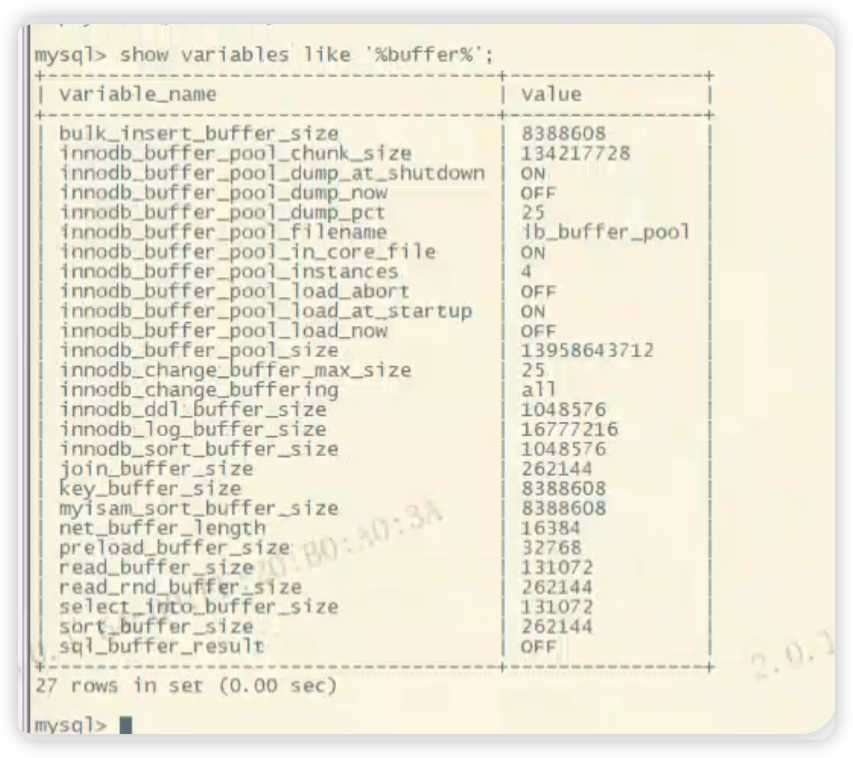
2.2 检查内存使用
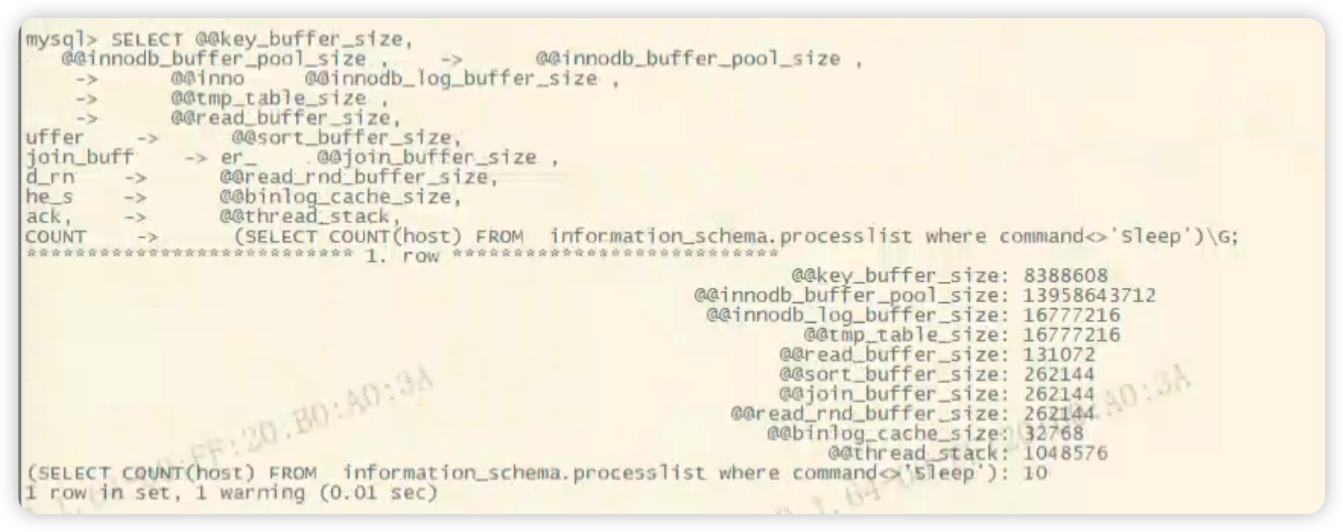
 SELECT @@key_buffer_size,
     @@innodb_buffer_pool_size ,
     @@innodb_log_buffer_size ,
     @@tmp_table_size ,
     @@read_buffer_size,
     @@sort_buffer_size,
     @@join_buffer_size ,
     @@read_rnd_buffer_size,
     @@binlog_cache_size,
     @@thread_stack,
     (SELECT COUNT(host) FROM  information_schema.processlist where command<>'Sleep')\G;
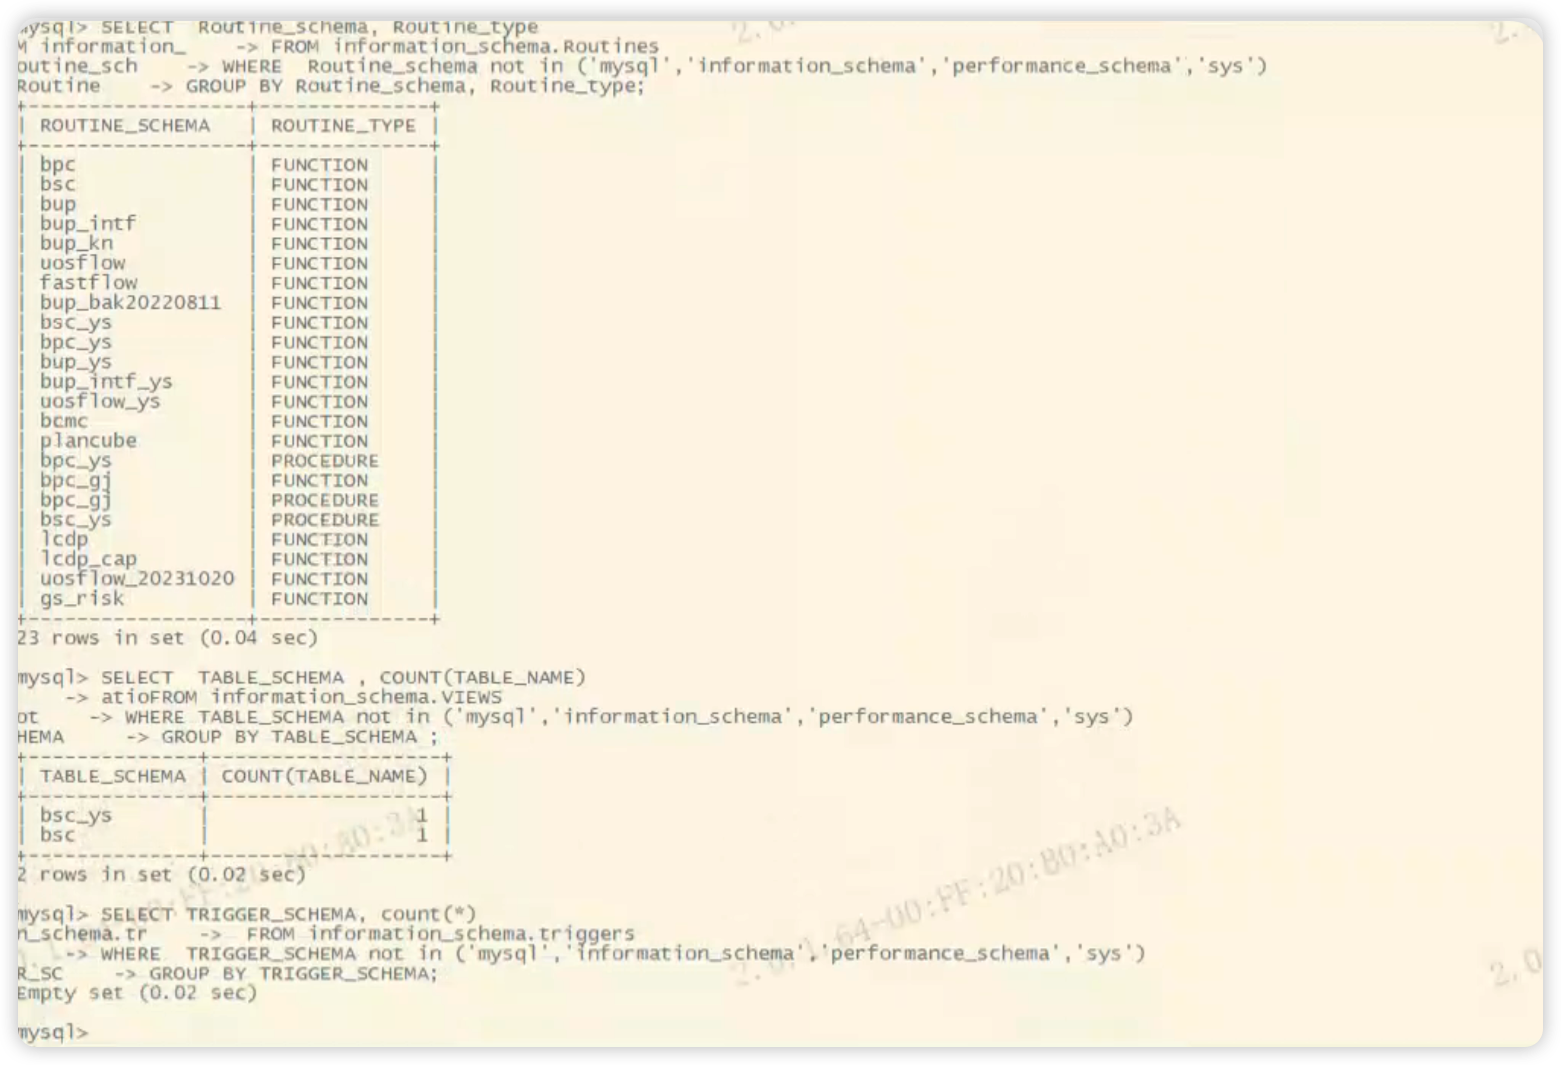
2.3 存储过程、函数、视图
-- 存储过程、函数
SELECT  Routine_schema, Routine_type
FROM information_schema.Routines
WHERE  Routine_schema not in ('mysql','information_schema','performance_schema','sys')
GROUP BY Routine_schema, Routine_type;

-- 视图
SELECT  TABLE_SCHEMA , COUNT(TABLE_NAME)
FROM information_schema.VIEWS
WHERE TABLE_SCHEMA not in ('mysql','information_schema','performance_schema','sys')
GROUP BY TABLE_SCHEMA ;

-- 触发器
SELECT TRIGGER_SCHEMA, count(*)
 FROM information_schema.triggers
WHERE  TRIGGER_SCHEMA not in ('mysql','information_schema','performance_schema','sys')
GROUP BY TRIGGER_SCHEMA;
2.4 排查实际占用
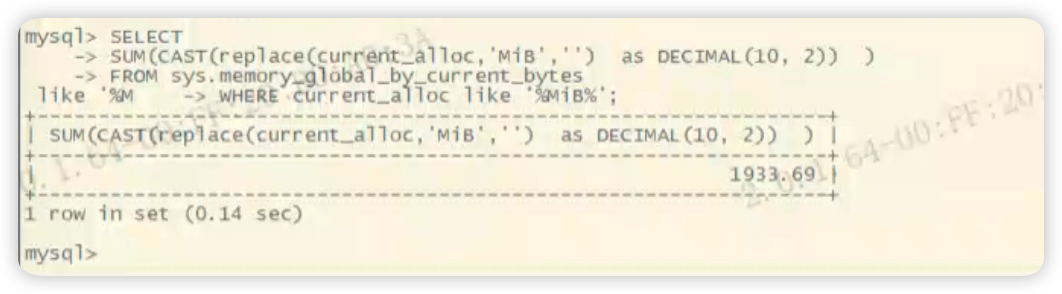
1、总内存使用
SELECT
SUM(CAST(replace(current_alloc,'MiB','')  as DECIMAL(10, 2))  )
FROM sys.memory_global_by_current_bytes
WHERE current_alloc like '%MiB%';
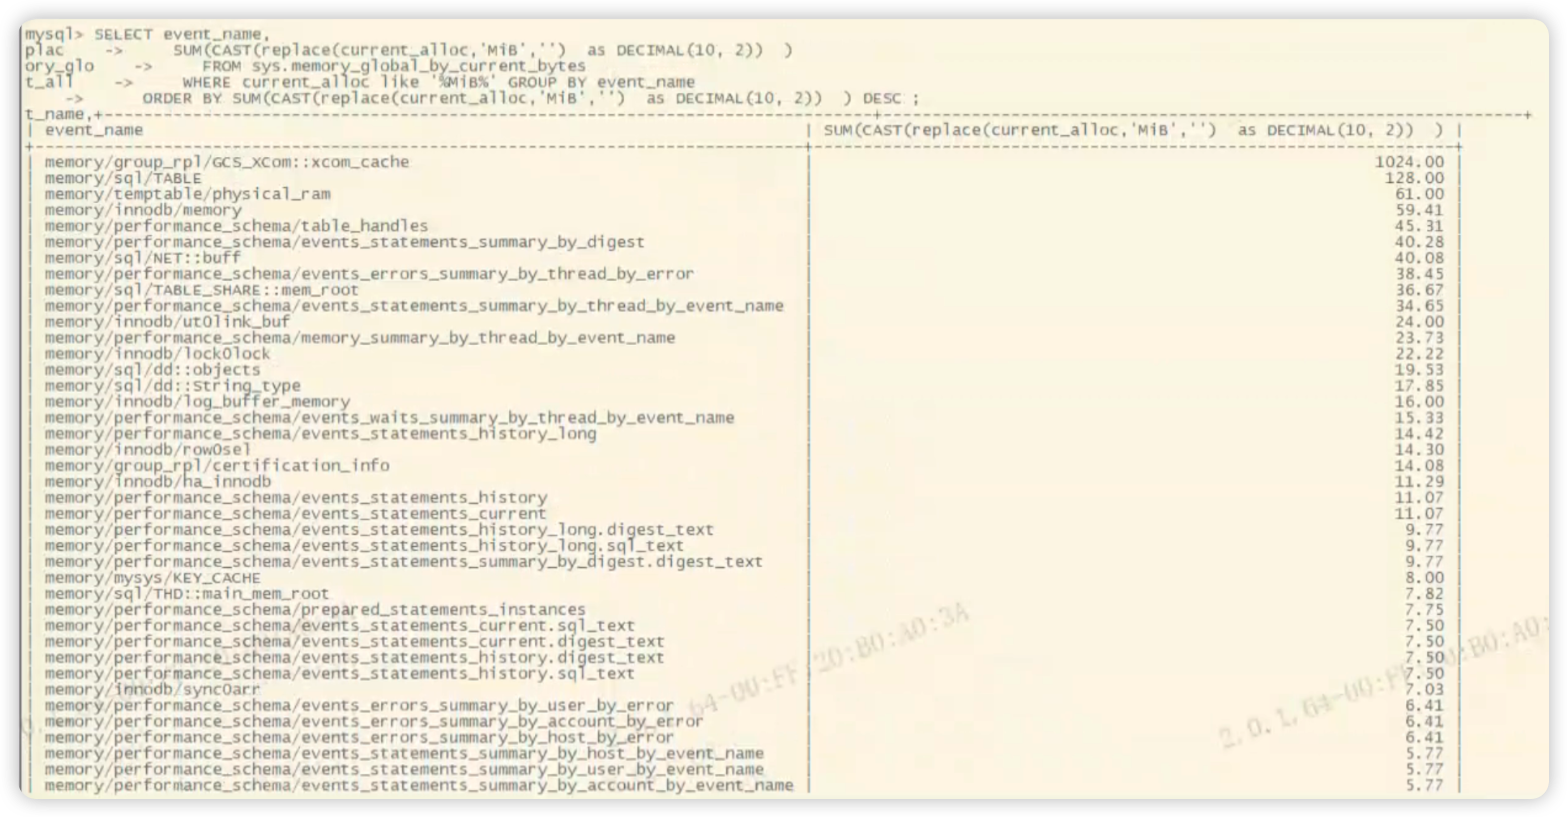
2、分事件统计内存
SELECT event_name,
SUM(CAST(replace(current_alloc,'MiB','') as DECIMAL(10, 2)) )
FROM sys.memory_global_by_current_bytes
WHERE current_alloc like '%MiB%' GROUP BY event_name
ORDER BY SUM(CAST(replace(current_alloc,'MiB','') as DECIMAL(10, 2)) ) DESC ;
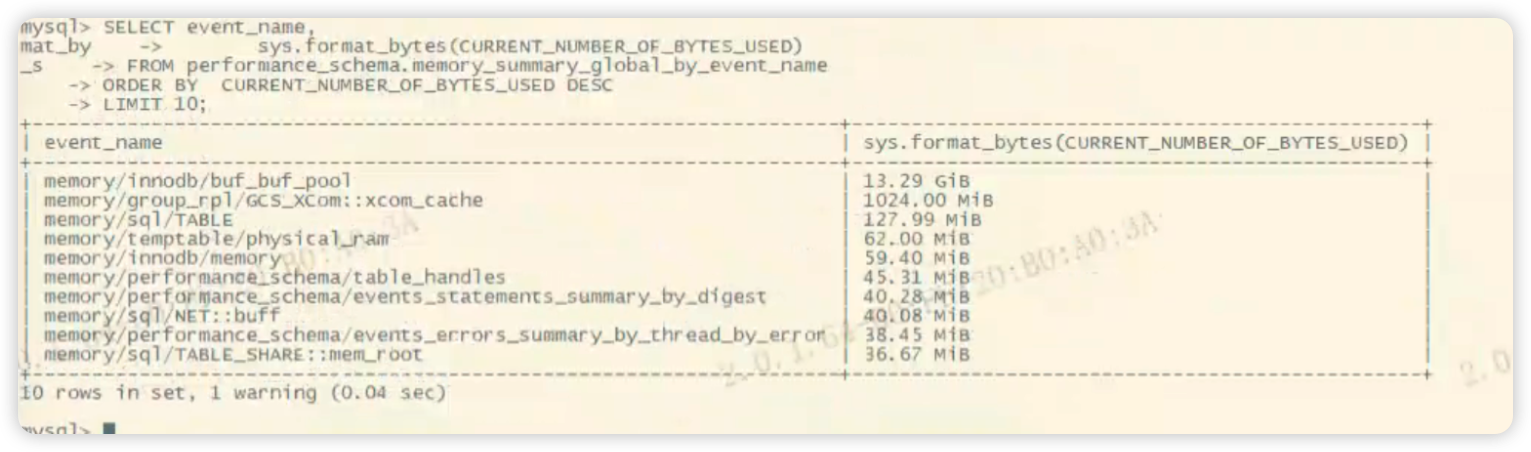
mysql> SELECT event_name,
sys.format_bytes(CURRENT_NUMBER_OF_BYTES_USED)
FROM performance_schema.memory_summary_global_by_event_name
ORDER BY CURRENT_NUMBER_OF_BYTES_USED DESC
LIMIT 10;
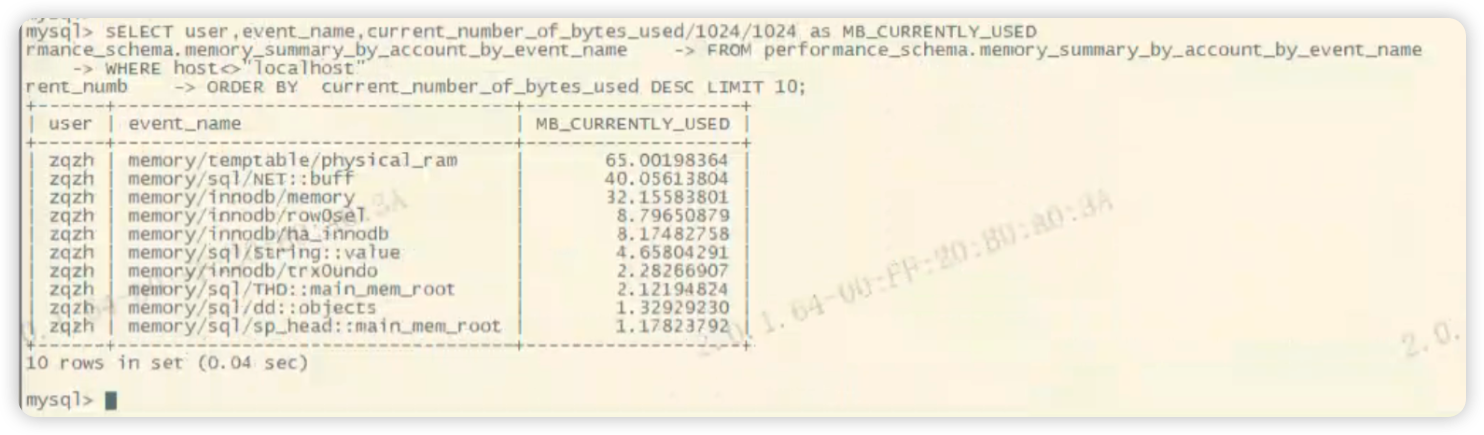
3、账号级别统计
sELECT user,event_name,current_number_of_bytes_used/1024/1024 as MB_CURRENTLY_USED
FROM performance_schema.memory_summary_by_account_by_event_name
WHERE host<>"localhost"
ORDER BY  current_number_of_bytes_used DESC LIMIT 10;
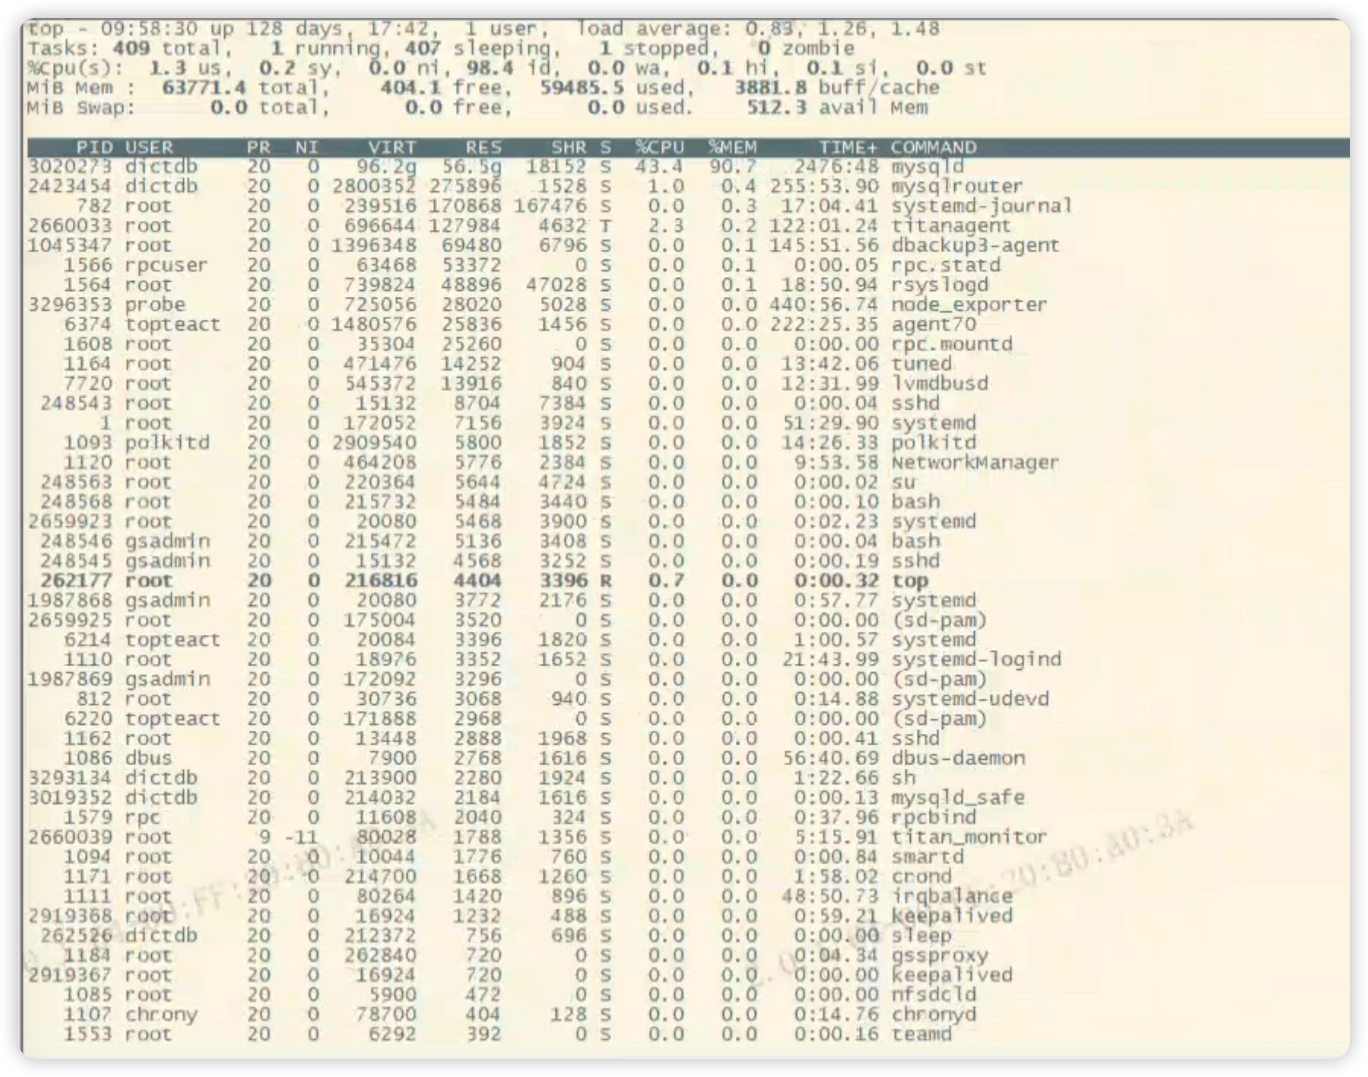
2.4 操作系统排查
1、top shift+m
2、ps命令 mysql相关进程使用内存情况
ps eo user,pid,vsz,rss $(pgrep -f 'mysqld')

3、pmap 命令
while true; do pmap -d 3020273 | tail -1; sleep 2; done
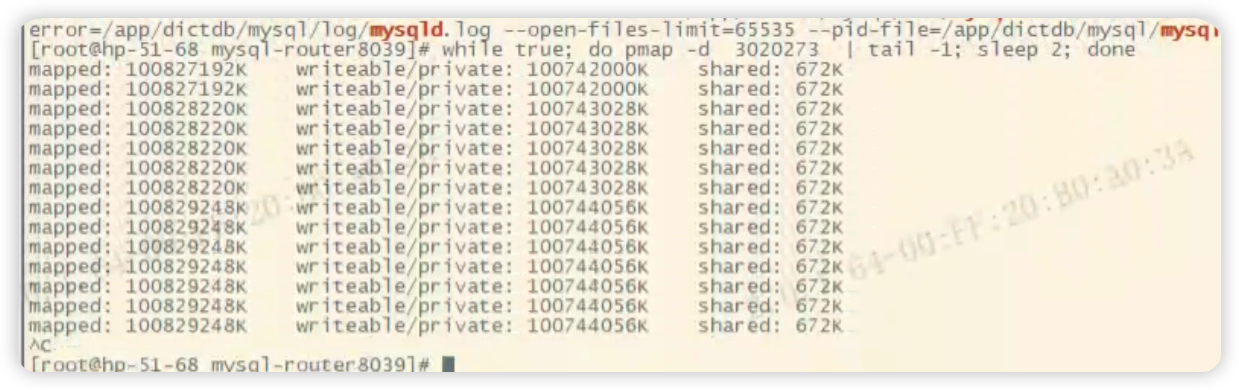
pmap -X -p 3020273 > /tmp/memmysql.txt
RSS 就是这个process 实际占用的物理内存。
Dirty: 脏页的字节数(包括共享和私有的)。
Mapping: 占用内存的文件、或[anon](分配的内存)、或[stack](堆栈)。
writeable/private 表示进程所占用的私有地址空间大小,也就是该进程实际使用的内存大小。
1.首先使用/top/free/ps在系统级确定是否有内存泄露。如有,可以从top输出确定哪一个process。
2.pmap工具是能帮助确定process是否有memory leak。确定memory leak的原则:
writeable/private (‘pmap –d’输出)如果在做重复的操作过程中一直保持稳定增长,那么一定有内存泄露。
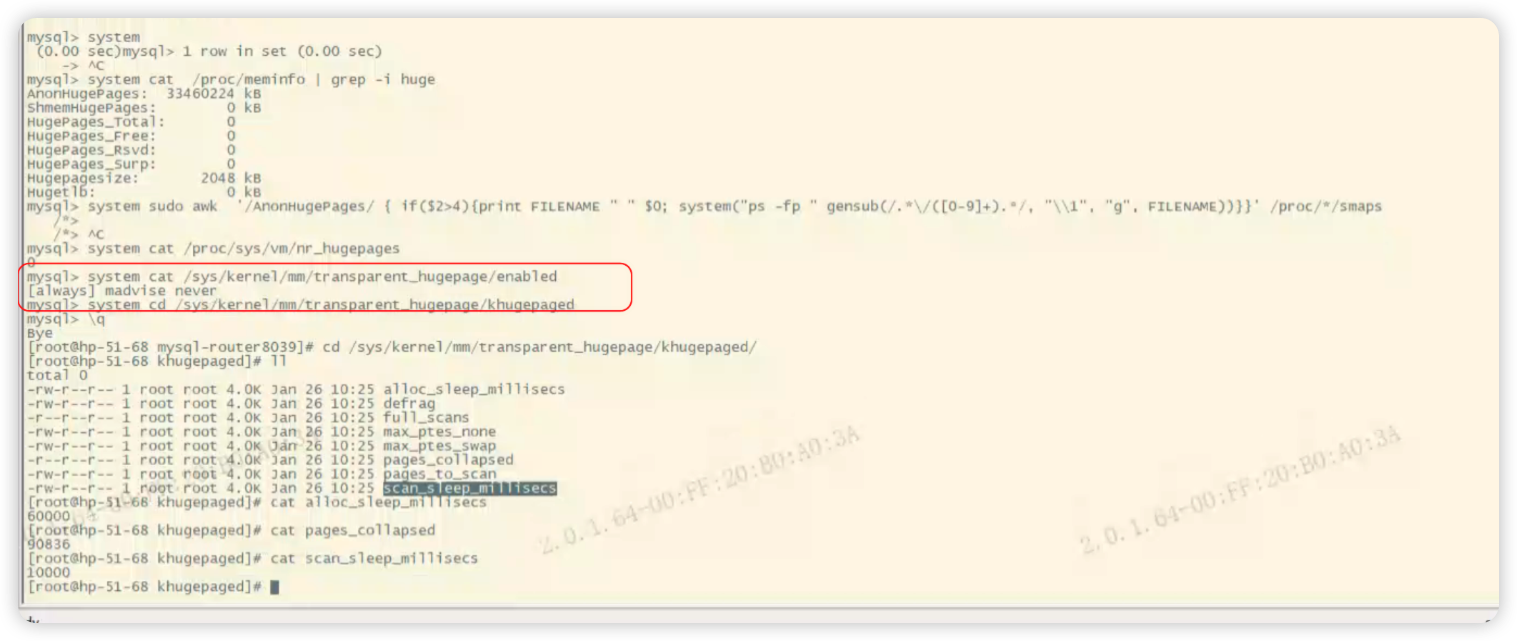
4、检查大页配置
3、 解决方案
1)临时关闭:
echo never >> /sys/kernel/mm/transparent_hugepage/enabled
echo never >> /sys/kernel/mm/transparent_hugepage/defrag
2)永久关闭,下一次重启后生效:
在 /etc/rc.local 文件中加入如下内容:
#!/bin/sh
#
# This script will be executed *after* all the other init scripts.
# You can put your own initialization stuff in here if you don't
# want to do the full Sys V style init stuff.
touch /var/lock/subsys/local
if test -f /sys/kernel/mm/transparent_hugepage/enabled; then
echo never > /sys/kernel/mm/transparent_hugepage/enabled
fi
if test -f /sys/kernel/mm/transparent_hugepage/defrag; then
echo never > /sys/kernel/mm/transparent_hugepage/defrag
「喜欢这篇文章,您的关注和赞赏是给作者最好的鼓励」
关注作者
【版权声明】本文为墨天轮用户原创内容,转载时必须标注文章的来源(墨天轮),文章链接,文章作者等基本信息,否则作者和墨天轮有权追究责任。如果您发现墨天轮中有涉嫌抄袭或者侵权的内容,欢迎发送邮件至:contact@modb.pro进行举报,并提供相关证据,一经查实,墨天轮将立刻删除相关内容。
