


背景说明
近期对本地虚拟机中部署的集中式磐维数据库做了性能测试,现在把使用benchmark做性能测试的整个过程记录下来,希望能起到抛砖引玉的作用!
数据库主机配置
| 主机名 | ip地址 | OS版本 | 内存、CPU | 节点角色 | 数据库端口 | 数据目录 |
|---|---|---|---|---|---|---|
| node1 | 192.*.*.60 | Centos7.9 | 4G 、 1个双核 | 主节点 | 17700 | /data/panweidb/data |
| node2 | 192.*.*.62 | Centos7.9 | 4G 、 1个双核 | 从节点 | 17700 | /data/panweidb/data |
| node3 | 192.*.*.64 | Centos7.9 | 4G 、 1个双核 | 从节点 | 17700 | /data/panweidb/data |
安装部署benchmarksql
下载软件包
本次测试所需要的YUM依赖或者软件包如下:
- Yum依赖包
- Benchmarksql安装包:benchmarksql-5.0.zip,下载地址:https://sourceforge.net/projects/benchmarksql/
- Ant安装包:apache-ant-1.10.15-bin.tar.gz,Ant下载地址:https://ant.apache.org/bindownload.cgi
- Htop安装包:htop-3.3.0.tar.xz,下载地址:https://github.com/htop-dev/htop/releases
- JDK包:jdk-8u431-linux-x64.tar.gz,JDK下载地址:https://www.oracle.com/java/technologies/javase/javase8u211-later-archive-downloads.html
- R语言包:R-4.4.2.tar.gz,下载地址:https://cran.r-project.org/
将以上所有需安装的安装包统一上传到/soft/目录下。
安装软件包
安装YUM源依赖包
1、配置yum源
#将iso文件上传到/soft,挂载本地iso镜像,配置yum源
mkdir /soft/centos79
mount -o loop -t iso9660 /soft/CentOS-7-x86_64-DVD-2207-02.iso /soft/centos79/
mkdir /etc/yum.repos.d/yumbak
mv /etc/yum.repos.d/*.repo /etc/yum.repos.d/yumbak
cat > /etc/yum.repos.d/centos79.repo << EOF
[base]
name = base
baseurl = file:///soft/centos79/
gpgcheck = 0
enabled = 1
EOF

yum clean all && yum makecache
2、安装依赖包

yum install gcc glibc-headers gcc-c++ gcc-gfortran readline-devel libXt-devel pcre-devel libcurl libcurl-devel -y
yum install ncurses ncurses-devel autoconf automake zlib zlib-devel bzip2 bzip2-devel xz-devel -y
yum install pango-devel pango libpng-devel cairo cairo-devel -y
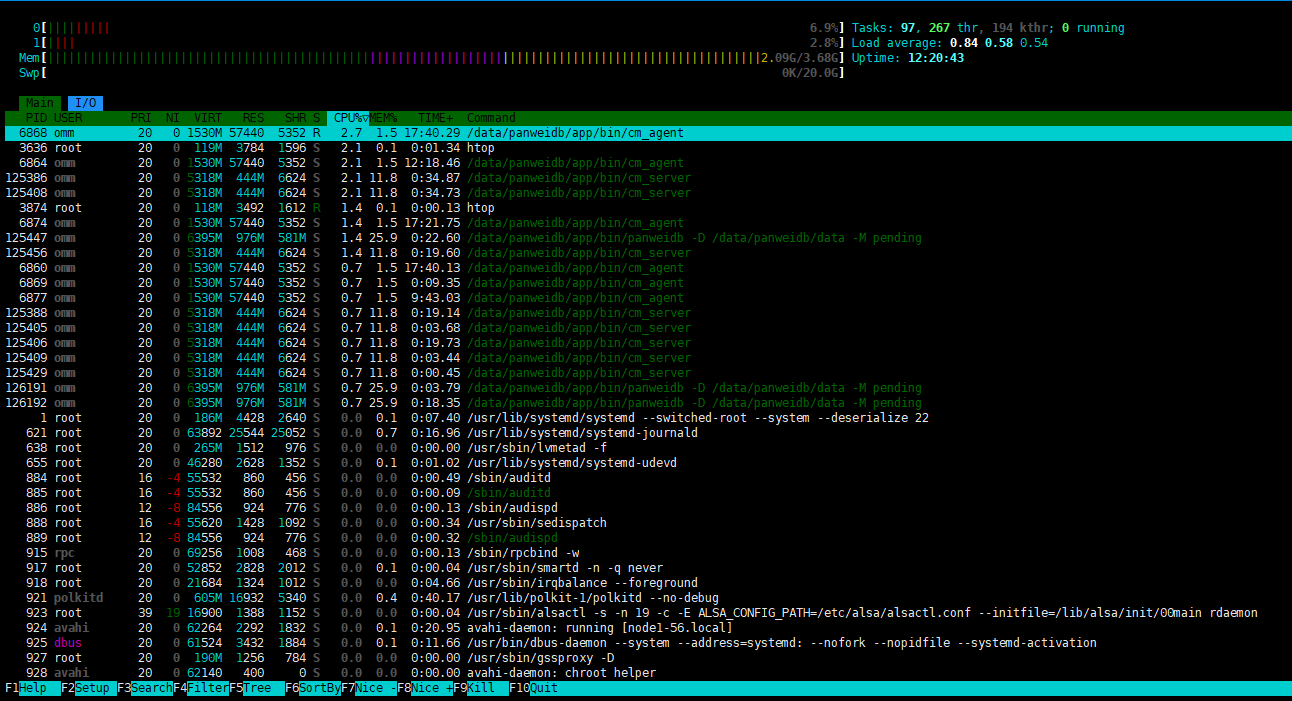
安装htop
htop主要用于实时监控系统资源的使用情况。
cd /soft
tar -xf htop-3.3.0.tar.xz
cd htop-3.3.0
./autogen.sh && ./configure && make && make install

htop
出现下面的界面说明htop已经安装成功:
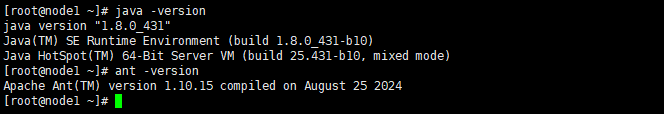
安装java和ant
ant用于编译BenchmarkSQL的Java代码。
cd /usr
tar -xf /soft/jdk-8u431-linux-x64.tar.gz
tar -xf /soft/apache-ant-1.10.15-bin.tar.gz
cat >> ~/.bash_profile << EOF
export JAVA_HOME=/usr/jdk1.8.0_431
export ANT_HOME=/usr/apache-ant-1.10.15
export PATH=/usr/jdk1.8.0_431/bin:$PATH:/usr/apache-ant-1.10.15/bin
EOF
source ~/.bash_profile

java -version
ant -version
出现下面的界面说明java和ant已经安装成功:
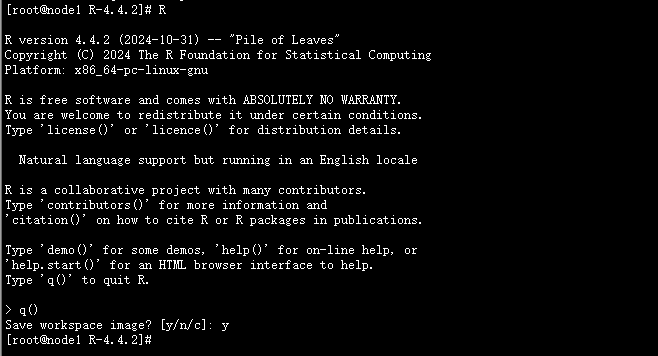
安装R语言包
R语言包在BenchmarkSQL测试中主要用于生成测试报告。
cd /soft/
tar -zxf R-4.4.2.tar.gz
cd R-4.4.2
./configure && make && make install

R
出现下面的界面说明R语言包已经安装成功:
安装benchmarksql
1、解压安装包
cd /soft
unzip benchmarksql-5.0.zip
2、替换benchmarksql解压后的postgresql-9.3-1102.jdbc41.jar文件
cd /soft/benchmarksql-5.0/lib/postgres/
#备份postgresql-9.3-1102.jdbc41.jar文件
mv postgresql-9.3-1102.jdbc41.jar postgresql-9.3-1102.jdbc41.jar.bak
# 将下载好的磐维数据库的jdbc驱动postgresql.jar,拷贝到benchmark工具相应目录下
mv postgresql.jar /soft/benchmarksql-5.0/lib/postgres/
mv  /soft/benchmarksql-5.0/lib/postgres/postgresql.jar postgresql-9.3-1102.jdbc41.jar
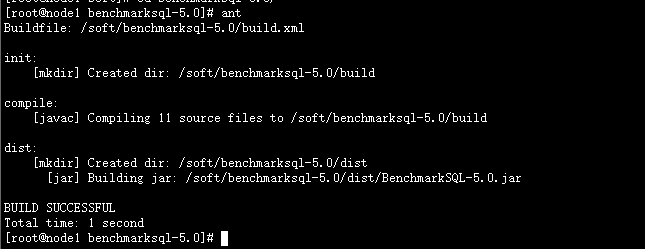
3、ant编译
cd /soft/benchmarksql-5.0
ant    ##  ant编译BenchmarkSQL的Java代码
BenchmarkSQL 压测
1、创建压测数据库及数据库账户
gsql -r
create database benchmark;
create user benchmark_user with password '******' sysadmin;
【备注】性能压测工具如sysbench和benchmarksql等,必须要求压测的用户权限具备sysadmin的权限。

gsql -d benchmark -p 17700 -U benchmark_user -W ***** -r
2、配置props.pg
cd /soft/benchmarksql-5.0/run
cp props.pg my.properties
vim my.properties
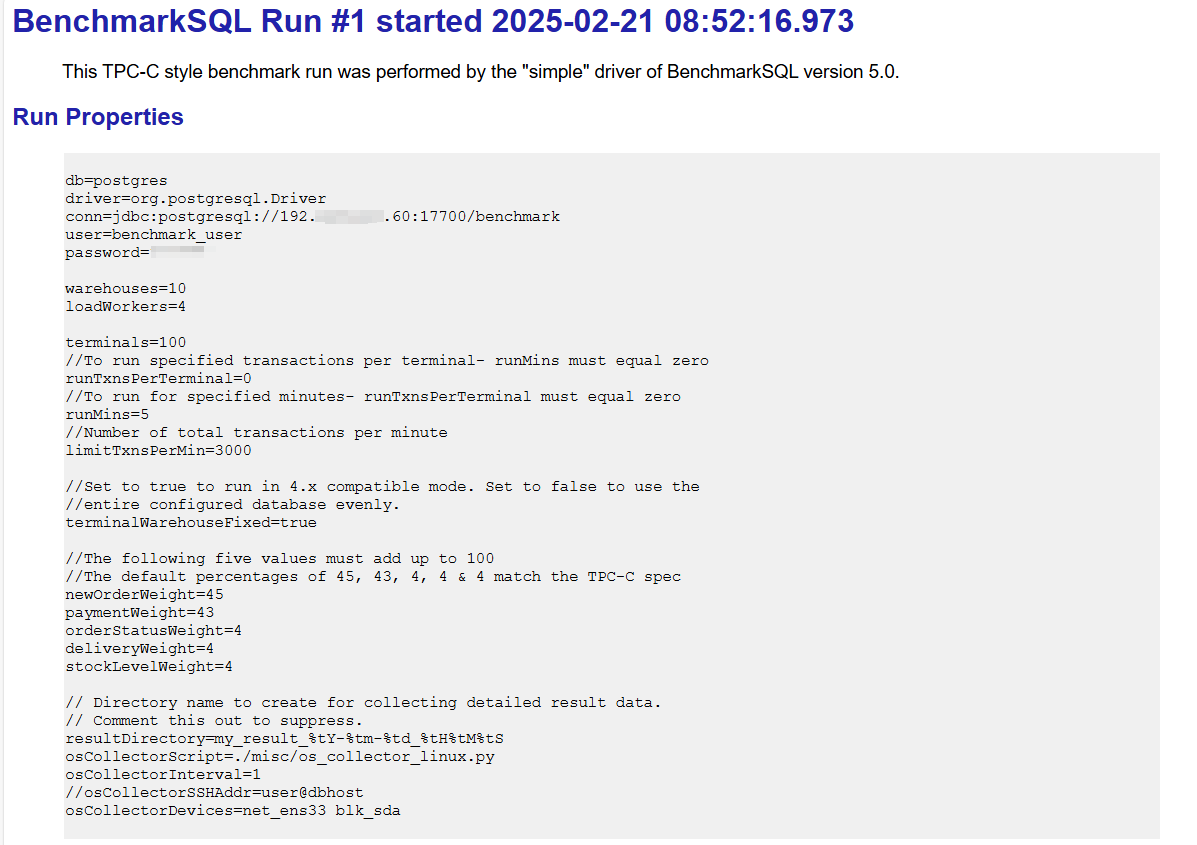
my.properties内容如下:
db=postgres
driver=org.postgresql.Driver
conn=jdbc:postgresql://192.*.*.60:17700/benchmark # 根据实际的数据库节点情况修改IP、端口号和测试库名;
user=benchmark_user # 测试账户
password=****** # 测试账户对应的密码
warehouses=10 # 数据仓库数W,1W=76823KB,仓库数根据实际需要自定义设置;
loadWorkers=4 # 数据仓库在加载数据时所启用的并发进程数,建议不超过CPU核数;
terminals=100 # 压测时并发端数量;
//To run specified transactions per terminal- runMins must equal zero
runTxnsPerTerminal=0 # 每个terminal运行的事务数量,该参数不能与runMins同时设置;
//To run for specified minutes- runTxnsPerTerminal must equal zero
runMins=5 # 实际压测运行的时间,该参数不能与runTxnsPerTerminal同时设置;
//Number of total transactions per minute
limitTxnsPerMin=3000 # 每分钟测试的事务数量;
//Set to true to run in 4.x compatible mode. Set to false to use the
//entire configured database evenly.

terminalWarehouseFixed=true # 每个terminal是否绑定固定的warehouse。设置为true可兼容benchmarksql 4.x模式运行,表示每个terminal将与固定的warehouse绑定进行压测,设置为false时表示可以均匀使用数据库整体配置进行压测。TPCC规定每个终端都必须有一个绑定的仓库,所以一般使用默认值true。

//The following five values must add up to 100
//The default percentages of 45, 43, 4, 4 & 4 match the TPC-C spec
newOrderWeight=45
paymentWeight=43
orderStatusWeight=4
deliveryWeight=4
stockLevelWeight=4

【备注】下面五个值的总和必须等于100,默认值为:45, 43, 4, 4 & 4 ,与TPC-C测试定义的比例一致,实际操作过程中,可以调整比重来适应各种场景。
// Directory name to create for collecting detailed result data.
// Comment this out to suppress.
resultDirectory=my_result_%tY-%tm-%td_%tH%tM%tS # 测试结果生成的目录,默认即可;
osCollectorScript=./misc/os_collector_linux.py # 操作系统性能信息收集的脚本
osCollectorInterval=1 # 操作系统收集间隔时间,默认为1秒;
//osCollectorSSHAddr=user@dbhost # 操作系统收集所对应的主机,如果对本机数据库进行测试,该参数保持注销即可,如果要对远程服务器进行测试,请填写用户名和主机名。
osCollectorDevices=net_eth0 blk_sda #操作系统中被收集服务器的网卡名称和磁盘名称;
3、创建测试数据
cd /soft/benchmarksql-5.0/run
./runDatabaseBuild.sh my.properties
创建测试数据后生成对应的表及数据量情况如下表:
benchmark=> \dt+
                                                          List of relations
     Schema     |       Name       | Type  |     Owner      |  Size   |                    Storage                     | Description
----------------+------------------+-------+----------------+---------+------------------------------------------------+-------------
 benchmark_user | bmsql_config     | table | benchmark_user | 40 kB   | {orientation=row,compression=no,fillfactor=80} |
 benchmark_user | bmsql_customer   | table | benchmark_user | 224 MB  | {orientation=row,compression=no,fillfactor=80} |
 benchmark_user | bmsql_district   | table | benchmark_user | 48 kB   | {orientation=row,compression=no,fillfactor=80} |
 benchmark_user | bmsql_history    | table | benchmark_user | 32 MB   | {orientation=row,compression=no,fillfactor=80} |
 benchmark_user | bmsql_item       | table | benchmark_user | 13 MB   | {orientation=row,compression=no,fillfactor=80} |
 benchmark_user | bmsql_new_order  | table | benchmark_user | 4904 kB | {orientation=row,compression=no,fillfactor=80} |
 benchmark_user | bmsql_oorder     | table | benchmark_user | 24 MB   | {orientation=row,compression=no,fillfactor=80} |
 benchmark_user | bmsql_order_line | table | benchmark_user | 360 MB  | {orientation=row,compression=no,fillfactor=80} |
 benchmark_user | bmsql_stock      | table | benchmark_user | 430 MB  | {orientation=row,compression=no,fillfactor=80} |
 benchmark_user | bmsql_warehouse  | table | benchmark_user | 40 kB   | {orientation=row,compression=no,fillfactor=80} |
(10 rows)

benchmark=>
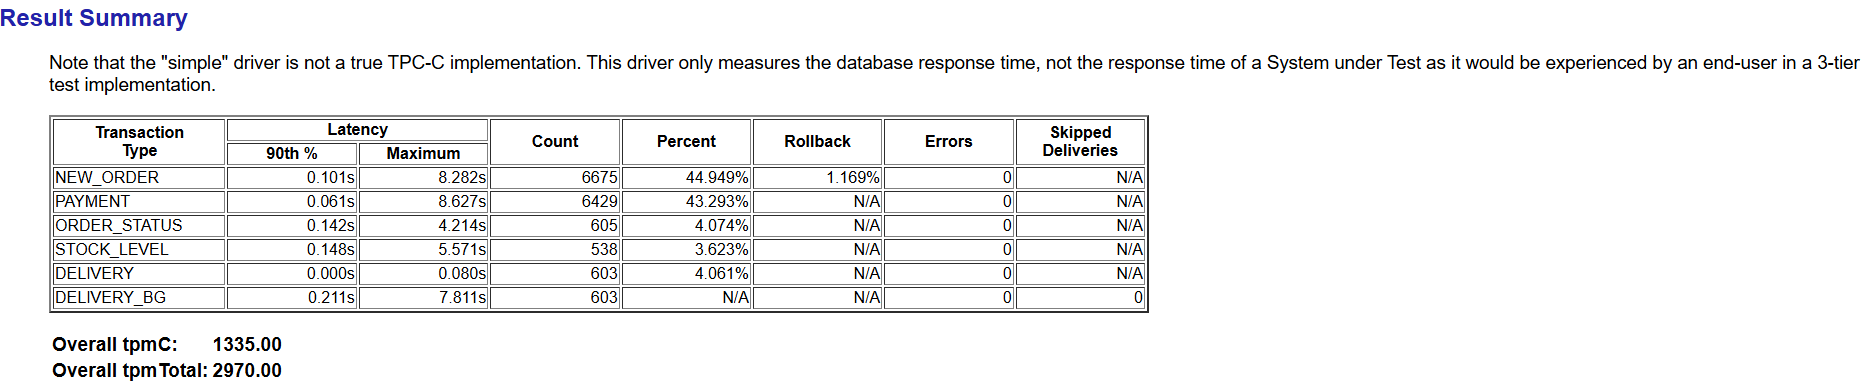
4、性能压测(使用10仓,100并发连续测试5分钟后tpmC为1325)
cd /soft/benchmarksql-5.0/run
./runBenchmark.sh my.properties
性能压测过程如下:
[root@node1 run]# ./runBenchmark.sh my.properties
08:50:44,346 [main] INFO   jTPCC : Term-00,
08:50:44,348 [main] INFO   jTPCC : Term-00, +-------------------------------------------------------------+
08:50:44,348 [main] INFO   jTPCC : Term-00,      BenchmarkSQL v5.0
08:50:44,348 [main] INFO   jTPCC : Term-00, +-------------------------------------------------------------+
08:50:44,348 [main] INFO   jTPCC : Term-00,  (c) 2003, Raul Barbosa
08:50:44,348 [main] INFO   jTPCC : Term-00,  (c) 2004-2016, Denis Lussier
08:50:44,353 [main] INFO   jTPCC : Term-00,  (c) 2016, Jan Wieck
08:50:44,353 [main] INFO   jTPCC : Term-00, +-------------------------------------------------------------+
08:50:44,353 [main] INFO   jTPCC : Term-00,
08:50:44,353 [main] INFO   jTPCC : Term-00, db=postgres
08:50:44,353 [main] INFO   jTPCC : Term-00, driver=org.postgresql.Driver
08:50:44,353 [main] INFO   jTPCC : Term-00, conn=jdbc:postgresql://192.168.100.60:17700/benchmark
08:50:44,353 [main] INFO   jTPCC : Term-00, user=benchmark_user
08:50:44,353 [main] INFO   jTPCC : Term-00,
08:50:44,353 [main] INFO   jTPCC : Term-00, warehouses=10
08:50:44,354 [main] INFO   jTPCC : Term-00, terminals=100
08:50:44,355 [main] INFO   jTPCC : Term-00, runMins=5
08:50:44,355 [main] INFO   jTPCC : Term-00, limitTxnsPerMin=3000
08:50:44,355 [main] INFO   jTPCC : Term-00, terminalWarehouseFixed=true
08:50:44,355 [main] INFO   jTPCC : Term-00,
08:50:44,356 [main] INFO   jTPCC : Term-00, newOrderWeight=45
08:50:44,356 [main] INFO   jTPCC : Term-00, paymentWeight=43
08:50:44,356 [main] INFO   jTPCC : Term-00, orderStatusWeight=4
08:50:44,356 [main] INFO   jTPCC : Term-00, deliveryWeight=4
08:50:44,356 [main] INFO   jTPCC : Term-00, stockLevelWeight=4
08:50:44,356 [main] INFO   jTPCC : Term-00,
08:50:44,356 [main] INFO   jTPCC : Term-00, resultDirectory=my_result_%tY-%tm-%td_%tH%tM%tS
08:50:44,356 [main] INFO   jTPCC : Term-00, osCollectorScript=./misc/os_collector_linux.py
08:50:44,356 [main] INFO   jTPCC : Term-00,
08:50:44,398 [main] INFO   jTPCC : Term-00, copied my.properties to my_result_2025-02-21_085044/run.properties
08:50:44,398 [main] INFO   jTPCC : Term-00, created my_result_2025-02-21_085044/data/runInfo.csv for runID 1
08:50:44,399 [main] INFO   jTPCC : Term-00, writing per transaction results to my_result_2025-02-21_085044/data/result.csv
08:50:44,399 [main] INFO   jTPCC : Term-00, osCollectorScript=./misc/os_collector_linux.py
08:50:44,400 [main] INFO   jTPCC : Term-00, osCollectorInterval=1
08:50:44,400 [main] INFO   jTPCC : Term-00, osCollectorSSHAddr=null
08:50:44,400 [main] INFO   jTPCC : Term-00, osCollectorDevices=net_ens33 blk_sda
08:50:44,458 [main] INFO   jTPCC : Term-00,
08:50:44,966 [main] INFO   jTPCC : Term-00, C value for C_LAST during load: 103
08:50:44,966 [main] INFO   jTPCC : Term-00, C value for C_LAST this run:    15
08:50:44,966 [main] INFO   jTPCC : Term-00,
Term-00, Running Average tpmTOTAL: 2965.83    Current tpmTOTAL: 98268    Memory Usage: 38MB / 59MB
08:57:19,233 [Thread-10] INFO   jTPCC : Term-00,
08:57:19,245 [Thread-10] INFO   jTPCC : Term-00,
08:57:19,245 [Thread-10] INFO   jTPCC : Term-00, Measured tpmC (NewOrders) = 1325.01
08:57:19,245 [Thread-10] INFO   jTPCC : Term-00, Measured tpmTOTAL = 2947.99
08:57:19,246 [Thread-10] INFO   jTPCC : Term-00, Session Start     = 2025-02-21 08:52:16
08:57:19,246 [Thread-10] INFO   jTPCC : Term-00, Session End       = 2025-02-21 08:57:19
08:57:19,246 [Thread-10] INFO   jTPCC : Term-00, Transaction Count = 14850
[root@node1 run]#
执行过程中会在/soft/benchmarksql-5.0/run目录下生成my_result_2025-02-21_085044目录,如下:
[root@node1 run]# pwd
/soft/benchmarksql-5.0/run
[root@node1 run]# ls
benchmarksql-error.log  generateGraphs.sh  log4j.properties  my.properties                props.fb   props.pg         runDatabaseBuild.sh    runLoader.sh  sql.common    sql.oracle
funcs.sh                generateReport.sh  misc              my_result_2025-02-21_085044  props.ora  runBenchmark.sh  runDatabaseDestroy.sh  runSQL.sh     sql.firebird  sql.postgres
[root@node1 run]# cd my_result_2025-02-21_085044/
[root@node1 my_result_2025-02-21_085044]# ll
total 4
drwxr-xr-x 2 root root  103 Feb 21 08:50 data
-rw-r--r-- 1 root root 1035 Feb 21 08:50 run.properties
[root@node1 my_result_2025-02-21_085044]# cd data
[root@node1 data]# ll
total 544
-rw-r--r-- 1 root root  20867 Feb 21 08:57 blk_sda.csv
-rw-r--r-- 1 root root  22720 Feb 21 08:57 net_ens33.csv
-rw-r--r-- 1 root root 457700 Feb 21 08:57 result.csv
-rw-r--r-- 1 root root    220 Feb 21 08:52 runInfo.csv
-rw-r--r-- 1 root root  42327 Feb 21 08:57 sys_info.csv
可以看到data目录下生成了5个csv文件。
如果需要重跑压测过程,清理数据的命令如下:
./runDatabaseDestroy.sh my.opengauss
执行过程如下:
[root@node1 run]# ./runDatabaseDestroy.sh my.properties
# ------------------------------------------------------------
# Loading SQL file ./sql.common/tableDrops.sql
# ------------------------------------------------------------
drop table bmsql_config;
drop table bmsql_new_order;
drop table bmsql_order_line;
drop table bmsql_oorder;
drop table bmsql_history;
drop table bmsql_customer;
drop table bmsql_stock;
drop table bmsql_item;
drop table bmsql_district;
drop table bmsql_warehouse;
drop sequence bmsql_hist_id_seq;
5、生成报告
BenchmarkSQL通过安装的ant和R语言包等工具可支持生成格式为csv、png和html的压力测试报告。命令如下:
cd /soft/benchmarksql-5.0/run
./generateReport.sh my_result_2025-02-21_085044
运行过程如下:
[root@node1 run]# ./generateReport.sh my_result_2025-02-21_085044
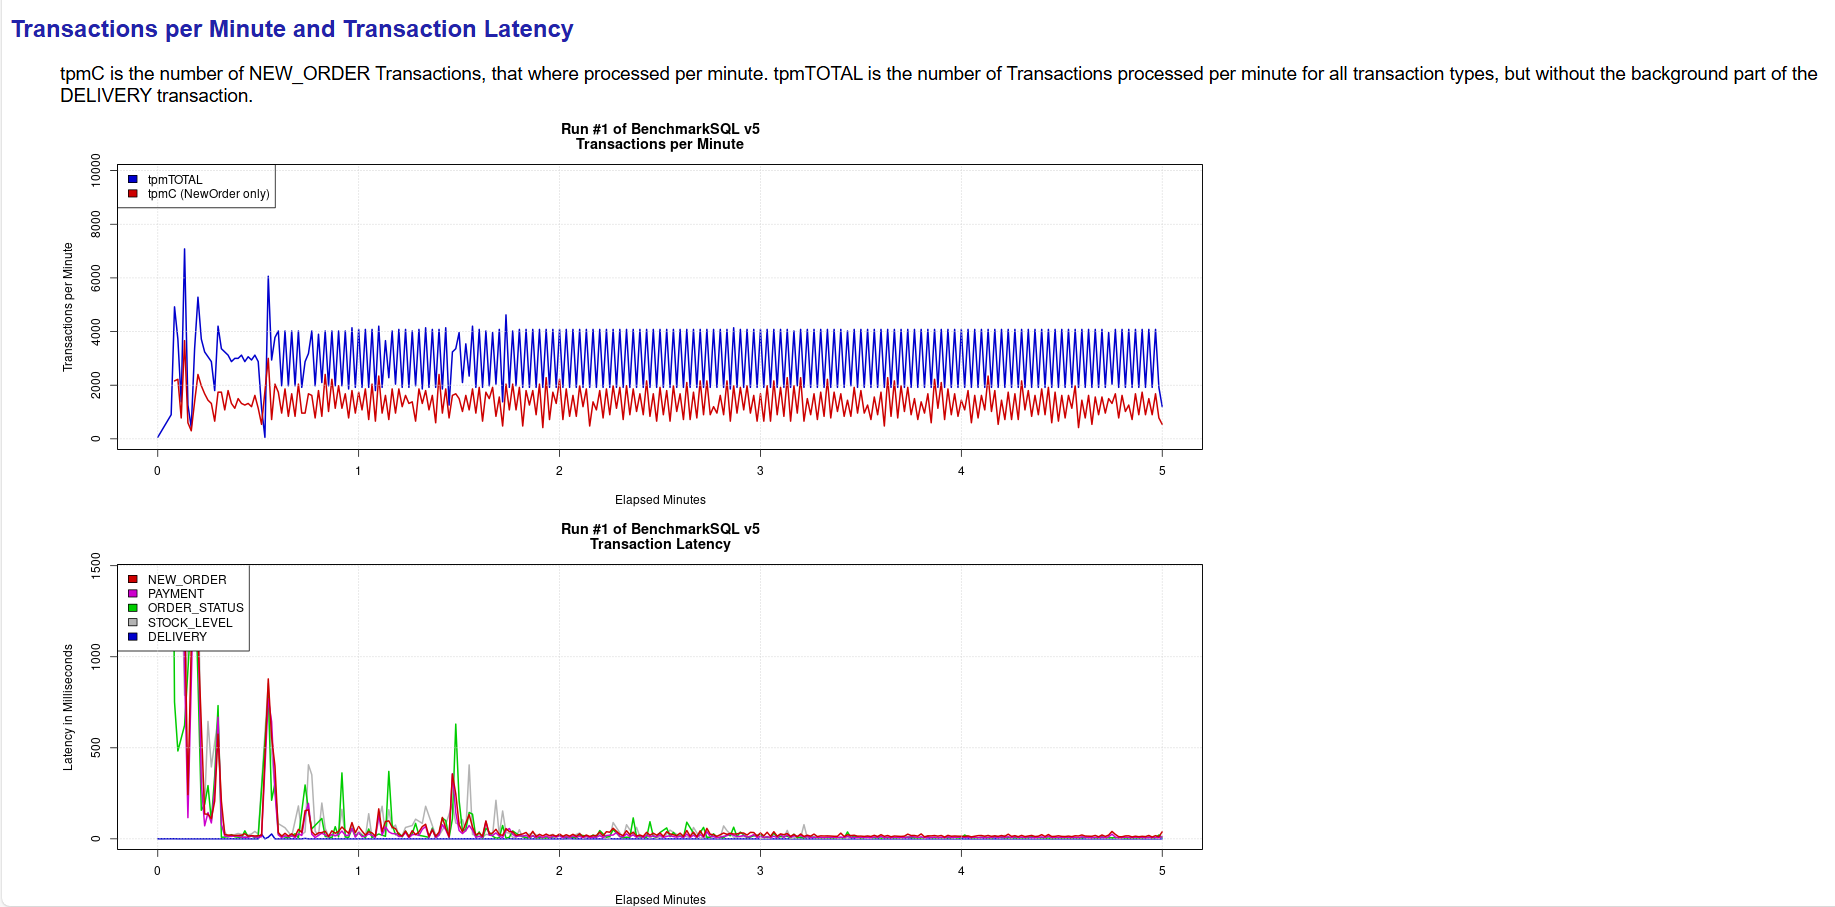
Generating my_result_2025-02-21_085044/tpm_nopm.png ... OK
Generating my_result_2025-02-21_085044/latency.png ... OK
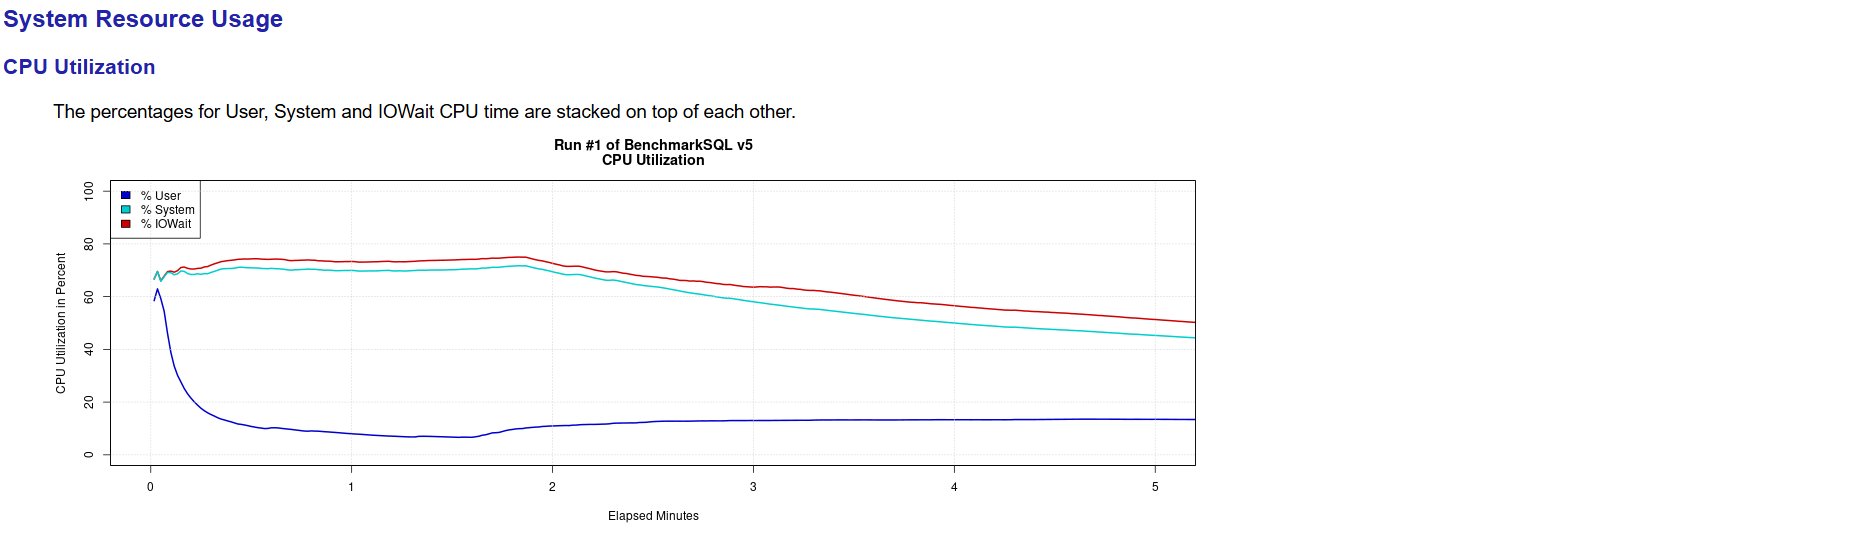
Generating my_result_2025-02-21_085044/cpu_utilization.png ... OK
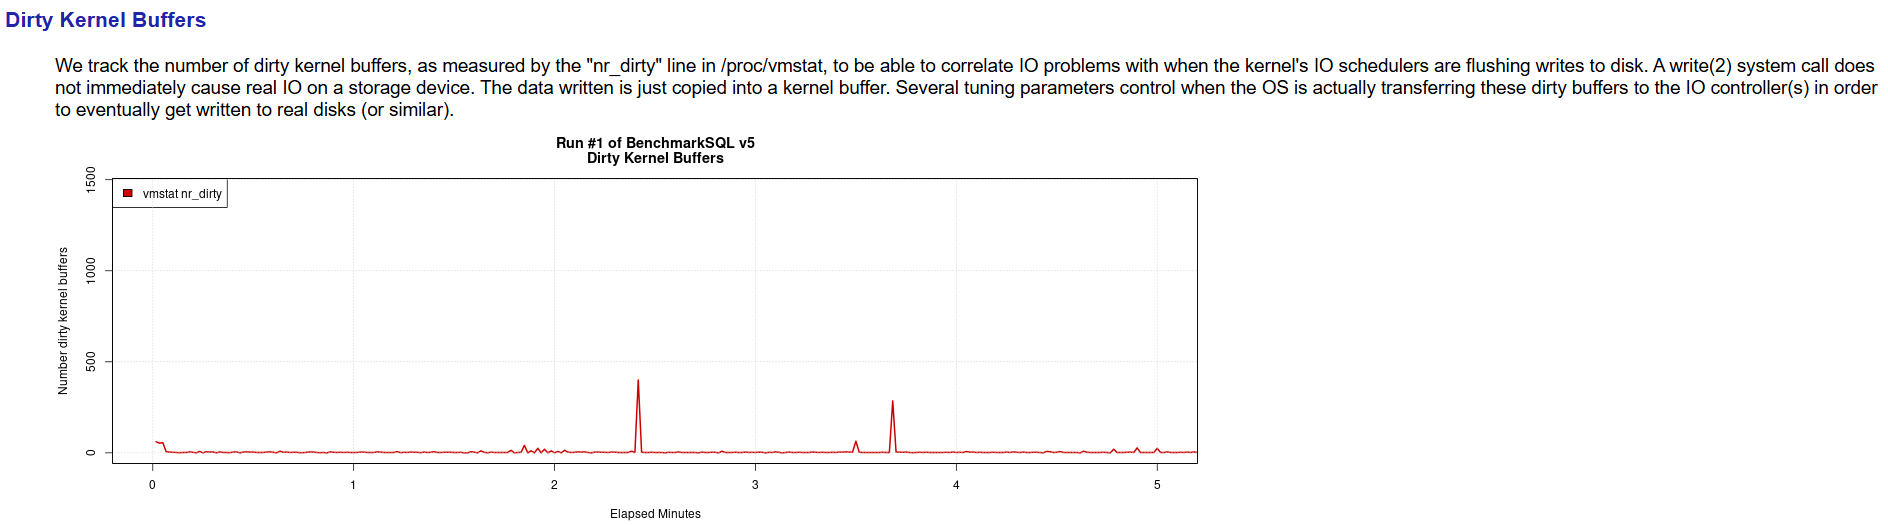
Generating my_result_2025-02-21_085044/dirty_buffers.png ... OK
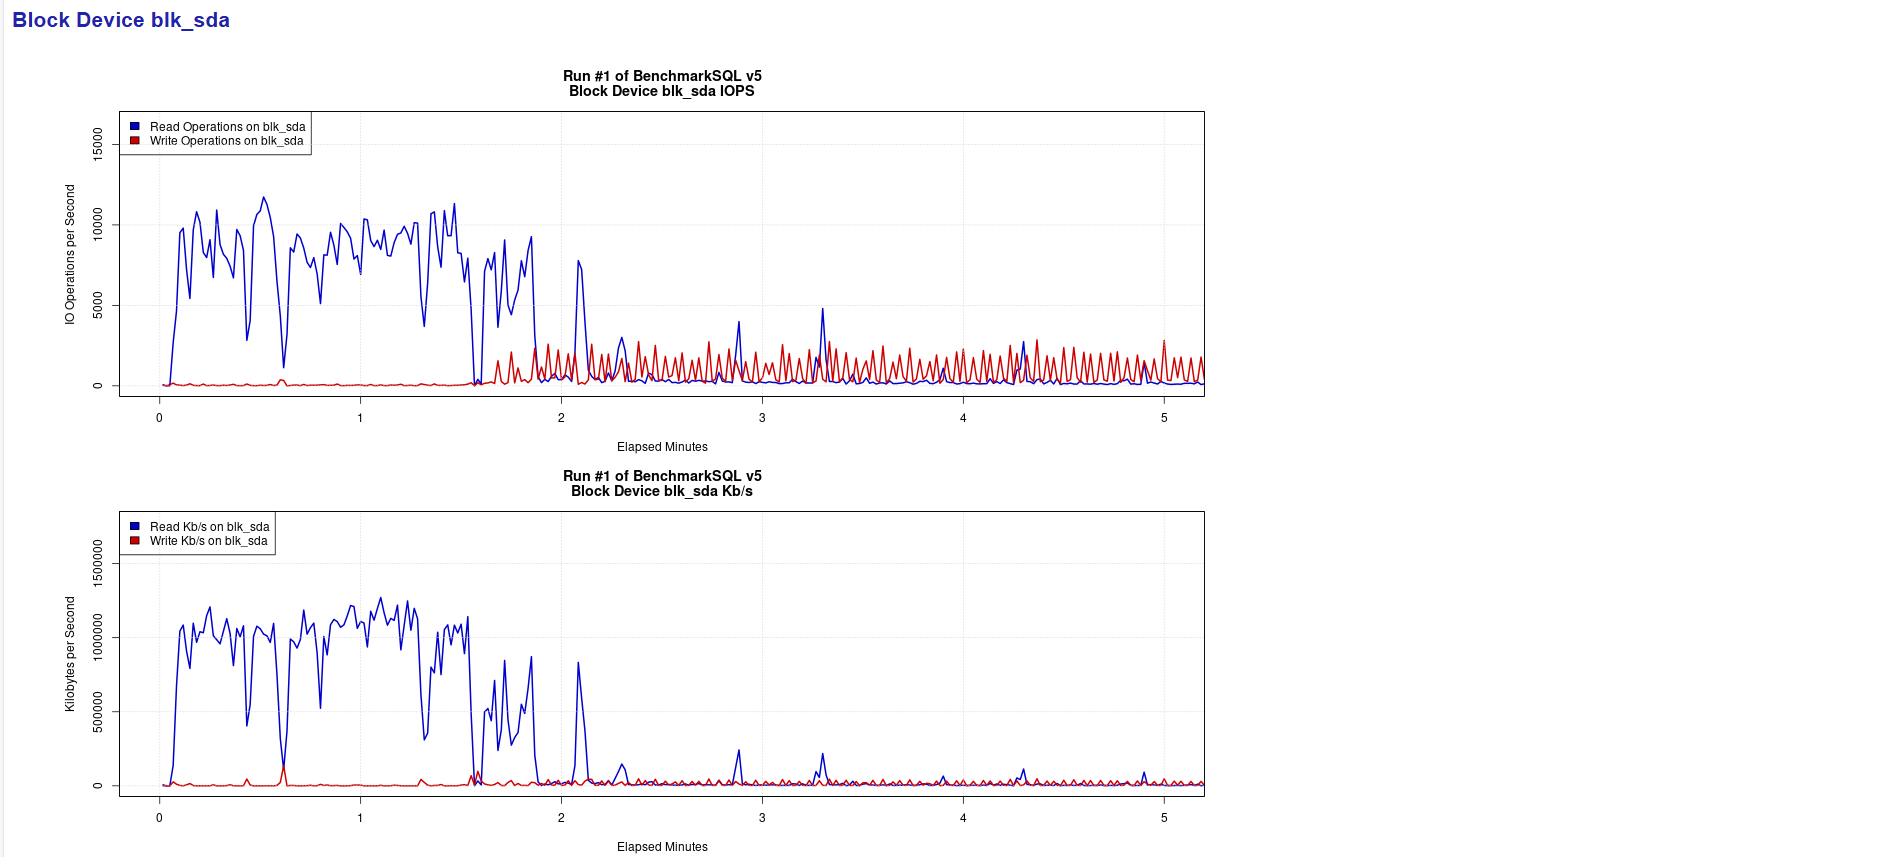
Generating my_result_2025-02-21_085044/blk_sda_iops.png ... OK
Generating my_result_2025-02-21_085044/blk_sda_kbps.png ... OK
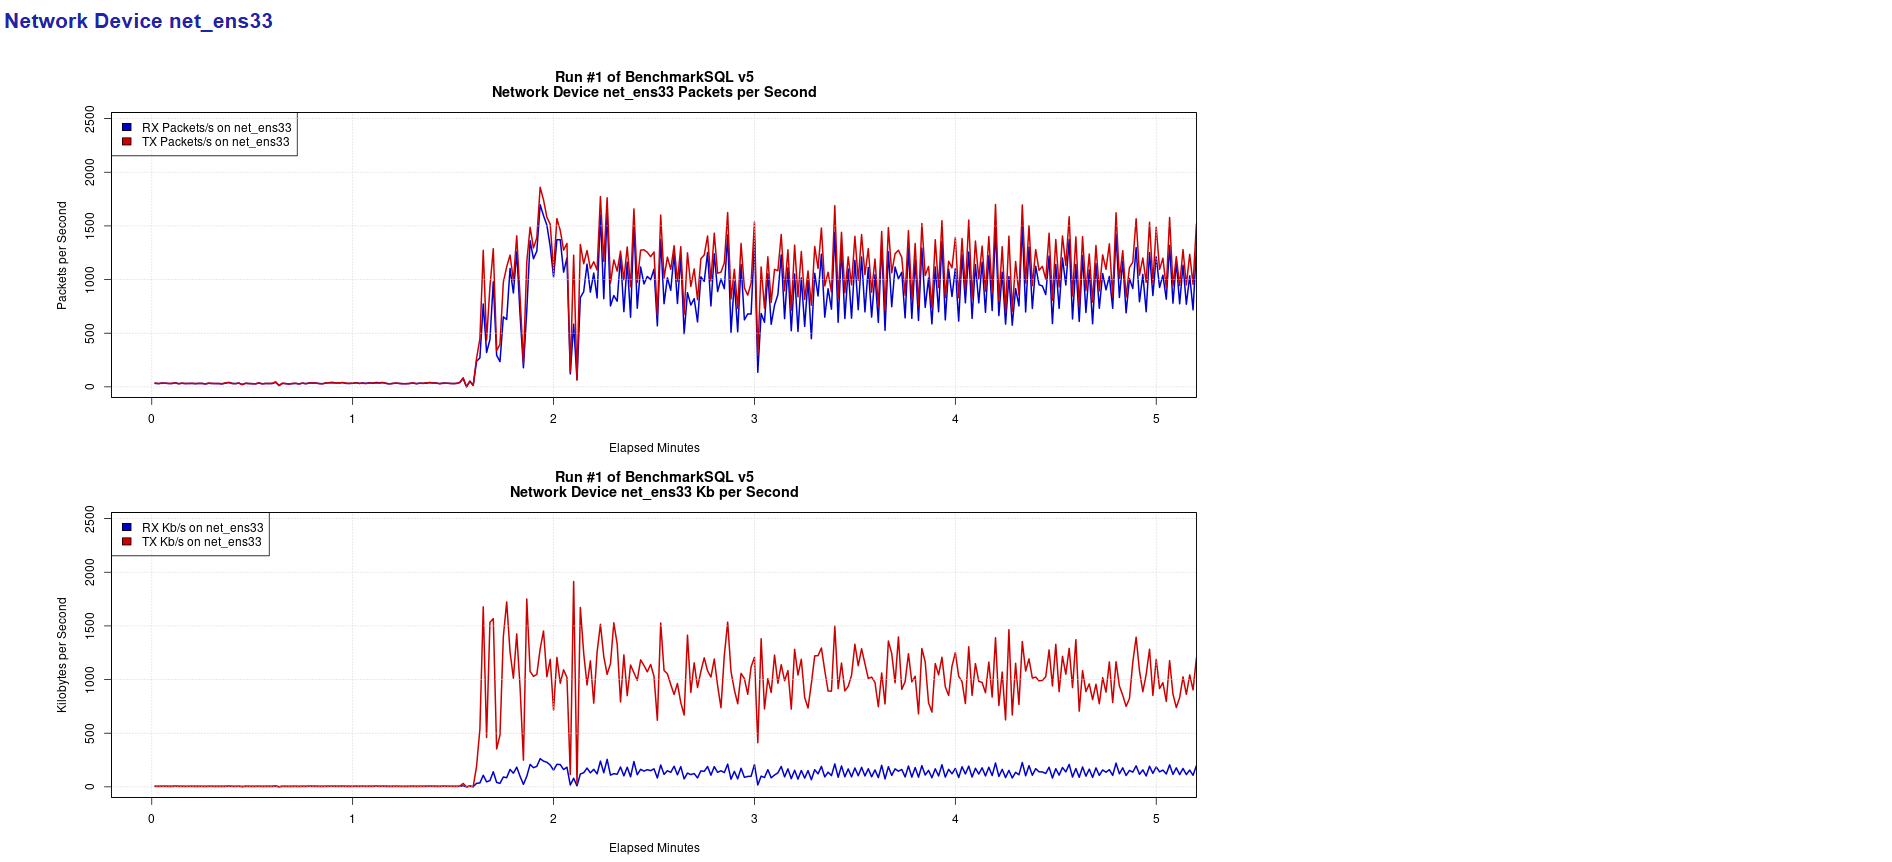
Generating my_result_2025-02-21_085044/net_ens33_iops.png ... OK
Generating my_result_2025-02-21_085044/net_ens33_kbps.png ... OK
Generating my_result_2025-02-21_085044/report.html ... OK
my_result开头的目录下生成了8个png文件和1个html文件。如下:
[root@node1 run]# cd my_result_2025-02-21_085044
[root@node1 my_result_2025-02-21_085044]# ll
total 568
-rw-r--r-- 1 root root  79262 Feb 21 09:53 blk_sda_iops.png
-rw-r--r-- 1 root root  60826 Feb 21 09:53 blk_sda_kbps.png
-rw-r--r-- 1 root root  41328 Feb 21 09:53 cpu_utilization.png
drwxr-xr-x 2 root root    125 Feb 21 09:53 data
-rw-r--r-- 1 root root  29174 Feb 21 09:53 dirty_buffers.png
-rw-r--r-- 1 root root  64038 Feb 21 09:53 latency.png
-rw-r--r-- 1 root root 100948 Feb 21 09:53 net_ens33_iops.png
-rw-r--r-- 1 root root  78762 Feb 21 09:53 net_ens33_kbps.png
-rw-r--r-- 1 root root   7217 Feb 21 09:53 report.html
-rw-r--r-- 1 root root   1035 Feb 21 08:50 run.properties
-rw-r--r-- 1 root root  97474 Feb 21 09:53 tpm_nopm.png
同时查看data目录,发现又新生成了tx_summary.csv文件,现在data目录下共6个文件。如下:
[root@node1 my_result_2025-02-21_085044]# cd data
[root@node1 data]# ll
total 548
-rw-r--r-- 1 root root  20867 Feb 21 08:57 blk_sda.csv
-rw-r--r-- 1 root root  22720 Feb 21 08:57 net_ens33.csv
-rw-r--r-- 1 root root 457700 Feb 21 08:57 result.csv
-rw-r--r-- 1 root root    220 Feb 21 08:52 runInfo.csv
-rw-r--r-- 1 root root  42327 Feb 21 08:57 sys_info.csv
-rw-r--r-- 1 root root    474 Feb 21 09:53 tx_summary.csv
可以将my_result_2025-02-21_085044目录打包下载到本地查看:
tar -cvf my_result_my_result_2025-02-21_085044.tar my_result_2025-02-21_085044
6、查看报告
这里主要查看生成的report.html报告:
碰到的问题
1、R语言包安装报错:
configure: error: PCRE2 library and headers are required, or use --with-pcre1 and PCRE >= 8.32 with UTF-8 support
解决办法
./configure --with-pcre1
参考文档
https://www.modb.pro/db/1788762416603533312
https://benchmarksql.readthedocs.io/en/latest/
https://blog.csdn.net/Tiaoxiaobai/article/details/139173981
总结
本文主要介绍了使用benchmarksql对磐维数据库做性能测试的步骤和方法过程,但是由于本地虚拟机配置很低,数据库参数也没有做过任何优化,所以文中的测试结果并不具有实际参考价值。在实际生产环境中由于主机硬件配置较高,而且数据库参数都是经过优化调整的,所以测试结果会好很多!
关于作者:
网名:飞天,墨天轮2024年度优秀原创作者,拥有 Oracle 10g OCM 认证、PGCE认证以及OBCA、KCP、ACP、磐维等众多国产数据库认证证书,目前从事Oracle、Mysql、PostgresSQL、磐维数据库管理运维工作,喜欢结交更多志同道合的朋友,热衷于研究、分享数据库技术。
微信公众号:飞天online
墨天轮:https://www.modb.pro/u/15197
如有任何疑问,欢迎大家留言,共同探讨~~~
