模型需求描述
模型主要是计算中小学缓冲区与居住用地的面积比率;模型的主要逻辑如下:在POI数据中筛选出中小学,利用中小学点数据创建1000米缓冲区;接着在土地利用现状图斑中筛选出居民用地数据,然后利用居民用地数据裁剪学校缓冲区;利用行政区对分别居民用地和裁剪后的学校缓冲区数据进行标识,标识完成后,使用行政区名称字段对标识结果进行融合,最后计算学校缓冲区面积和居民用地面积的比例。
数据说明
使用的数据为某市的测试数据,图层数据的简单说明如下:数据坐标系:国家2000坐标系 POI数据 行政区划面数据 土地利用现状图斑数据
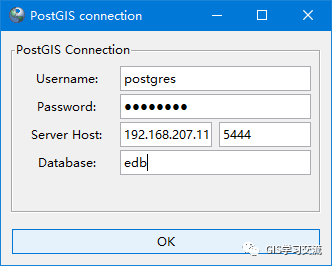
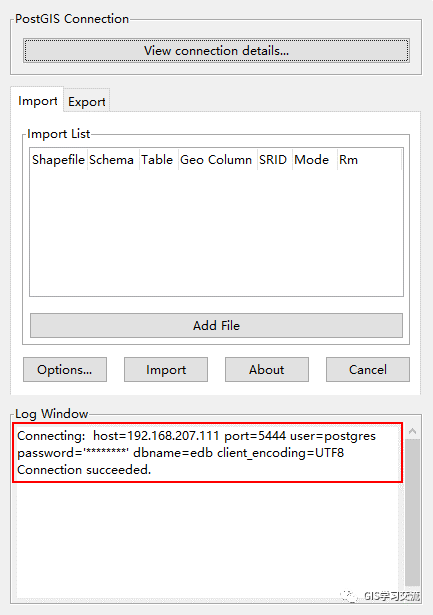
数据入库使用PostGIS 2.0 Shapefile and DBF Loader Exporter工具把shapefile数据入库到PostgreSql中;入库的步骤如下;打开PostGIS 2.0 Shapefile and DBF Loader Exporter工具,点击【View connection details】按钮,在弹出的数据库连接信息窗口中填写连接信息;填写完毕点击【ok】按钮开始连接;如连接成功,可以在【log Window】中看到连接成功的信息;如下图1,2所示。
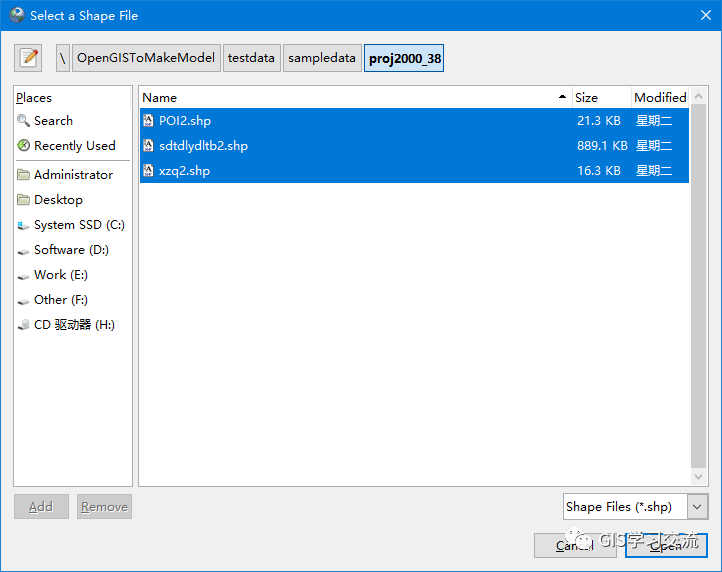
点击【Add File】按钮,选择需要入库的Shapefile数据,选择完毕后点击【Open】按钮,把数据加载到Import页面中;如下图3所示;
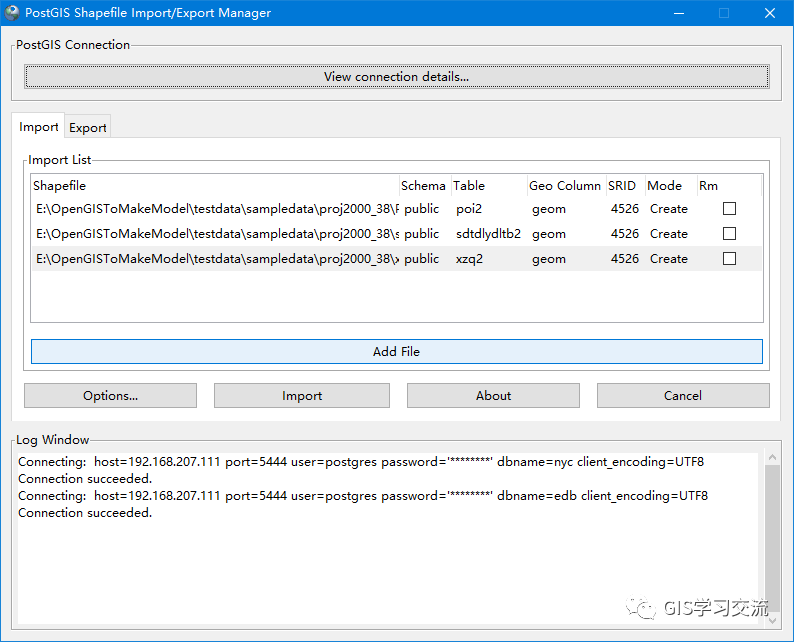
在Import页面中填写数据的空间参考标识符信息(SRID),例如这里入库的数据空间参考为CGCS2000_3_Degree_GK_Zone_38,SRID值为4526;填写完毕后点击【Import】按钮开始导入数据;如导入完成后可以在【Log Window】中查看数据入库的信息;如下图4所示。
测试环境
两台配置一样的CentOS7虚拟机上分别安装PostgreSQL9.6(Postgis2.4)和阿里云POLARDB数据库。单台虚拟机的配置如下:内存:2 GB 磁盘:40 GB CPU:2核 使用pgAdmin4客户端连接管理PostgreSQL9.6和阿里云POLARDB数据库;通过Python3.6脚本,利用Python第三方库psycopg2连接操作PostgreSQL9.6和阿里云POLARDB数据库。使用PostGIS的处理逻辑如下
在POI中筛选出中小学构建1000米的缓冲区得到图层schoolbuffer;
create table IF NOT EXISTS SchoolBuffer as select ST_Buffer(geom,1000)::geometry(Polygon,4526)as geom from (select ST_Transform(geom,4526)as geom from public.poi2 where CLASID = '110501' OR CLASID = '110502') as geotran
2.在土地利用现状数据中筛选出居住用地("DLBM" = '0701' OR "DLBM" = '0702');
create table IF NOT EXISTS juminarea as select ST_Transform(geom,4526)as geom
from public.sdtdlydltb2 where DLBM = '0701' OR DLBM = '0702'
3.使用居住用地图层裁剪schoolbuffer图层,获得schoolbuffer_clip图层;
先把居住用地数据的所有面融合为一个几何图形
--居民用地融合为一个图形Create table cliptable as (SELECT st_Union(ST_Accum(ST_SnapToGrid(geom,0.0001))) as geom from juminarea  where 1=1)--居民用地裁剪学校缓冲区

 create table schoolbuffer_clip as (select st_intersection(geom,(select geom from cliptable)
::geometry(MultiPolygon,4526)) as geom from SchoolBuffer where 1=1)
4.用行政区划数据分别对居住用地和schoolbuffer_clip图层进行标识;
GIS中的标识功能的描述如下图5所示。
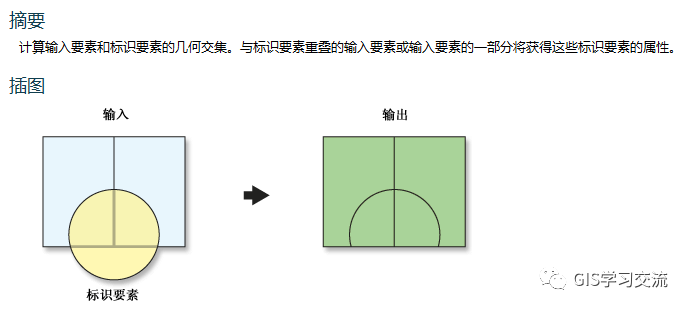
在PostGIS中找不到标识函数,所以根据标识功能,使用PostGIS的函数st_intersection()获得几何图形,再结合Update获得相交图形部分的属性信息。
5.对标识后的居住用地和schoolbuffer_clip图层分别按照行政区名称字段进行融合;
--学校融合create table schoolbuffer_Union as select xzqmc,st_union(ST_Accum(ST_SnapToGrid(geom,0.0001)))
as geom from schoolbuffer_identify where 1=1 group by xzqmc

--居民用地融合create table juminarea_Union as select xzqmc,st_union(ST_Accum(ST_SnapToGrid(geom,0.0001)))
as geom from juminarea_identify where 1=1 group by xzqmc
6.计算学校缓冲区面积,居民用地面积,计算覆盖率(学校缓冲区面积/居住用地面积);
--计算学校面积update schoolbuffer_Union set schoolArea = st_area(geom)--计算居民用地面积update schoolbuffer_Union set jumin_area=(select st_area(geom)
from juminarea_Union where juminarea_Union.xzqmc=schoolbuffer_Union.xzqmc)--计算覆盖率update schoolbuffer_Union set fugailv=schoolArea/jumin_area
Python脚本操作数据库代码
根据模型的处理逻辑,结合PostGIS的SQL语句,在Python脚本中操作数据库; PostgresqlExexute.py文件主要用于实现数据库增删查改;MakeModel.py文件用于实现模型的逻辑,主要代码如下:PostgresqlExexute.py文件
import psycopg2

class DBExcute():
    def __init__(self):
        #虚拟机上的polardb
        self.Conn = psycopg2.connect(database='edb', user='postgres',
                                     password="postgres", host='192.168.207.111',
                                     port="5444")
        self.Cur = self.Conn.cursor()

    def ExecuteSql(self,sql):
        '''
        执行SQL语句并提交;一般为更新,修改,创建,删除等操作
        :param sql: SQL语句
        :return: 执行SQL是否成功
        '''
        try:
            self.Cur.execute(sql)
            self.Conn.commit()
            return True
        except Exception as err:
            print("执行SQL语句发生错误{0}".format(err ))
            return False

    def Check_Exist(self, sql):
        self.Cur.execute(sql)
        count = None
        for cu in self.Cur:
            count = cu[0]
        if count == 0:
            return False
        else:
            return True

    def GetRowstExecute(self,sql):
        '''
        执行查询sql,返回查询结果的行
        :param sql: SQL语句
        :return: 返回rows
        '''
        self.Cur.execute(sql)
        rows=self.Cur.fetchall()
        return rows

    def GetExecuteSql(self,sql):
        '''
        执行SQL查询,返回几何图形的text
        :param sql: SQL语句
        :return: 只返回第一个图形的text
        '''
        self.Cur.execute(sql)
        rows=self.Cur.fetchall()
        for row in rows:
            return row[0]


    def dbClose(self):
        self.Conn.close()#postgresql数据库操作类实例化
dbexecute=DBExcute()
MakeModel.py文件
from PostgresqlExexute import dbexecute
import time

def Union2(tableName,saveTableName):
    '''
    把表tableName的所有图形融合为一个图形,保存到表saveTableName中
    :param tableName: 需要融合的表名称
    :param saveTableName: 融合后的表名称
    :return: 融合后的表名称
    '''
    # 判断表是否存在,存在则删除
    deltablesql = "drop table if exists {0}".format(saveTableName)
    dbexecute.ExecuteSql(deltablesql)
    sql="Create table {0} as (SELECT ST_Union(geom) as geom from {1}  where 1=1)"
    .format(saveTableName,tableName)
    successful=dbexecute.ExecuteSql(sql)
    if(successful):
        print("裁剪图层融合完成!")
        return saveTableName
    else:
        return Nonedef clip(tableName,Cliptable,saveTableName):
    '''
    用ClipGeoText裁剪图层tableName,并新建一个裁剪后图层
    :param tableName: 图层名称
    :param ClipGeoText: 裁剪图形的几何text
    :return: 返回裁剪后的图层名称
    '''
    #判断表是否存在,存在则删除
    deltablesql="drop table if exists {0}".format(saveTableName)
    dbexecute.ExecuteSql(deltablesql)
    #判断图形是否可用
    makevalid = "update  {0} set geom=st_makevalid(geom) where not st_isvalid(geom)".format(Cliptable)
    print("正在修复图形……")
    dbexecute.ExecuteSql(makevalid)
    print("裁剪图层修复完毕!")

    getGeo="select st_astext(geom) from {0}".format(Cliptable)
    geotext=dbexecute.GetExecuteSql(getGeo)

    ClipAndCreatesql = "create table {0} as (select st_intersection(geom,(select geom from {1})
    ::geometry(MultiPolygon,4526)) as geom from {2} where 1=1)".format(saveTableName,Cliptable,tableName)
    print("正在进行裁剪操作……")
    successful=dbexecute.ExecuteSql(ClipAndCreatesql)
    if successful:
        return saveTableName
    else:
        return Nonedef identify(savetableName,intable,selGeotext,xzqmc):
    '''
    实现标识功能;利用相交获得与标识图形相交部分的几何图形,
    然后把行政区名称,相交几何图形保存到表savetableName中
    :param savetableName: 保存结果的表
    :param intable: 需要标识的表
    :param selGeotext: 标识几何图形的text
    :param xzqmc: 标识字段
    :return:
    '''
    #通过Geotext获得相交的部分图形,带入行政区名称,保存到savetableName中
    selsql="select st_astext(st_intersection(geom,(st_geomfromtext('{0}',4526))))
    from {1} where 1=1".format(selGeotext,intable)
    rows=dbexecute.GetRowstExecute(selsql)
    for row in rows:
        geoinfo=row[0]
        insertSql="insert into {0} (geom,xzqmc)values(ST_GeomFromText('{1}',4526),'{2}')"
        .format(savetableName,geoinfo,xzqmc)
        dbexecute.ExecuteSql(insertSql)def UnionByField(intable,newTable,FieldName):
    '''
    按照字段FieldName把字段值相同的图形融合为一个
    :param intable: 需要融合的表
    :param newTable: 融合后的表
    :param FieldName: 融合字段名称
    :return: 融合后的表名称
    '''
    delsql="drop table  if exists {0}".format(newTable)
    dbexecute.ExecuteSql(delsql)
    # 判断图形是否可用
    makevalid = "update  {0} set geom=st_makevalid(geom) where not st_isvalid(geom)"
    .format(intable)
    dbexecute.ExecuteSql(makevalid)#正在修复图形
    union = "create table {0} as select xzqmc,st_union(geom) as geom from {1} where 1=1 group by {2}"
    .format(newTable, intable, FieldName)
    successful=dbexecute.ExecuteSql(union)
    if successful:
        return newTable
    else:
        return Nonedef mainFunction(POItable,sdtdlyxztable,xzqtable):
    '''
     社区中小学步行15分钟覆盖率模型的逻辑函数
    :param POItable: POI数据表
    :param sdtdlyxztable: 土地利用现状图斑表
    :param xzqtable: 行政区划表
    :return:
    '''
    #从POI中选择学校点并进行投影,缓冲
    schoolbuffer="schoolbuffer" #学校poi点缓冲区
    delsql="drop table  if exists {0}".format(schoolbuffer)
    dbexecute.ExecuteSql(delsql)
    bufferSql="create table IF NOT EXISTS {0} as select ST_Buffer(geom,1000)::geometry(Polygon,4526) " \
              "as geom from (select ST_Transform(geom,4526)as geom from {1} where CLASID = '110501' OR" \
              " CLASID = '110502') as geotran".format(schoolbuffer,POItable)
    successful=dbexecute.ExecuteSql(bufferSql)
    if successful==False:
        print("选择学校并进行缓冲失败!")
        return

    #从土地利用现状图斑中选择居民用地并进行投影
    juminarea="juminarea"
    delsql="drop table if exists {0}".format(juminarea)
    dbexecute.ExecuteSql(delsql)
    selSQL="create table IF NOT EXISTS {0} as select ST_Transform(geom,4526) " \
           "as geom from {1} where DLBM = '0701' OR DLBM = '0702'".format(juminarea,sdtdlyxztable)
    successful=dbexecute.ExecuteSql(selSQL)
    if successful==False:
        print("选择居民地并进行投影失败!")
        return

    # 居民用地融合,用于裁剪学校缓冲区
    UniontableName = "uniontb"
    UniontableName=Union2(juminarea,UniontableName)

    #用居民用地裁剪学校缓冲区
    ClipTableName = "cliptb"
    if UniontableName!=None:
        clip(schoolbuffer,UniontableName,ClipTableName)
    else:
        print("获得的裁剪图层名称为空!")
        return

    # 进行标识
    scidentifyTb="scidentifytb";jmidentifytb="jmidentifytb"
    # 创建保存标识数据的表
    delsql = "drop table if exists {0}".format(scidentifyTb)
    dbexecute.ExecuteSql(delsql)
    createSql = "create table {0} (xzqmc text,geom geometry)".format(scidentifyTb)
    dbexecute.ExecuteSql(createSql)

    delsql = "drop table if exists {0} ".format(jmidentifytb)
    dbexecute.ExecuteSql(delsql)
    createSql = "create table {0} (xzqmc text,geom geometry)".format(jmidentifytb)
    dbexecute.ExecuteSql(createSql)

    selsql = "select  st_astext(st_transform(geom,4526)),xzqmc from {0}".format(xzqtable)
    xzqrows = dbexecute.GetRowstExecute(selsql)
    for row in xzqrows:
        identify(scidentifyTb, ClipTableName, row[0], row[1])  # 学校缓冲区
        identify(jmidentifytb, juminarea, row[0], row[1]) #居民居住区标识

    # 按行政区进行融合
    schoolbufferUnion="schoolbufferUnion"
    schoolbufferUnion = UnionByField(scidentifyTb, schoolbufferUnion, "xzqmc")
    if schoolbufferUnion == None:
        print("学校缓冲图层融合失败!")
        return

    juminareaUnion = "juminareaUnio"
    juminareaUnion = UnionByField(jmidentifytb, juminareaUnion, "xzqmc")
    if juminareaUnion == None:
        print("居民用地图层融合失败!")
        return

    # 分别添加学校面积,居民居住用地面积,覆盖率字段
    schoolarea = "schoolarea";juminareaField="juminarea"; fglfield="xxfgl"
    addsql = "alter table {0} add COLUMN {1} decimal,add COLUMN {2} decimal,add COLUMN {3} decimal".format(
        schoolbufferUnion, schoolarea,juminareaField,fglfield)
    dbexecute.ExecuteSql(addsql)

    # 计算学校面积,居民用地面积
    update = "update {0} set {1} = st_area(geom)".format(schoolbufferUnion, schoolarea)
    dbexecute.ExecuteSql(update)

    #通过计算表juminareaUnion几何图形面积,并保存到表schoolbufferUnion的juminarea字段中
    update="update {0} set {1}=(select st_area(geom) from {2} where {3}.xzqmc={4}.xzqmc)".format(
        schoolbufferUnion,juminareaField,juminareaUnion,juminareaUnion,schoolbufferUnion
    )
    dbexecute.ExecuteSql(update)

    #计算覆盖率xxfgl字段值;schoolarea/juminareaField
    update="update {0} set {1}={2}.{3}/{4}.{5}".format(schoolbufferUnion,fglfield,schoolbufferUnion,
                                                       schoolarea,schoolbufferUnion,juminareaField)
    dbexecute.ExecuteSql(update)

    dbexecute.dbClose()
    print("All Execute Successfully!")if __name__=="__main__":
    start=time.clock()
    poi="poi"
    tuban="sdtdlydltb"
    xzq="xzq"
    mainFunction(poi,tuban,xzq)   #执行模型
    end=time.clock()print("Running time:%s Seconds"%(end-start))  #获得模型运行时间
运行效率对比
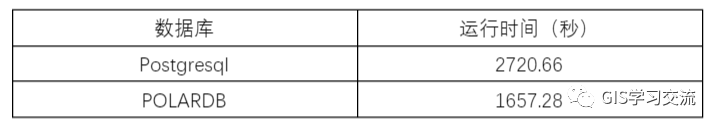
运行效率对比 使用同一份数据和相同的SQL语句在虚拟机环境相同的Postgresql和POLARDB数据库上运行,两者的运行时间对比如下表1所示。
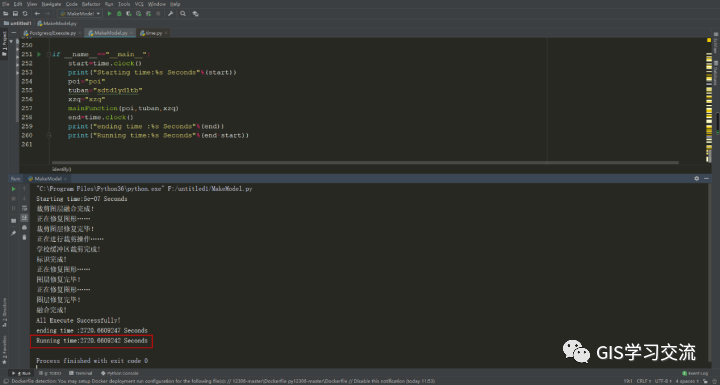
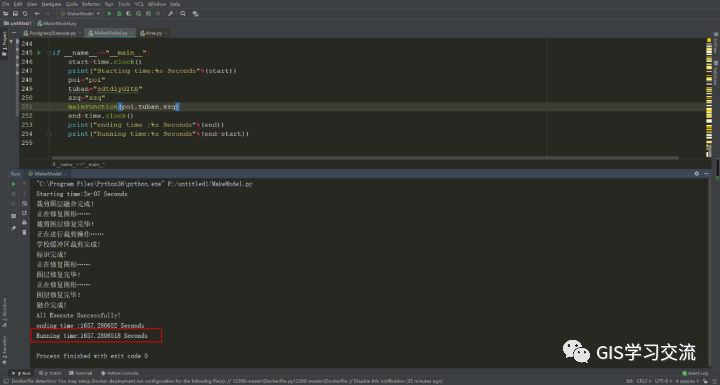
Postgresql和POLARDB数据库运行时间截图如下图6,7所示。
运行结果对比
使用同一份数据,通过ArcMap的模型构建器实现社区中小学步行15分钟覆盖率模型,模型的结构图如下图8,9所示(图8,图9为同一个模型);使用ArcMap模型构建器运行的结果作为标准,对比验证Postgresql和Polardb数据库执行模型的准确度。
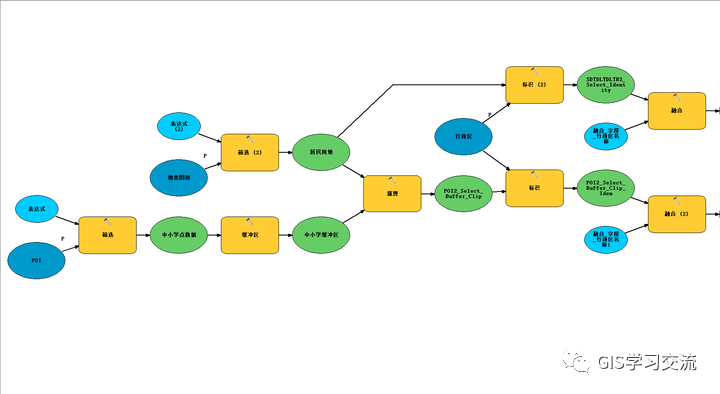
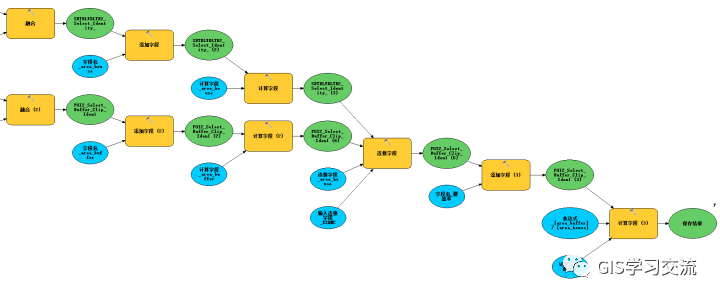
在ArcMap,polardb和postgresql数据库中运行模型的结果如下图所示。
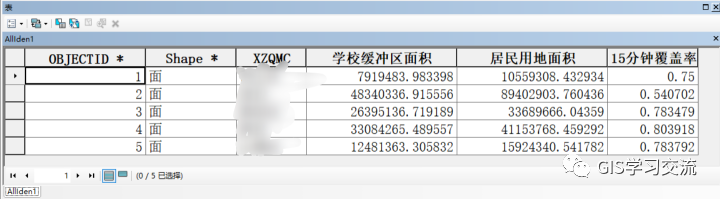
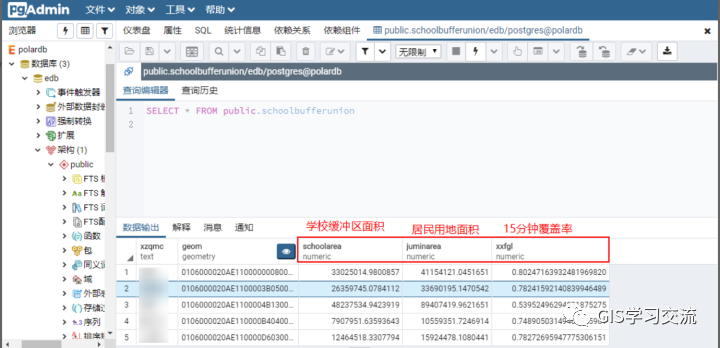
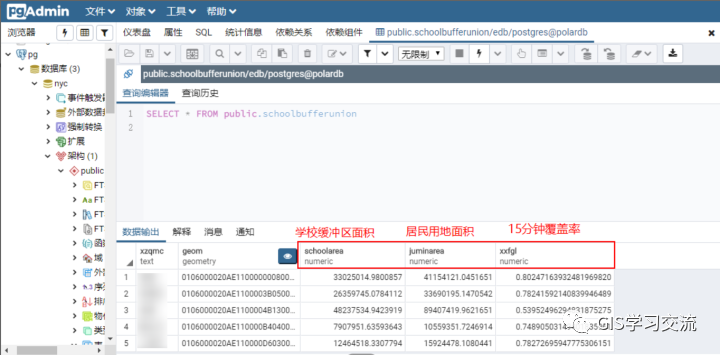
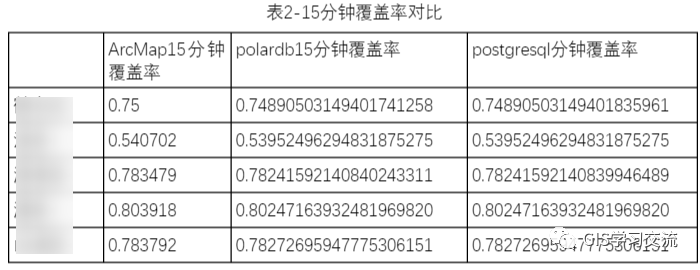
Polardb、postgresql和ArcMap的15分钟覆盖率字段值对比如下表2所示;通过对比三者的运行结果发现,polardb与postgresql的15分钟覆盖率字段值几乎完全一样;polardb(或postgresql)数据库与ArcMap的15分钟覆盖率相差0.001左右。
欢迎关注微信公众号【GIS学习交流】进行学习交流