


Prometheus (https://www.prometheus.io/)是一款基于时序数据库的开源监控告警系统,非常适合Kubernetes集群的监控。

Prometheus的基本原理是通过HTTP协议周期性抓取被监控组件的状态,任意组件只要提供对应的HTTP接口就可以接入监控。不需要任何SDK或者其他的集成过程。这样做非常适合做虚拟化环境监控系统,比如VM、Docker、Kubernetes等。输出被监控组件信息的HTTP接口被叫做exporter 。
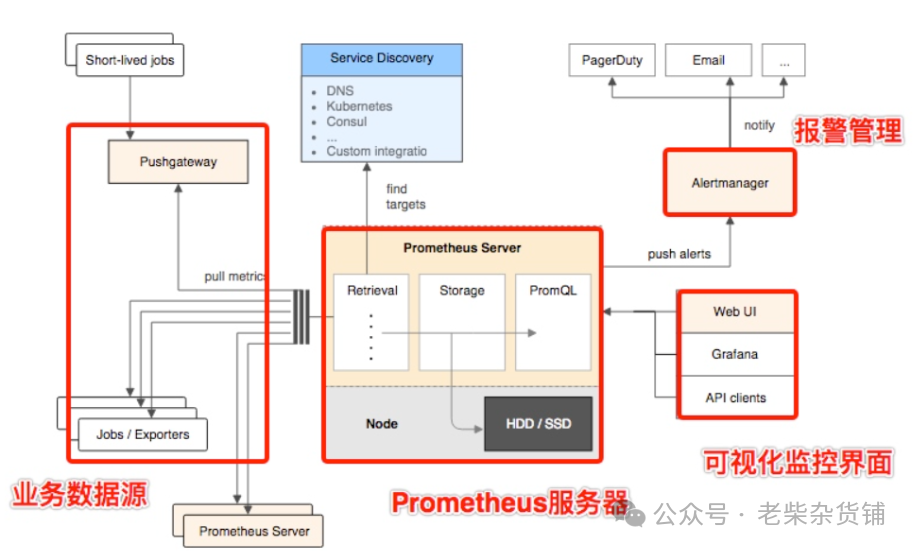
目前互联网公司常用的组件大部分都有exporter可以直接使用,比如Varnish、Haproxy、Nginx、MySQL、Linux系统信息(包括磁盘、内存、CPU、网络等等)。Promethus有以下特点:
支持多维数据模型:由度量名和键值对组成的时间序列数据
内置时间序列数据库TSDB
支持PromQL查询语言,可以完成非常复杂的查询和分析,对图表展示和告警非常有意义
支持HTTP的Pull方式采集时间序列数据
支持PushGateway采集瞬时任务的数据
支持服务发现和静态配置两种方式发现目标
支持接入Grafana
# 下载最新稳定版wget https://github.com/prometheus/prometheus/releases/download/v3.2.1/prometheus-3.2.1.linux-amd64.tar.gz# 解压并安装tar xvf prometheus-*.tar.gzcd prometheus-*/sudo cp prometheus promtool /usr/local/bin/sudo cp -r consoles/ console_libraries/ /etc/prometheus/
配置文件管理
基础配置模板(/etc/prometheus/prometheus.yml)
global:scrape_interval: 15sevaluation_interval: 15srule_files:- "alert.rules"scrape_configs:- job_name: "prometheus"static_configs:- targets: ["localhost:9090"]- job_name: "node_exporter"static_configs:- targets: ["node1:9100", "node2:9100"]remote_write:- url: "http://victoriametrics:8428/api/v1/write"queue_config:max_samples_per_send: 10000
配置语法验证
promtool check config /etc/prometheus/prometheus.yml
创建Systemd服务(/etc/systemd/system/prometheus.service)
[Unit]Description=Prometheus ServerWants=network-online.targetAfter=network-online.target[Service]User=prometheusGroup=prometheusExecStart=/usr/local/bin/prometheus \--config.file=/etc/prometheus/prometheus.yml \--storage.tsdb.path=/var/lib/prometheus \--web.console.templates=/etc/prometheus/consoles \--web.console.libraries=/etc/prometheus/console_libraries \--web.listen-address=0.0.0.0:9090Restart=alwaysExecReload=/bin/kill -HUP $MAINPID[Install]WantedBy=multi-user.target
安全加固
基础认证配置
生成密码文件:
echo 'admin:$2y$05$4Y4VZfTW.Tn2lW5U5H5LB.XWUjN5kK3qJGd7KkDuGj6sYCAcJz/vW' > /etc/prometheus/web.yml
启动参数添加:
--web.config.file=/etc/prometheus/web.yml
TLS加密配置
tls_server_config:cert_file: /etc/ssl/prometheus.crtkey_file: /etc/ssl/private/prometheus.key
生产优化建议
存储优化
启用--storage.tsdb.retention.time=180d控制数据保留周期
使用--storage.tsdb.wal-compression启用WAL压缩
定期执行数据清理:
prometheus_tsdb clean --dry-run --max-expire=720h /var/lib/prometheus
性能调优
调整--storage.tsdb.max-block-duration=2h减少内存占用
设置--query.max-concurrency=50限制并发查询
启用--enable-feature=remote-write-receiver提升远程写入性能
双活集群架构
# 启动参数添加--cluster.peer=host1:9090 --cluster.peer=host2:9090
