
没关注? 伸出手指点这里 >>>
监控
Kubernetes系列
对云数据中心的监控,主要针对数据中心内的硬件和软件进行监控和告警,任何传统IT架构、IAAS云、PAAS平台基础架构、SAAS云服务都离不开监控系统的支撑。完整的云监控系统需要支持多种监控对象:容器、网络、存储、服务器和应用等,本文从云监控系统总体架构、prometheus监控系统、kubernetes容器监控、prometheus生态及实践方面进行介绍
监控系统概览

从程序设计角度来看,监控可分为:基础资源监控、中间件监控、应用程序监控和日志监控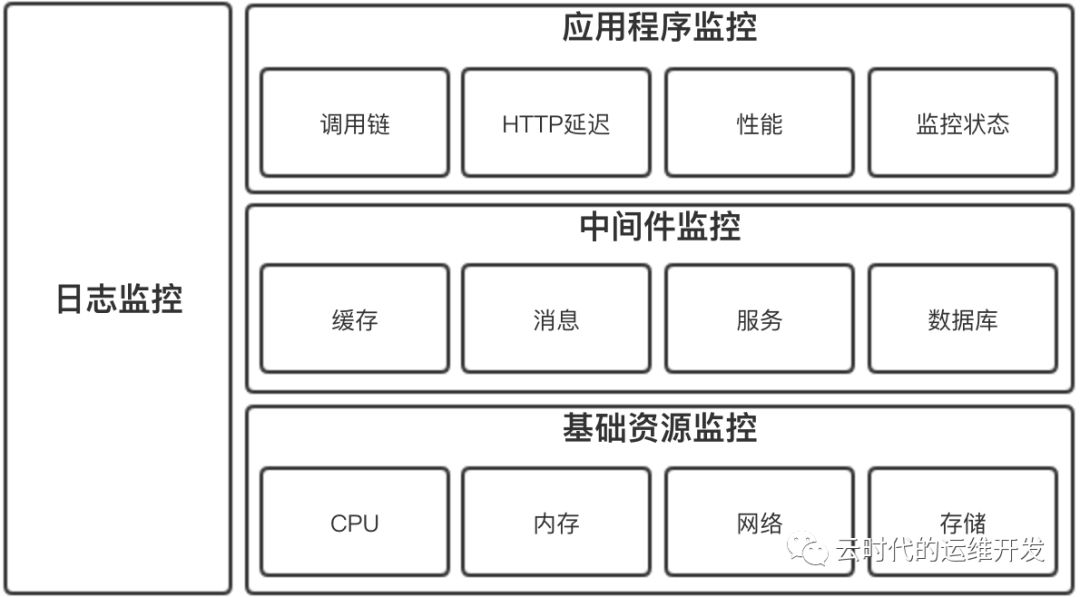
基础资源监控
主机监控
物理机、虚拟机监控,ping监控主机的存活性,其他性能监控指标通常包括
CPU
内存
网络IO
磁盘IO
网络监控
网络性能监控
网络攻击检查
设备监控
存储监控
存储性能监控
存储系统监控
存储设备监控
中间件监控
消息中间件
Web服务中间件
缓存中间件
数据库中间件
应用监控(APM) 应用程序运行状态、性能、调用链跟踪等
日志监控 采集日志文本数据并汇总到日志存储端和搜索引擎,可定位性能瓶颈,也可以用于数据统计、故障告警
开源云监控系统:Open-Falcon
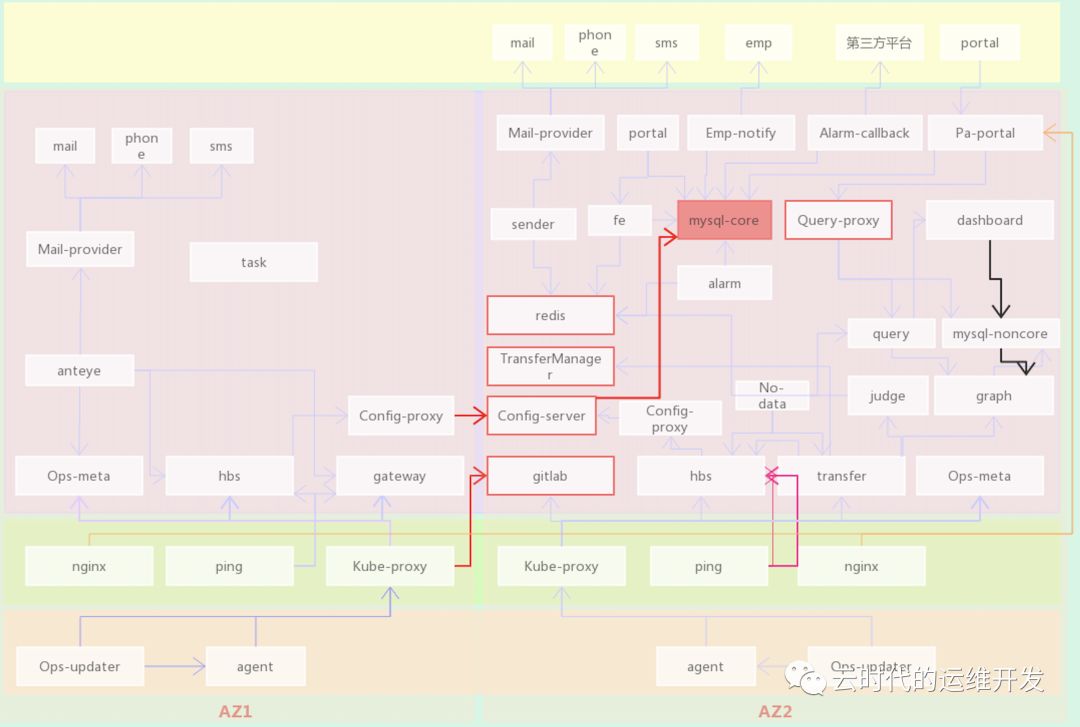
Open-Falcon小米开源分布式监控系统,基于微服务架构使用Golang语言开发,模块众多,横向扩展性好,可分为四条核心链路:数据上报、告警、查询、配置
以企业级标准三层网络架构为例(用户区、公共服务区、云管区)
数据上报链路
Agent(数据采集) -> Proxy(用户到云管区代理) -> Transfer(数据接入和转发组件) -> Graph(存储监控数据)
配置链路
Pa-portal(告警配置和管理页面) -> Mysql(核心库保存来自pa-portal的相关配置) <- Config(同步mysql库中最新的配置信息) <- Hbs(从config模块获取最新配置信息,并接收ping,agent模块上报心跳信息) <- [Ping/ (Proxy <- Agent)] 向hbs上报心跳
查询数据上报图表 Dashboard -> Mysql > Graph
告警 Hbs(告警策略:阈值、最大告警次数、告警级别) <- Transfer(从Hbs获取告警策略配置,过滤不合规数据) -> Judge(接收来自Transfer推送的数据和触发告警的配置策略,判断监控数据是否超阈值、是否达到告警条件,满足告警条件推送Redis缓存) -> Redis <- Sender(从Redis拉取告警项,根据告警级别推送相应级别的告警队列) -> Mail-provider(按告警级别通过不同渠道发送告警消息) -> Mail/Phone/SMS(邮件、电话、短信)
Open-Falcon 数据格式
{"endpoint": "test-endpoint", // 监控对象名称"metric": "test-metric", // 监控项"timestamp": ts, // unix时间戳"step": 60, // 步长,上报周期"value": 1, // 监控数据"counterType": "GAUGE", // 监控项类型"tags": "location=beijing,service=falcon", // 标签}
Agent模块主要采集主机性能指标,针对不同OS、不同体系结构,可以定制编译并适配相应版本
Transfer模块数据接入层,可接收用户主动上报的正确格式的推送数据,结合所配置的告警策略,实现自定义类型监控
Prometheus生态
Prometheus是什么?官方介绍
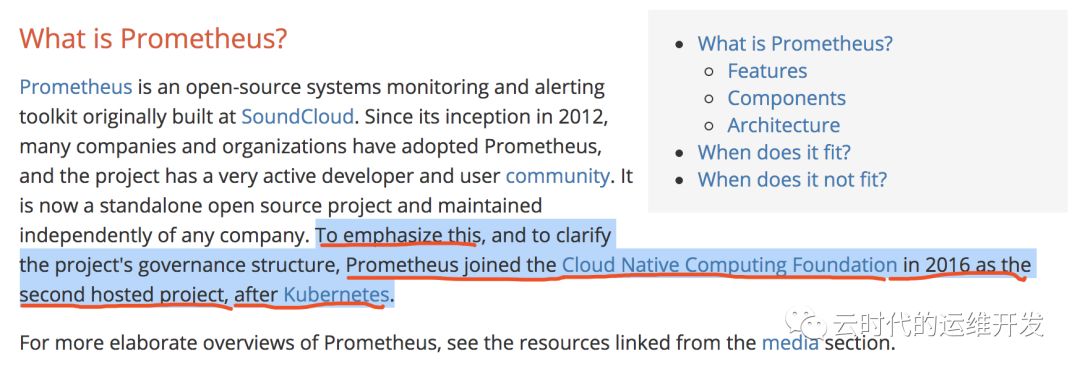
Prometheus是一套开源监控和告警系统工具包,许多公司和组织都在使用它,并且用户社区非常活跃,现在是一个独立的开源项目。强调:Prometheus于2016年加入CNCF,是继Kubernetes之后的第二个托管项目。Prometheus的在云原生领域的地位可见一斑
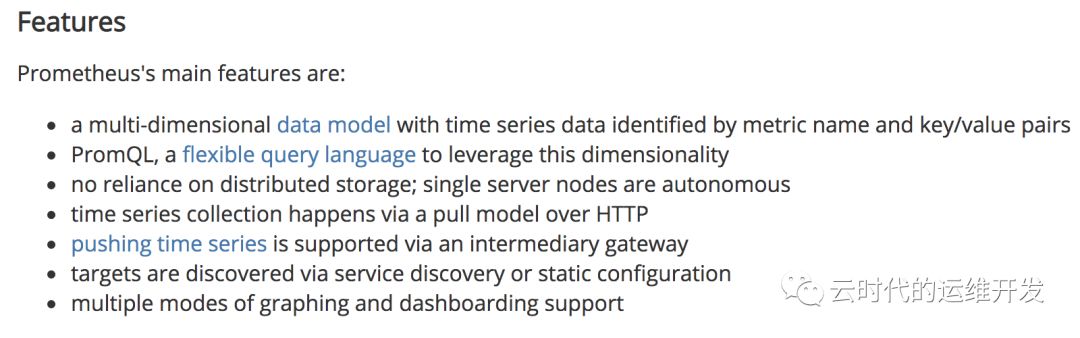
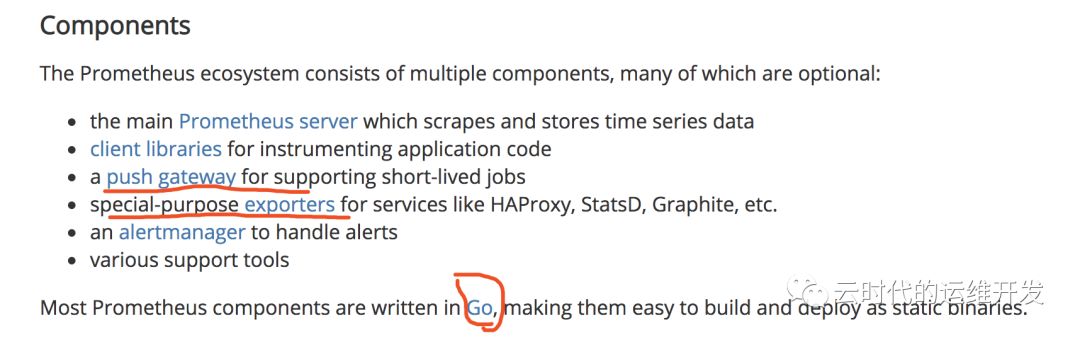
Prometheus的特性和组件,参照官方文档,不多赘述
Prometheus架构解析
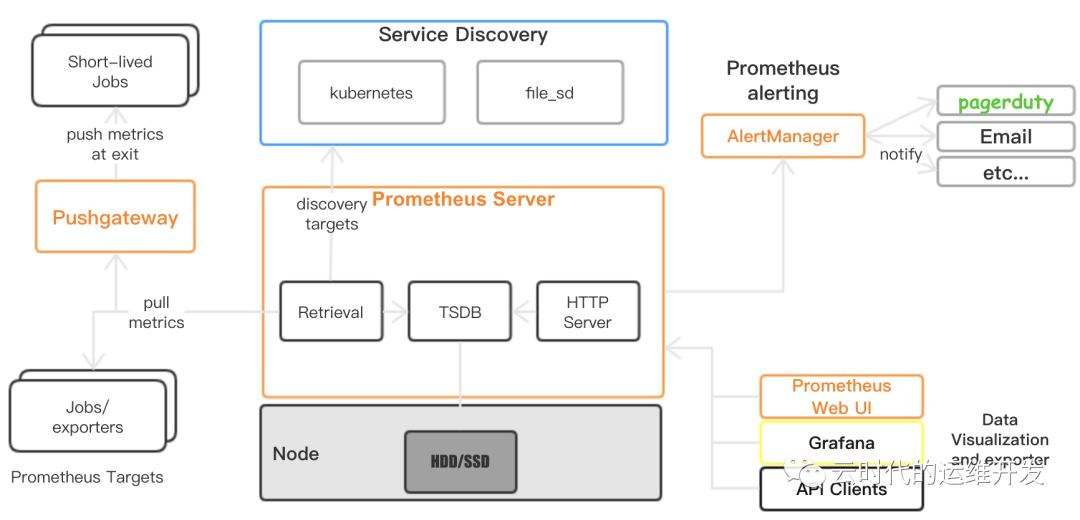
1.Prometheus Server 通过服务发现(Kubernetes、consule、zookeeper...)或静态文件配置获取到抓取目标Targets(通常是HTTP/HTTPS API接口)
2.定期(global config)主动Pull Metrics
3.存储到本地TSDB时序数据库(默认保存15天)
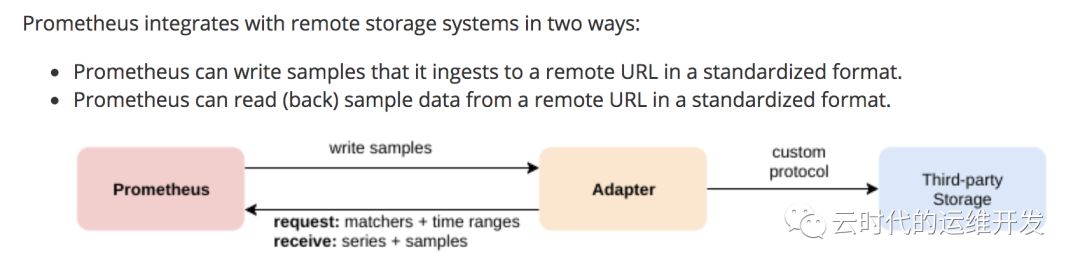
4.通过适配read/write接口支持第三方远程存储
5.若监控项触发告警,AlertManager可以多渠道发送告警通知
6.Prometheus提供HTTP查询接口,在数据可视化可以使用自带的Dashboard或Grafana工具,也支持API clients导出TSDB监控数据

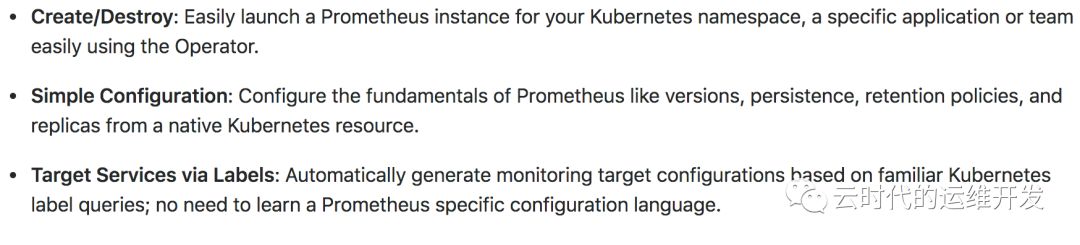
Prometheus 定义期望运行的Prometheus Deployments,Prometheus Operator始终确保正在运行的与资源定义匹配的Deployments
ServiceMonitor 以声明式方式指定应如何监视 Service Groups, Operator基于这个定义自动生成抓取配置文件
PrometheusRule 定义可以包含Prometheus报警规则和Recording(重定义监控项名称)规则的规则文件,由Prometheus实例加载,提供reload接口支持热加载
Alertmanager 定义所需的Alertmanager Deployment
Kubernetes、Prometheus、Prometheus Operator 工作方式
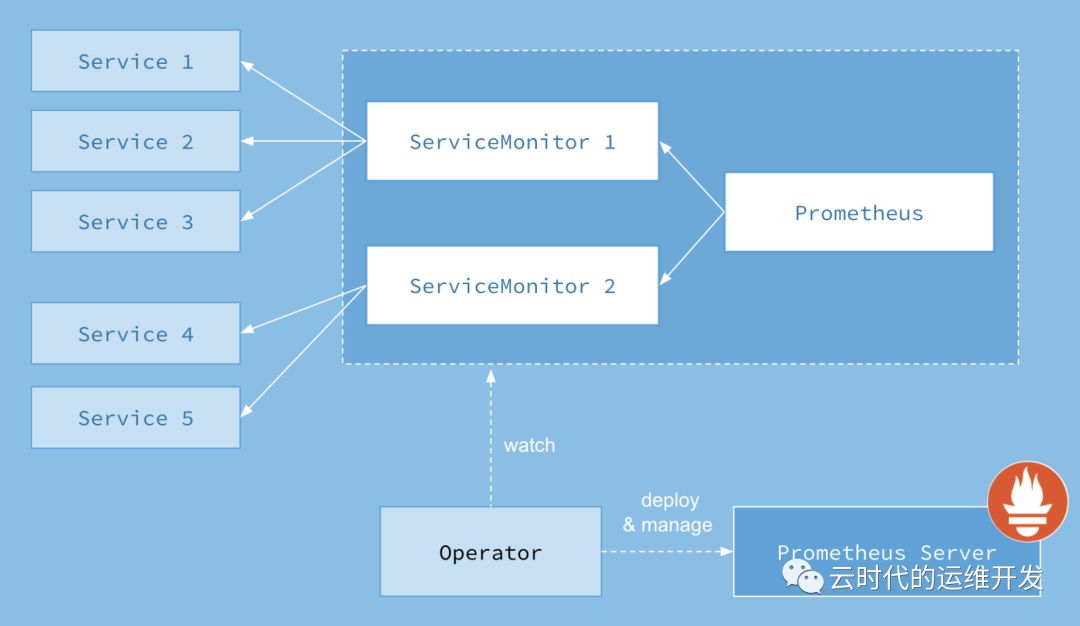
1.Kubernetes中每一个需要每监控的应用需要实现Prometheus Metrics API并创建Service实例
2.ServiceMonitor通过标签选择关联的Service(一个或多个),生成抓取配置文件,触发reload
3.Prometheus 相同 Namespace下的所有 ServiceMonitor 被当作 Prometheus Targets(Jobs),它根据配置在特定周期去指定路径 pull metrics
4.Prometheus Operator 通过 List 和 Watch 机制监视 Prometheus 及 ServiceMonitor 运行状态,部署管理 Prometheus Server
## https://github.com/coreos/prometheus-operator/blob/master/pkg/listwatch/listwatch.go// It allows for the creation of a cache.ListWatch for namespaces from a client that does not have `List` privileges.// If the slice of namespaces contains only v1.NamespaceAll, then this func assumes that the client has List and// Watch privileges and returns a regular cache.ListWatch, since there is no other way to get all namespaces.func NewUnprivilegedNamespaceListWatchFromClient(c cache.Getter, namespaces []string, fieldSelector fields.Selector) *cache.ListWatch {optionsModifier := func(options *metav1.ListOptions) {options.FieldSelector = fieldSelector.String()}return NewFilteredUnprivilegedNamespaceListWatchFromClient(c, namespaces, optionsModifier)}// It allows for the creation of a cache.ListWatch for namespaces from a client that does not have `List` privileges.// If the slice of namespaces contains only v1.NamespaceAll, then this func assumes that the client has List and// Watch privileges and returns a regular cache.ListWatch, since there is no other way to get all namespaces.func NewFilteredUnprivilegedNamespaceListWatchFromClient(c cache.Getter, namespaces []string, optionsModifier func(options *metav1.ListOptions)) *cache.ListWatch {// If the only namespace given is `v1.NamespaceAll`, then this// cache.ListWatch must be privileged. In this case, return a regular// cache.ListWatch.if IsAllNamespaces(namespaces) {return cache.NewFilteredListWatchFromClient(c, "namespaces", metav1.NamespaceAll, optionsModifier)}listFunc := func(options metav1.ListOptions) (runtime.Object, error) {optionsModifier(&options)list := &v1.NamespaceList{}for _, name := range namespaces {result := &v1.Namespace{}err := c.Get().Resource("namespaces").Name(name).VersionedParams(&options, scheme.ParameterCodec).Do().Into(result)if err != nil {return nil, err}list.Items = append(list.Items, *result)}return list, nil}watchFunc := func(_ metav1.ListOptions) (watch.Interface, error) {// Since the client does not have Watch privileges, do not// actually watch anything. Use a watch.FakeWatcher here to// implement watch.Interface but not send any events.return watch.NewFake(), nil}return &cache.ListWatch{ListFunc: listFunc, WatchFunc: watchFunc}}// MultiNamespaceListerWatcher takes a list of namespaces and a cache.ListerWatcher generator func and returns a single cache.ListerWatcher capable of operating on multiple namespaces.func MultiNamespaceListerWatcher(namespaces []string, f func(string) cache.ListerWatcher) cache.ListerWatcher {// If there is only one namespace then there is no need to create a proxy.if len(namespaces) == 1 {return f(namespaces[0])}var lws []cache.ListerWatcherfor _, n := range namespaces {lws = append(lws, f(n))}return multiListerWatcher(lws)}// multiListerWatcher abstracts several cache.ListerWatchers, allowing them to be treated as a single cache.ListerWatcher.type multiListerWatcher []cache.ListerWatcher// List 实现 ListerWatcher 接口。将所有ListerWatcher的List方法的输出结合成一个结果func (mlw multiListerWatcher) List(options metav1.ListOptions) (runtime.Object, error) {l := metav1.List{}var resourceVersions []stringfor _, lw := range mlw {list, err := lw.List(options)if err != nil {return nil, err}items, err := meta.ExtractList(list)if err != nil {return nil, err}metaObj, err := meta.ListAccessor(list)if err != nil {return nil, err}for _, item := range items {l.Items = append(l.Items, runtime.RawExtension{Object: item.DeepCopyObject()})}resourceVersions = append(resourceVersions, metaObj.GetResourceVersion())}// Combine the resource versions so that the composite Watch method can// distribute appropriate versions to each underlying Watch func.l.ListMeta.ResourceVersion = strings.Join(resourceVersions, "/")return &l, nil}// Watch实现ListWatcher接口。它将watch.Interface的每个cache.ListerWatcher的输出结合到一个结果chan中,返回一个 watch.Interfacefunc (mlw multiListerWatcher) Watch(options metav1.ListOptions) (watch.Interface, error) {resourceVersions := make([]string, len(mlw))// Allow resource versions to be "".if options.ResourceVersion != "" {rvs := strings.Split(options.ResourceVersion, "/")if len(rvs) != len(mlw) {return nil, fmt.Errorf("expected resource version to have %d parts to match the number of ListerWatchers", len(mlw))}resourceVersions = rvs}return newMultiWatch(mlw, resourceVersions, options)}// multiWatch abstracts multiple watch.Interface's, allowing them// to be treated as a single watch.Interface.type multiWatch struct {result chan watch.Eventstopped chan struct{}stoppers []func()}// newMultiWatch returns a new multiWatch or an error if one of the underlying// Watch funcs errored. The length of []cache.ListerWatcher and []string must// match.func newMultiWatch(lws []cache.ListerWatcher, resourceVersions []string, options metav1.ListOptions) (*multiWatch, error) {var (result = make(chan watch.Event)stopped = make(chan struct{})stoppers []func()wg sync.WaitGroup)wg.Add(len(lws))for i, lw := range lws {o := options.DeepCopy()o.ResourceVersion = resourceVersions[i]w, err := lw.Watch(*o)if err != nil {return nil, err}go func() {defer wg.Done()for {event, ok := <-w.ResultChan()if !ok {return}select {case result <- event:case <-stopped:return}}}()stoppers = append(stoppers, w.Stop)}// result chan must be closed,// once all event sender goroutines exited.go func() {wg.Wait()close(result)}()return &multiWatch{result: result,stoppers: stoppers,stopped: stopped,}, nil}// ResultChan implements the watch.Interface interface.func (mw *multiWatch) ResultChan() <-chan watch.Event {return mw.result}// Stop implements the watch.Interface interface.// It stops all of the underlying watch.Interfaces and closes the backing chan.// Can safely be called more than once.func (mw *multiWatch) Stop() {select {case <-mw.stopped:// nothing to do, we are already stoppeddefault:for _, stop := range mw.stoppers {stop()}close(mw.stopped)}return}// IsAllNamespaces checks if the given slice of namespaces// contains only v1.NamespaceAll.func IsAllNamespaces(namespaces []string) bool {return len(namespaces) == 1 && namespaces[0] == v1.NamespaceAll}
kubernetes容器监控
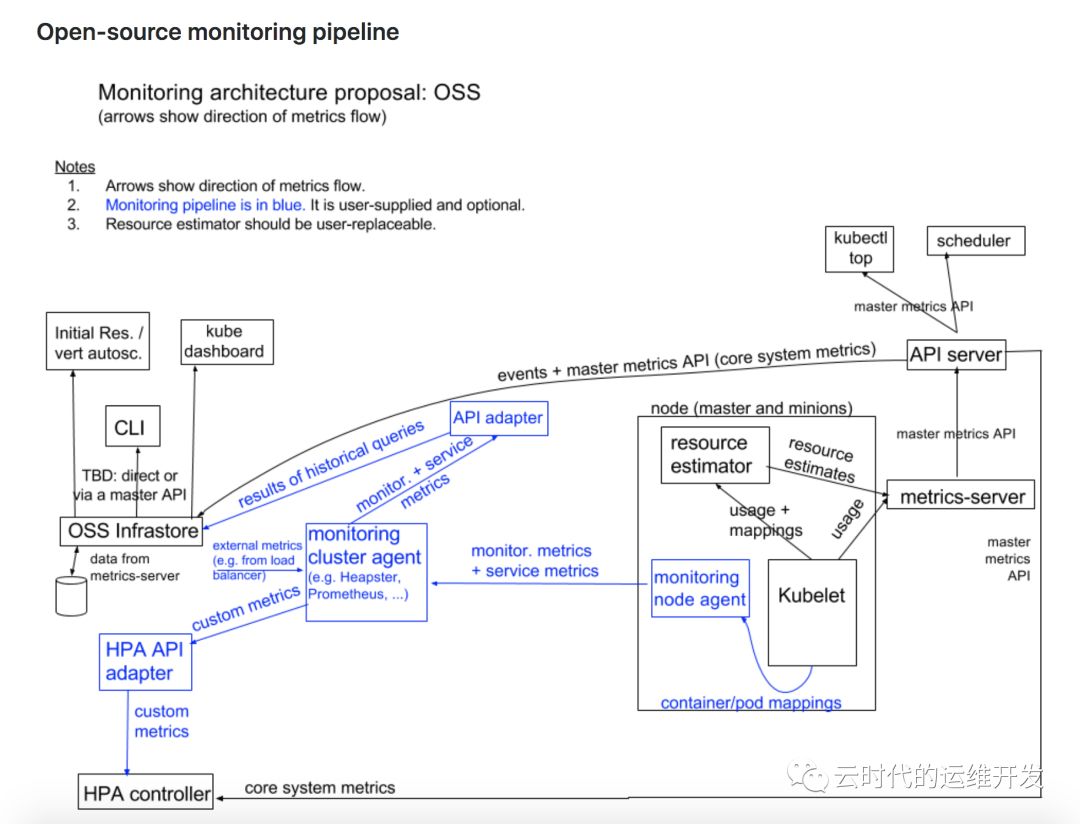
Kubernetes集群收集监控统计信息的两个管道
The resource metrics pipeline 提供与集群组件相关的一组有限度量标准
Full metrics pipeline 监视管道从kubelet获取指标,然后通过实现 custom.metrics.k8s.io 或 external.metrics.k8s.io API适配器,将metrics暴露给Kubernetes。在Kubernetes中有多种解决方案,e.g. Prometheus, Sysdig
Kubernetes监控架构
核心度量流程(下图黑色部分):这是 Kubernetes 正常工作所需要的核心度量,从 Kubelet、cAdvisor 等获取度量数据,再由 metrics-server 提供给 Dashboard、HPA 控制器等使用。
监控流程(下图蓝色部分):基于核心度量构建的监控流程,比如 Prometheus 可以从 metrics-server 获取核心度量,从其他数据源(如 Node Exporter 等)获取非核心度量,再基于它们构建监控告警系统
相关监控组件及工作方式
1.kubelet 与 cAdvisor
kubelet 是 Kubernetes Master 和 Worker Node 之间的桥梁,从kube-apiserver获取调度到节点上的Pod根据其podSpec将其运行起来,如以Docker提供容器运行时环境,kubelet从cAdvisor获取单个容器运行资源使用情况统计信息
cAdvisor 是一个开源容器资源使用和性能分析代理,支持Docker容器,被集成到kubelet二进制文件中。cAdvisor自动发现机器中所有容器,并收集cpu、memory、network、diskIO使用情况统计信息,还用过分析机器上的"root"容器来提供整机资源使用情况
部分源代码
// kubernetes/pkg/kubelet/kubelet.go kubelet依赖项定义type Dependencies struct {Options []Option// Injected DependenciesAuth server.AuthInterfaceCAdvisorInterface cadvisor.Interface // cAdvisorCloud cloudprovider.InterfaceContainerManager cm.ContainerManagerDockerClientConfig *dockershim.ClientConfigEventClient v1core.EventsGetterHeartbeatClient clientset.InterfaceOnHeartbeatFailure func()KubeClient clientset.InterfaceMounter mount.InterfaceOOMAdjuster *oom.OOMAdjusterOSInterface kubecontainer.OSInterfacePodConfig *config.PodConfigRecorder record.EventRecorderSubpather subpath.InterfaceVolumePlugins []volume.VolumePluginDynamicPluginProber volume.DynamicPluginProberTLSOptions *server.TLSOptionsKubeletConfigController *kubeletconfig.Controller}// kubelet.go 从 cAdvisor 获取 MachineInfo, 代码 570~574 行machineInfo, err := klet.cadvisor.MachineInfo()if err != nil {return nil, err}klet.machineInfo = machineInfo// cAdvisor Interface kubernetes/pkg/kubelet/cadvisor/types.gotype Interface interface {Start() errorDockerContainer(name string, req *cadvisorapi.ContainerInfoRequest) (cadvisorapi.ContainerInfo, error)ContainerInfo(name string, req *cadvisorapi.ContainerInfoRequest) (*cadvisorapi.ContainerInfo, error)ContainerInfoV2(name string, options cadvisorapiv2.RequestOptions) (map[string]cadvisorapiv2.ContainerInfo, error)SubcontainerInfo(name string, req *cadvisorapi.ContainerInfoRequest) (map[string]*cadvisorapi.ContainerInfo, error)MachineInfo() (*cadvisorapi.MachineInfo, error) // MachineInfo InterfaceVersionInfo() (*cadvisorapi.VersionInfo, error)// Returns usage information about the filesystem holding container images.ImagesFsInfo() (cadvisorapiv2.FsInfo, error)// Returns usage information about the root filesystem.RootFsInfo() (cadvisorapiv2.FsInfo, error)// Get events streamed through passedChannel that fit the request.WatchEvents(request *events.Request) (*events.EventChannel, error)// Get filesystem information for the filesystem that contains the given file.GetDirFsInfo(path string) (cadvisorapiv2.FsInfo, error)}// ImageFsInfoProvider informs cAdvisor how to find imagefs for container images.type ImageFsInfoProvider interface {// ImageFsInfoLabel returns the label cAdvisor should use to find the filesystem holding container images.ImageFsInfoLabel() (string, error)}// kubernetes/pkg/kubelet/cadvisor/cadvisor_linux.go 定义了 cadvisor 所包含的监控项type cadvisorClient struct {imageFsInfoProvider ImageFsInfoProviderrootPath stringmanager.Manager}var _ Interface = new(cadvisorClient)// TODO(vmarmol): Make configurable.// The amount of time for which to keep stats in memory.const statsCacheDuration = 2 * time.Minuteconst maxHousekeepingInterval = 15 * time.Secondconst defaultHousekeepingInterval = 10 * time.Secondconst allowDynamicHousekeeping = truefunc init() {// Override cAdvisor flag defaults.flagOverrides := map[string]string{// Override the default cAdvisor housekeeping interval."housekeeping_interval": defaultHousekeepingInterval.String(),// Disable event storage by default."event_storage_event_limit": "default=0","event_storage_age_limit": "default=0",}for name, defaultValue := range flagOverrides {if f := flag.Lookup(name); f != nil {f.DefValue = defaultValuef.Value.Set(defaultValue)} else {klog.Errorf("Expected cAdvisor flag %q not found", name)}}}func New(imageFsInfoProvider ImageFsInfoProvider, rootPath string, usingLegacyStats bool) (Interface, error) {sysFs := sysfs.NewRealSysFs()// 包含监控项类型: cpu, memory, cpuLoad, diskIO, network, accelerator, appincludedMetrics := cadvisormetrics.MetricSet{cadvisormetrics.CpuUsageMetrics: struct{}{},cadvisormetrics.MemoryUsageMetrics: struct{}{},cadvisormetrics.CpuLoadMetrics: struct{}{},cadvisormetrics.DiskIOMetrics: struct{}{},cadvisormetrics.NetworkUsageMetrics: struct{}{},cadvisormetrics.AcceleratorUsageMetrics: struct{}{},cadvisormetrics.AppMetrics: struct{}{},}if usingLegacyStats {includedMetrics[cadvisormetrics.DiskUsageMetrics] = struct{}{}}// collect metrics for all cgroupsrawContainerCgroupPathPrefixWhiteList := []string{"/"}// Create and start the cAdvisor container manager.m, err := manager.New(memory.New(statsCacheDuration, nil), sysFs, maxHousekeepingInterval, allowDynamicHousekeeping, includedMetrics, http.DefaultClient, rawContainerCgroupPathPrefixWhiteList)if err != nil {return nil, err}if _, err := os.Stat(rootPath); err != nil {if os.IsNotExist(err) {if err := os.MkdirAll(path.Clean(rootPath), 0750); err != nil {return nil, fmt.Errorf("error creating root directory %q: %v", rootPath, err)}} else {return nil, fmt.Errorf("failed to Stat %q: %v", rootPath, err)}}cadvisorClient := &cadvisorClient{imageFsInfoProvider: imageFsInfoProvider,rootPath: rootPath,Manager: m,}return cadvisorClient, nil}// MachineInfo 结构体type MachineInfo struct {// The number of cores in this machine.NumCores int `json:"num_cores"`// Maximum clock speed for the cores, in KHz.CpuFrequency uint64 `json:"cpu_frequency_khz"`// The amount of memory (in bytes) in this machineMemoryCapacity uint64 `json:"memory_capacity"`// HugePages on this machine.HugePages []HugePagesInfo `json:"hugepages"`// The machine idMachineID string `json:"machine_id"`// The system uuidSystemUUID string `json:"system_uuid"`// The boot idBootID string `json:"boot_id"`// Filesystems on this machine.Filesystems []FsInfo `json:"filesystems"`// Disk mapDiskMap map[string]DiskInfo `json:"disk_map"`// Network devicesNetworkDevices []NetInfo `json:"network_devices"`// Machine Topology// Describes cpu/memory layout and hierarchy.Topology []Node `json:"topology"`// Cloud provider the machine belongs to.CloudProvider CloudProvider `json:"cloud_provider"`// Type of cloud instance (e.g. GCE standard) the machine is.InstanceType InstanceType `json:"instance_type"`// ID of cloud instance (e.g. instance-1) given to it by the cloud provider.InstanceID InstanceID `json:"instance_id"`}
2.Metrics Server前世今生
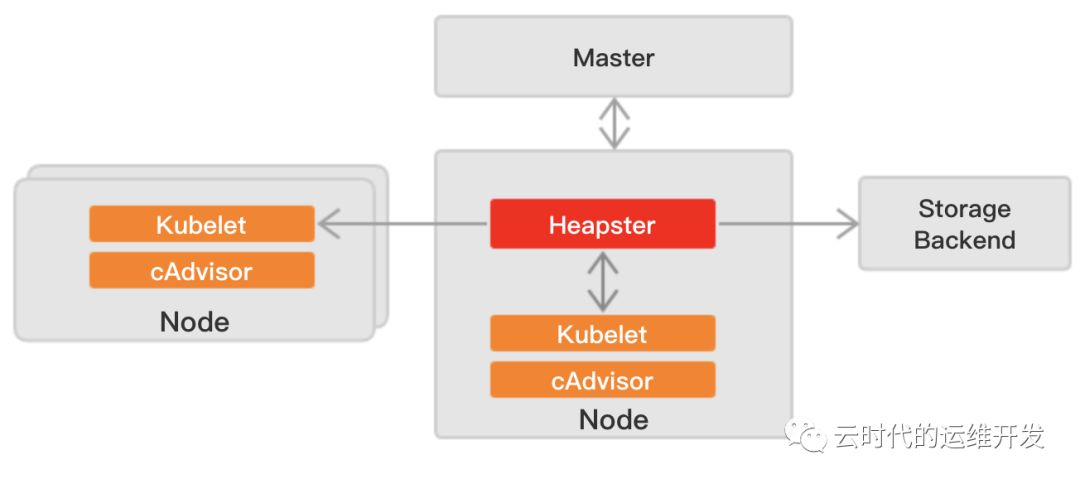
Heapster工作方式 首先从Master获取集群中所有Node的信息,然后通过Node上的kubelet获取cAdvisor采集的监控数据,heapster将所有获取到的时序监控数据推送到后端存储中,并且还支持数据的可视化
Kubernetes v1.8 开始,资源的使用情况可以通过 Metrics API的形式获取,由集群核心监控数据的聚合器--Metrics Server,替代原来的Heapster组件
Metrics server 定时从Kubelet的Summary API(/ap1/v1/nodes/nodename/stats/summary)采集指标信息,这些聚合过的数据将存储在内存中,且以metric-api的形式暴露出去
Metrics server复用api-server的库来实现自己的功能,比如鉴权、版本等,为了实现将数据存放在内存中,引入了内存存储(即实现Storage interface)。存放在内存中的监控数据是没有持久化的,可以通过第三方存储来拓展,这个和heapster是一致的
Metrics API 相比于之前的采集方式(heapster)是一种新思路,官方希望核心监控指标是稳定的、版本可控的,且可以直接被用户访问(`kubectl top`),或由集群中的控制器使用(e.g. HPA 自动扩缩),和其他Kubernetes APIs一样
Metrics API 的使用
Metrics API 只可以查询当前的度量数据,并不保存历史数据
Metrics API URI 为 /apis/metrics.k8s.io/,在 k8s.io/metrics 维护
必须部署 metrics-server 才能使用,metrics-server 通过调用 Kubelet Summary API 获取数据
examplehttp://127.0.0.1:8001/apis/metrics.k8s.io/v1beta1/nodeshttp://127.0.0.1:8001/apis/metrics.k8s.io/v1beta1/nodes/<node-name>http://127.0.0.1:8001/apis/metrics.k8s.io/v1beta1/namespace/<namespace-name>/pods/<pod-name>
3.kube-state-metrics
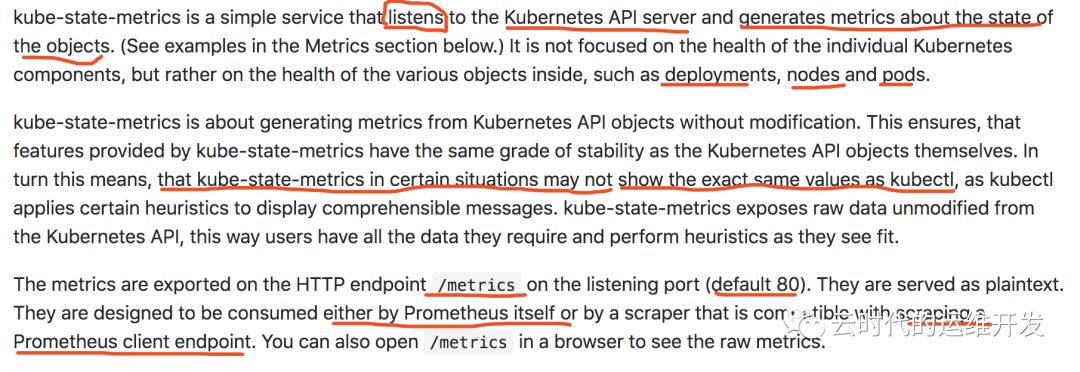
kube-state-metrics通过监控api-server生成对象监控指标,监控的维度是Objects,包括
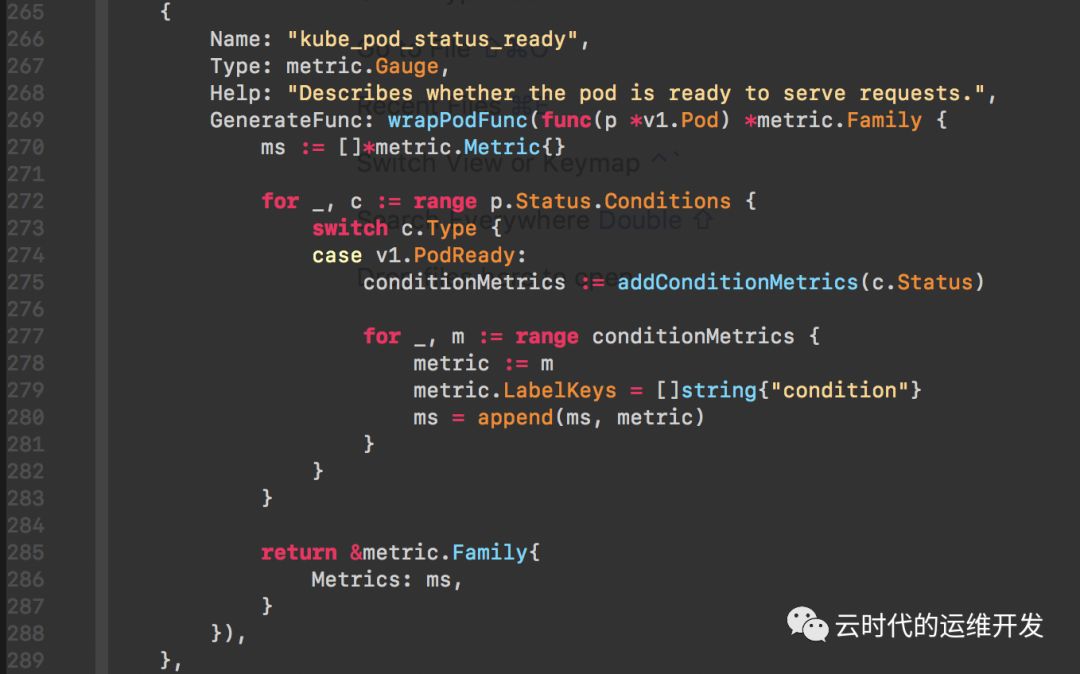
下图是pod.go定义的一个监控项
监控项名称: kube_pod_status_ready, 指标类型: GAUGE, Help:"xxx"(Prometheus规范,必填)
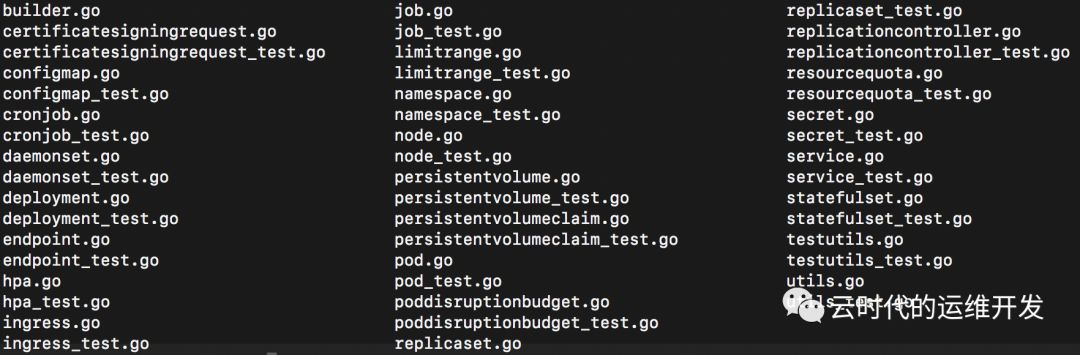
每一种 Objects 又分别定义哪些 metrics,如果感兴趣可以打开这部分源码
代码目录 kube-state-metrics/internal/collector
4.以上监控指标不能满足需求?
通过实现prometheus API,自定义exporter,根据业务所需扩展metrics
部署实践
接下来介绍prometheus-operator安装部署prometheus容器监控
1.下载 prometheus-operatorgit clone https://github.com/coreos/prometheus-operator.git2.manifests目录cd coreos/prometheus-operator/contrib/kube-prometheus/manifests3.目录下一共63各文件ls | wc -l4.可以直接一键安装 `kubectl create -f .`5.如果不清楚执行步骤4发生了什么,下面按字母顺序(手动部署建议顺序)一一介绍a.vim 00namespace-namespace.yaml 为后续操作创建了一个名叫 monitoring 的 namespaceb.前面介绍Prometheus自定义的4各CRD,分别对应文件0prometheus-operator-0alertmanagerCustomResourceDefinition.yaml0prometheus-operator-0prometheusCustomResourceDefinition.yaml0prometheus-operator-0prometheusruleCustomResourceDefinition.yaml0prometheus-operator-0servicemonitorCustomResourceDefinition.yamltips: CRD定义了些什么? 打开文件看看发现跟普通yaml文件神似?对了,每一个CRD定义一种资源,关于这个资源类型所有可配置的字段,都在CRD中体现,并且还有"description"释义c.部署prometheus-operator0prometheus-operator-serviceAccount.yaml0prometheus-operator-clusterRole.yaml0prometheus-operator-clusterRoleBinding.yaml0prometheus-operator-deployment.yaml0prometheus-operator-service.yaml0prometheus-operator-serviceMonitor.yaml资源对象大致按照 sa -> clusterRole -> clusterRoleBinding -> deployment -> svc -> servicemonitor 顺序创建打开文件 0prometheus-operator-serviceMonitor.yamlapiVersion: monitoring.coreos.com/v1 // API Groupkind: ServiceMonitor // CRD 类型metadata:labels:k8s-app: prometheus-operatorname: prometheus-operatornamespace: monitoringspec:endpoints: // 必须定义- honorLabels: trueport: httpselector:matchLabels:k8s-app: prometheus-operator // 根据标签选择同 namespace 下 Serviced.部署prometheusprometheus-serviceAccount.yamlprometheus-clusterRole.yamlprometheus-clusterRoleBinding.yamlprometheus-roleConfig.yamlprometheus-roleBindingConfig.yamlprometheus-roleSpecificNamespaces.yaml // 给 prometheus sa 跨 namespace 访问 API Resource 授权prometheus-roleBindingSpecificNamespaces.yamlprometheus-rules.yaml // prometheus规则文件,配置告警规则,Record规则prometheus-prometheus.yaml // prometheus deploymentprometheus-service.yamlprometheus-serviceMonitor.yamle.部署kube-state-metricskube-state-metrics-serviceAccount.yamlkube-state-metrics-clusterRole.yamlkube-state-metrics-clusterRoleBinding.yamlkube-state-metrics-role.yamlkube-state-metrics-roleBinding.yamlkube-state-metrics-deployment.yamlkube-state-metrics-service.yamlkube-state-metrics-serviceMonitor.yamlf.exporter部署,套路基本一致,以node-exporter为例node-exporter-serviceAccount.yamlnode-exporter-clusterRole.yamlnode-exporter-clusterRoleBinding.yamlnode-exporter-daemonset.yaml // 节点exporter比较特殊使用daemonset类型node-exporter-service.yamlnode-exporter-serviceMonitor.yamlg.集群组件监控vim prometheus-serviceMonitorApiserver.yaml // 若以镜像部署一个文件足以二进制部署,则需要根据环境配置endpoint创建service,创建servicemonitor关联svcexample endpoint.yamlapiVersion: v1kind: Endpointsmetadata:labels:k8s-app: kube-controller-managername: kube-controller-managernamespace: kube-systemsubsets:- addresses:- ip: 172.16.0.2- ip: 172.16.0.7- ip: 172.16.0.8ports:- name: http-metricsport: 10252protocol: TCP---apiVersion: v1kind: Endpointsmetadata:labels:k8s-app: kube-schedulername: kube-schedulernamespace: kube-systemsubsets:- addresses:- ip: 172.16.0.2- ip: 172.16.0.7- ip: 172.16.0.8ports:- name: http-metricsport: 10251protocol: TCPsvc.yamlapiVersion: v1kind: Servicemetadata:namespace: kube-systemname: kube-controller-managerlabels:k8s-app: kube-controller-managerspec:selector:component: kube-controller-managertype: ClusterIPclusterIP: Noneports:- name: http-metricsport: 10252targetPort: 10252protocol: TCP---apiVersion: v1kind: Servicemetadata:namespace: kube-systemname: kube-schedulerlabels:k8s-app: kube-schedulerspec:selector:component: kube-schedulertype: ClusterIPclusterIP: Noneports:- name: http-metricsport: 10251targetPort: 10251protocol: TCP
关于部署就介绍这么多,其他组件如果感兴趣可以进一步深入研究
小结
接下来的话题,每周更新
集群安全
网络 + Calico实践
存储 + CephFS实践
日志 + Fluentd & ElasticSearch实践
END