


下载安装Redis_exporter
cd /usr/local
wget https://github.com/oliver006/redis_exporter/releases/download/v1.0.3/redis_exporter-v1.0.3.linux-amd64.tar.gz
tar -zxvf redis_exporter-v1.0.3.linux-amd64.tar.gz
mv redis_exporter-v1.0.3.linux-amd64 redis_exporter
cd redis_exporter
启动
nohup ./redis_exporter -redis.addr 192.168.7.21:6379 192.168.7.21:6380 192.168.7.22:6379 192.168.7.22:6380 192.168.7.23:6379 192.168.7.23:6380 &复制
Prometheus配置
- job_name: 'redis-cluster'static_configs:- targets:- redis://192.168.7.21:6379- redis://192.168.7.21:6380- redis://192.168.7.22:6379- redis://192.168.7.22:6380- redis://192.168.7.23:6379- redis://192.168.7.23:6380metrics_path: /scrapeparams:check-keys: ["metrics:*"]relabel_configs:- source_labels: [__address__]target_label: __param_target- source_labels: [__param_target]target_label: instance- target_label: __address__replacement: 192.168.7.21:9121报警:############ redis cluster 监控 ############- alert: redis连接数超过1000expr: redis_connected_clients > 1000for: 2mlabels:status: 监控redis连接数annotations:description: "{{$labels.instance}}: 当前客户端连接数量为{{ $value }}"summary: "redis连接数超过1000"复制
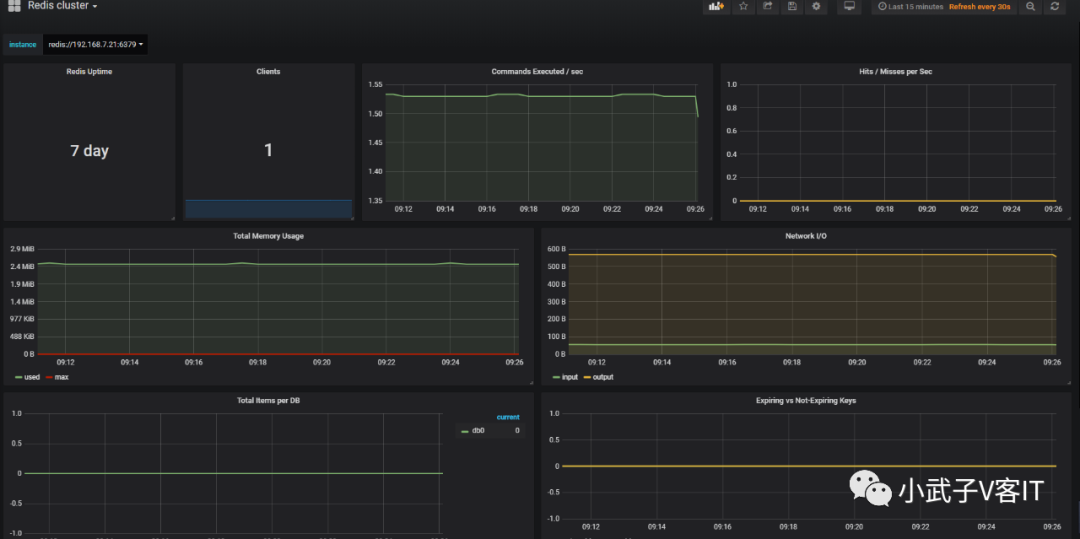
grafana导入模板
{"__inputs": [{"name": "DS_PROMETHEUS","label": "Prometheus","description": "","type": "datasource","pluginId": "prometheus","pluginName": "Prometheus"}],"__requires": [{"type": "grafana","id": "grafana","name": "Grafana","version": "5.4.3"},{"type": "panel","id": "graph","name": "Graph","version": "5.0.0"},{"type": "datasource","id": "prometheus","name": "Prometheus","version": "5.0.0"},{"type": "panel","id": "singlestat","name": "Singlestat","version": "5.0.0"}],"annotations": {"list": [{"builtIn": 1,"datasource": "-- Grafana --","enable": true,"hide": true,"iconColor": "rgba(0, 211, 255, 1)","name": "Annotations & Alerts","type": "dashboard"}]},"description": "Prometheus dashboard for Redis servers","editable": true,"gnetId": 2751,"graphTooltip": 0,"id": null,"iteration": 1564967488877,"links": [],"panels": [{"cacheTimeout": null,"colorBackground": false,"colorValue": false,"colors": ["rgba(41, 200, 35, 0.97)","rgba(237, 129, 40, 0.89)","rgba(245, 54, 54, 0.9)"],"datasource": "${DS_PROMETHEUS}","decimals": 0,"editable": true,"error": false,"format": "s","gauge": {"maxValue": 100,"minValue": 0,"show": false,"thresholdLabels": false,"thresholdMarkers": true},"gridPos": {"h": 7,"w": 4,"x": 0,"y": 0},"id": 9,"interval": null,"isNew": true,"links": [],"mappingType": 1,"mappingTypes": [{"name": "value to text","value": 1},{"name": "range to text","value": 2}],"maxDataPoints": 100,"nullPointMode": "connected","nullText": null,"postfix": "","postfixFontSize": "50%","prefix": "","prefixFontSize": "50%","rangeMaps": [{"from": "null","text": "N/A","to": "null"}],"sparkline": {"fillColor": "rgba(31, 118, 189, 0.18)","full": false,"lineColor": "rgb(31, 120, 193)","show": false},"tableColumn": "__name__","targets": [{"expr": "redis_uptime_in_seconds{instance=\"$instance\"}","format": "time_series","interval": "","intervalFactor": 2,"legendFormat": "","metric": "","refId": "A","step": 1800}],"thresholds": "","title": "Redis Uptime","type": "singlestat","valueFontSize": "70%","valueMaps": [{"op": "=","text": "N/A","value": "null"}],"valueName": "avg"},{"cacheTimeout": null,"colorBackground": false,"colorValue": false,"colors": ["rgba(245, 54, 54, 0.9)","rgba(237, 129, 40, 0.89)","rgba(50, 172, 45, 0.97)"],"datasource": "${DS_PROMETHEUS}","decimals": 0,"editable": true,"error": false,"format": "none","gauge": {"maxValue": 100,"minValue": 0,"show": false,"thresholdLabels": false,"thresholdMarkers": true},"gridPos": {"h": 7,"w": 4,"x": 4,"y": 0},"hideTimeOverride": true,"id": 12,"interval": null,"isNew": true,"links": [],"mappingType": 1,"mappingTypes": [{"name": "value to text","value": 1},{"name": "range to text","value": 2}],"maxDataPoints": 100,"nullPointMode": "connected","nullText": null,"postfix": "","postfixFontSize": "50%","prefix": "","prefixFontSize": "50%","rangeMaps": [{"from": "null","text": "N/A","to": "null"}],"sparkline": {"fillColor": "rgba(31, 118, 189, 0.18)","full": false,"lineColor": "rgb(31, 120, 193)","show": true},"tableColumn": "","targets": [{"expr": "redis_connected_clients{instance=\"$instance\"}","format": "time_series","intervalFactor": 2,"legendFormat": "","metric": "","refId": "A","step": 2}],"thresholds": "","timeFrom": "1m","timeShift": null,"title": "Clients","type": "singlestat","valueFontSize": "80%","valueMaps": [{"op": "=","text": "N/A","value": "null"}],"valueName": "current"},{"aliasColors": {},"bars": false,"dashLength": 10,"dashes": false,"datasource": "${DS_PROMETHEUS}","editable": true,"error": false,"fill": 1,"grid": {},"gridPos": {"h": 7,"w": 8,"x": 8,"y": 0},"id": 2,"isNew": true,"legend": {"avg": false,"current": false,"max": false,"min": false,"show": false,"total": false,"values": false},"lines": true,"linewidth": 2,"links": [],"nullPointMode": "connected","percentage": false,"pointradius": 5,"points": false,"renderer": "flot","seriesOverrides": [],"spaceLength": 10,"stack": false,"steppedLine": false,"targets": [{"expr": "rate(redis_commands_processed_total{instance=~\"$instance\"}[5m])","format": "time_series","interval": "","intervalFactor": 2,"legendFormat": "","metric": "A","refId": "A","step": 240,"target": ""}],"thresholds": [],"timeFrom": null,"timeRegions": [],"timeShift": null,"title": "Commands Executed / sec","tooltip": {"msResolution": false,"shared": true,"sort": 0,"value_type": "cumulative"},"type": "graph","xaxis": {"buckets": null,"mode": "time","name": null,"show": true,"values": []},"yaxes": [{"format": "short","label": null,"logBase": 1,"max": null,"min": null,"show": true},{"format": "short","label": null,"logBase": 1,"max": null,"min": null,"show": true}],"yaxis": {"align": false,"alignLevel": null}},{"aliasColors": {},"bars": false,"dashLength": 10,"dashes": false,"datasource": "${DS_PROMETHEUS}","decimals": 2,"editable": true,"error": false,"fill": 1,"grid": {},"gridPos": {"h": 7,"w": 8,"x": 16,"y": 0},"id": 1,"isNew": true,"legend": {"avg": false,"current": false,"max": false,"min": false,"show": false,"total": false,"values": false},"lines": true,"linewidth": 2,"links": [],"nullPointMode": "connected","percentage": true,"pointradius": 5,"points": false,"renderer": "flot","seriesOverrides": [],"spaceLength": 10,"stack": false,"steppedLine": false,"targets": [{"expr": "irate(redis_keyspace_hits_total{instance=\"$instance\"}[5m])","format": "time_series","hide": false,"interval": "","intervalFactor": 2,"legendFormat": "hits","metric": "","refId": "A","step": 240,"target": ""},{"expr": "irate(redis_keyspace_misses_total{instance=\"$instance\"}[5m])","format": "time_series","hide": false,"interval": "","intervalFactor": 2,"legendFormat": "misses","metric": "","refId": "B","step": 240,"target": ""}],"thresholds": [],"timeFrom": null,"timeRegions": [],"timeShift": null,"title": "Hits / Misses per Sec","tooltip": {"msResolution": false,"shared": true,"sort": 0,"value_type": "individual"},"type": "graph","xaxis": {"buckets": null,"mode": "time","name": null,"show": true,"values": []},"yaxes": [{"format": "short","label": "","logBase": 1,"max": null,"min": 0,"show": true},{"format": "short","label": null,"logBase": 1,"max": null,"min": null,"show": true}],"yaxis": {"align": false,"alignLevel": null}},{"aliasColors": {"max": "#BF1B00"},"bars": false,"dashLength": 10,"dashes": false,"datasource": "${DS_PROMETHEUS}","editable": true,"error": false,"fill": 1,"grid": {},"gridPos": {"h": 7,"w": 12,"x": 0,"y": 7},"id": 7,"isNew": true,"legend": {"avg": false,"current": false,"hideEmpty": false,"hideZero": false,"max": false,"min": false,"show": true,"total": false,"values": false},"lines": true,"linewidth": 2,"links": [],"nullPointMode": "null as zero","percentage": false,"pointradius": 5,"points": false,"renderer": "flot","seriesOverrides": [],"spaceLength": 10,"stack": false,"steppedLine": false,"targets": [{"expr": "redis_memory_used_bytes{instance=~\"$instance\"} ","format": "time_series","intervalFactor": 2,"legendFormat": "used","metric": "","refId": "A","step": 240,"target": ""},{"expr": "redis_config_maxmemory{instance=~\"$instance\"} ","format": "time_series","hide": false,"intervalFactor": 2,"legendFormat": "max","refId": "B","step": 240}],"thresholds": [],"timeFrom": null,"timeRegions": [],"timeShift": null,"title": "Total Memory Usage","tooltip": {"msResolution": false,"shared": true,"sort": 0,"value_type": "cumulative"},"type": "graph","xaxis": {"buckets": null,"mode": "time","name": null,"show": true,"values": []},"yaxes": [{"format": "bytes","label": null,"logBase": 1,"max": null,"min": 0,"show": true},{"format": "short","label": null,"logBase": 1,"max": null,"min": null,"show": true}],"yaxis": {"align": false,"alignLevel": null}},{"aliasColors": {},"bars": false,"dashLength": 10,"dashes": false,"datasource": "${DS_PROMETHEUS}","editable": true,"error": false,"fill": 1,"grid": {},"gridPos": {"h": 7,"w": 12,"x": 12,"y": 7},"id": 10,"isNew": true,"legend": {"avg": false,"current": false,"max": false,"min": false,"show": true,"total": false,"values": false},"lines": true,"linewidth": 2,"links": [],"nullPointMode": "connected","percentage": false,"pointradius": 5,"points": false,"renderer": "flot","seriesOverrides": [],"spaceLength": 10,"stack": false,"steppedLine": false,"targets": [{"expr": "rate(redis_net_input_bytes_total{instance=\"$instance\"}[5m])","format": "time_series","intervalFactor": 2,"legendFormat": "{{ input }}","refId": "A","step": 240},{"expr": "rate(redis_net_output_bytes_total{instance=\"$instance\"}[5m])","format": "time_series","interval": "","intervalFactor": 2,"legendFormat": "{{ output }}","refId": "B","step": 240}],"thresholds": [],"timeFrom": null,"timeRegions": [],"timeShift": null,"title": "Network I/O","tooltip": {"msResolution": true,"shared": true,"sort": 0,"value_type": "cumulative"},"type": "graph","xaxis": {"buckets": null,"mode": "time","name": null,"show": true,"values": []},"yaxes": [{"format": "bytes","label": null,"logBase": 1,"max": null,"min": null,"show": true},{"format": "short","label": null,"logBase": 1,"max": null,"min": null,"show": true}],"yaxis": {"align": false,"alignLevel": null}},{"aliasColors": {},"bars": false,"dashLength": 10,"dashes": false,"datasource": "${DS_PROMETHEUS}","editable": true,"error": false,"fill": 7,"grid": {},"gridPos": {"h": 7,"w": 12,"x": 0,"y": 14},"id": 5,"isNew": true,"legend": {"alignAsTable": true,"avg": false,"current": true,"max": false,"min": false,"rightSide": true,"show": true,"total": false,"values": true},"lines": true,"linewidth": 2,"links": [],"nullPointMode": "connected","percentage": false,"pointradius": 5,"points": false,"renderer": "flot","seriesOverrides": [],"spaceLength": 10,"stack": true,"steppedLine": false,"targets": [{"expr": "sum (redis_db_keys{instance=~\"$instance\"}) by (db)","format": "time_series","interval": "","intervalFactor": 2,"legendFormat": "{{ db }} ","refId": "A","step": 240,"target": ""}],"thresholds": [],"timeFrom": null,"timeRegions": [],"timeShift": null,"title": "Total Items per DB","tooltip": {"msResolution": false,"shared": true,"sort": 0,"value_type": "individual"},"type": "graph","xaxis": {"buckets": null,"mode": "time","name": null,"show": true,"values": []},"yaxes": [{"format": "none","label": null,"logBase": 1,"max": null,"min": null,"show": true},{"format": "short","label": null,"logBase": 1,"max": null,"min": null,"show": true}],"yaxis": {"align": false,"alignLevel": null}},{"aliasColors": {},"bars": false,"dashLength": 10,"dashes": false,"datasource": "${DS_PROMETHEUS}","editable": true,"error": false,"fill": 7,"grid": {},"gridPos": {"h": 7,"w": 12,"x": 12,"y": 14},"id": 13,"isNew": true,"legend": {"avg": false,"current": false,"max": false,"min": false,"show": true,"total": false,"values": false},"lines": true,"linewidth": 2,"links": [],"nullPointMode": "connected","percentage": false,"pointradius": 5,"points": false,"renderer": "flot","seriesOverrides": [],"spaceLength": 10,"stack": true,"steppedLine": false,"targets": [{"expr": "sum (redis_db_keys{instance=~\"$instance\"}) - sum (redis_db_keys_expiring{instance=~\"$instance\"}) ","format": "time_series","interval": "","intervalFactor": 2,"legendFormat": "not expiring","refId": "A","step": 240,"target": ""},{"expr": "sum (redis_db_keys_expiring{instance=~\"$instance\"}) ","format": "time_series","interval": "","intervalFactor": 2,"legendFormat": "expiring","metric": "","refId": "B","step": 240}],"thresholds": [],"timeFrom": null,"timeRegions": [],"timeShift": null,"title": "Expiring vs Not-Expiring Keys","tooltip": {"msResolution": false,"shared": true,"sort": 0,"value_type": "individual"},"type": "graph","xaxis": {"buckets": null,"mode": "time","name": null,"show": true,"values": []},"yaxes": [{"format": "short","label": null,"logBase": 1,"max": null,"min": null,"show": true},{"format": "short","label": null,"logBase": 1,"max": null,"min": null,"show": true}],"yaxis": {"align": false,"alignLevel": null}},{"aliasColors": {"evicts": "#890F02","memcached_items_evicted_total{instance=\"172.17.0.1:9150\",job=\"prometheus\"}": "#890F02","reclaims": "#3F6833"},"bars": false,"dashLength": 10,"dashes": false,"datasource": "${DS_PROMETHEUS}","editable": true,"error": false,"fill": 1,"grid": {},"gridPos": {"h": 7,"w": 12,"x": 0,"y": 21},"id": 8,"isNew": true,"legend": {"avg": false,"current": false,"max": false,"min": false,"show": true,"total": false,"values": false},"lines": true,"linewidth": 2,"links": [],"nullPointMode": "connected","percentage": false,"pointradius": 5,"points": false,"renderer": "flot","seriesOverrides": [{"alias": "reclaims","yaxis": 2}],"spaceLength": 10,"stack": false,"steppedLine": false,"targets": [{"expr": "sum(rate(redis_expired_keys_total{instance=~\"$instance\"}[5m])) by (instance)","format": "time_series","interval": "","intervalFactor": 2,"legendFormat": "expired","metric": "","refId": "A","step": 240,"target": ""},{"expr": "sum(rate(redis_evicted_keys_total{instance=~\"$instance\"}[5m])) by (instance)","format": "time_series","interval": "","intervalFactor": 2,"legendFormat": "evicted","refId": "B","step": 240}],"thresholds": [],"timeFrom": null,"timeRegions": [],"timeShift": null,"title": "Expired / Evicted","tooltip": {"msResolution": false,"shared": true,"sort": 0,"value_type": "cumulative"},"type": "graph","xaxis": {"buckets": null,"mode": "time","name": null,"show": true,"values": []},"yaxes": [{"format": "short","label": null,"logBase": 1,"max": null,"min": null,"show": true},{"format": "short","label": null,"logBase": 1,"max": null,"min": null,"show": true}],"yaxis": {"align": false,"alignLevel": null}},{"aliasColors": {},"bars": false,"dashLength": 10,"dashes": false,"datasource": "${DS_PROMETHEUS}","editable": true,"error": false,"fill": 8,"grid": {},"gridPos": {"h": 7,"w": 12,"x": 12,"y": 21},"id": 14,"isNew": true,"legend": {"avg": false,"current": false,"max": false,"min": false,"show": true,"total": false,"values": false},"lines": true,"linewidth": 1,"links": [],"nullPointMode": "connected","percentage": false,"pointradius": 5,"points": false,"renderer": "flot","seriesOverrides": [],"spaceLength": 10,"stack": true,"steppedLine": false,"targets": [{"expr": "topk(5, irate(redis_commands_duration_seconds_total{instance=~\"$instance\"} [1m]))","format": "time_series","interval": "","intervalFactor": 2,"legendFormat": "{{ cmd }}","metric": "redis_command_calls_total","refId": "A","step": 240}],"thresholds": [],"timeFrom": null,"timeRegions": [],"timeShift": null,"title": "Command Calls / sec","tooltip": {"msResolution": true,"shared": true,"sort": 0,"value_type": "cumulative"},"type": "graph","xaxis": {"buckets": null,"mode": "time","name": null,"show": true,"values": []},"yaxes": [{"format": "short","label": null,"logBase": 1,"max": null,"min": null,"show": true},{"format": "short","label": null,"logBase": 1,"max": null,"min": null,"show": true}],"yaxis": {"align": false,"alignLevel": null}}],"refresh": "30s","schemaVersion": 16,"style": "dark","tags": ["prometheus","redis"],"templating": {"list": [{"allValue": null,"current": {},"datasource": "${DS_PROMETHEUS}","definition": "label_values(redis_connected_clients, instance)","hide": 0,"includeAll": false,"label": null,"multi": false,"name": "instance","options": [],"query": "label_values(redis_connected_clients, instance)","refresh": 1,"regex": "","skipUrlSync": false,"sort": 0,"tagValuesQuery": "","tags": [],"tagsQuery": "","type": "query","useTags": false}]},"time": {"from": "now-15m","to": "now"},"timepicker": {"refresh_intervals": ["5s","10s","30s","1m","5m","15m","30m","1h","2h","1d"],"time_options": ["5m","15m","1h","6h","12h","24h","2d","7d","30d"]},"timezone": "browser","title": "Redis cluster","uid": "ekHEbFvWk","version": 9}复制
文章转载自云原生数字化,如果涉嫌侵权,请发送邮件至:contact@modb.pro进行举报,并提供相关证据,一经查实,墨天轮将立刻删除相关内容。
评论
相关阅读
2025年4月中国数据库流行度排行榜:OB高分复登顶,崖山稳驭撼十强
墨天轮编辑部
2319次阅读
2025-04-09 15:33:27
数据库国产化替代深化:DBA的机遇与挑战
代晓磊
1073次阅读
2025-04-27 16:53:22
2025年3月国产数据库中标情况一览:TDSQL大单622万、GaussDB大单581万……
通讯员
665次阅读
2025-04-10 15:35:48
数据库,没有关税却有壁垒
多明戈教你玩狼人杀
536次阅读
2025-04-11 09:38:42
国产数据库需要扩大场景覆盖面才能在竞争中更有优势
白鳝的洞穴
512次阅读
2025-04-14 09:40:20
最近我为什么不写评论国产数据库的文章了
白鳝的洞穴
473次阅读
2025-04-07 09:44:54
【活动】分享你的压箱底干货文档,三篇解锁进阶奖励!
墨天轮编辑部
430次阅读
2025-04-17 17:02:24
2025年4月国产数据库中标情况一览:4个千万元级项目,GaussDB与OceanBase大放异彩!
通讯员
422次阅读
2025-04-30 15:24:06
天津市政府数据库框采结果公布,7家数据库产品入选!
通讯员
405次阅读
2025-04-10 12:32:35
优炫数据库成功入围新疆维吾尔自治区行政事业单位数据库2025年框架协议采购!
优炫软件
349次阅读
2025-04-18 10:01:22
