


必要条件
有一个Kubeadm部署的集群
介绍
Prometheus 是一个开源的监控它本身已经成为了云原生中指标监控的事实标准,几乎所有 k8s 的核心组件以及其它云原生系统都以 Prometheus 的指标格式输出自己的运行时监控信息。我在工作中也比较深入地使用过 Prometheus,最大的感受就是它非常容易维护,突出一个简单省心成本低。当然,这当中也免不了踩过一些坑。
之前也有手动部署过Prometheus,手动部署关键的就是需要自己维护好Prometheus的YAML配置文件,比如添加服务删除服务后,我们需要实时的增删配置文件的内容,步骤还是相当的繁琐的。
prometheus operator的出现了改变了这种现状。
Operator是由CoreOS公司开发的,用来扩展 Kubernetes API,特定的应用程序控制器,它用来创建、配置和管理复杂的有状态应用,如数据库、缓存和监控系统。Operator基于 Kubernetes 的资源和控制器概念之上构建,但同时又包含了应用程序特定的一些专业知识,比如创建一个数据库的Operator,则必须对创建的数据库的各种运维方式非常了解,创建Operator的关键是CRD(自定义资源)的设计。
Operator是将运维的操作从以往的负载配置,统一化,可编程化,代码化了,统一使用类似Kubernetes的YAML部署配置文件,可编程化由于YAML的字段和内容是固定的,可以轻松的通过python或者golang对YAML进行修改。
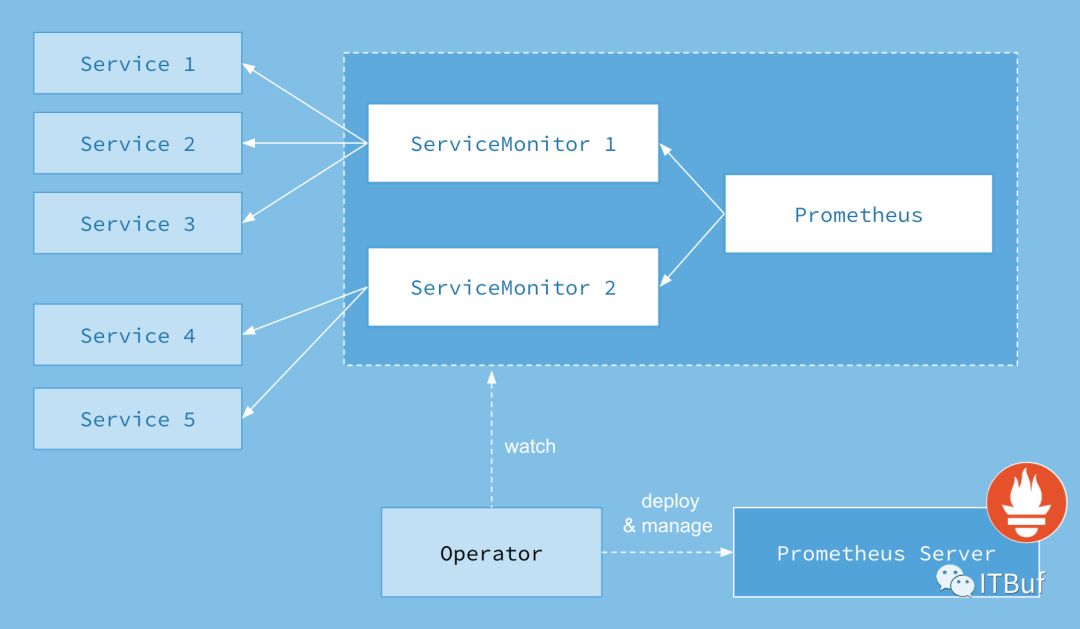
上图是Prometheus-Operator官方提供的架构图,其中Operator是最核心的部分,作为一个控制器,他会去创建Prometheus、ServiceMonitor、AlertManager以及PrometheusRule4个CRD资源对象,然后会一直监控并维持这4个资源对象的状态。
其中创建的prometheus这种资源对象就是作为Prometheus Server存在,而ServiceMonitor就是exporter的各种抽象,exporter前面我们已经学习了,是用来提供专门提供metrics数据接口的工具,Prometheus就是通过ServiceMonitor提供的metrics数据接口去 pull 数据的,当然alertmanager这种资源对象就是对应的AlertManager的抽象,而PrometheusRule是用来被Prometheus实例使用的报警规则文件。
这样我们要在集群中监控什么数据,就变成了直接去操作 Kubernetes 集群的资源对象了,是不是方便很多了。上图中的 Service 和 ServiceMonitor 都是 Kubernetes 的资源,一个 ServiceMonitor 可以通过 labelSelector 的方式去匹配一类 Service,Prometheus 也可以通过 labelSelector 去匹配多个ServiceMonitor。
安装
Prometheus operator的安装方式有很多:helm安装、源码安装。这里我们选择源码安装,这样可以加深理解。prometheus operator 的源代码已经从coreos的官方保存到了github上面。
Clone 源代码到我们本地,这里有一些因素的导致这里的克隆会比较慢:
# ALL_PROXY=socks5://10.0.7.103:1086 git clone https://github.com/coreos/kube-prometheus正克隆到 'kube-prometheus'...remote: Enumerating objects: 11, done.remote: Counting objects: 100% (11/11), done.remote: Compressing objects: 100% (9/9), done.remote: Total 6552 (delta 1), reused 6 (delta 1), pack-reused 6541接收对象中: 100% (6552/6552), 3.99 MiB | 1.46 MiB/s, done.处理 delta 中: 100% (3908/3908), done.
进入项目,查看manifests目录下面,有我们需要的所有资源清单。
# cd kube-prometheus/# ls manifests/00namespace-namespace.yaml grafana-dashboardDatasources.yaml node-exporter-daemonset.yaml prometheus-prometheus.yaml0prometheus-operator-0alertmanagerCustomResourceDefinition.yaml grafana-dashboardDefinitions.yaml node-exporter-serviceAccount.yaml prometheus-roleBindingConfig.yaml0prometheus-operator-0podmonitorCustomResourceDefinition.yaml grafana-dashboardSources.yaml node-exporter-serviceMonitor.yaml prometheus-roleBindingSpecificNamespaces.yaml0prometheus-operator-0prometheusCustomResourceDefinition.yaml grafana-deployment.yaml node-exporter-service.yaml prometheus-roleConfig.yaml0prometheus-operator-0prometheusruleCustomResourceDefinition.yaml grafana-serviceAccount.yaml prometheus-adapter-apiService.yaml prometheus-roleSpecificNamespaces.yaml0prometheus-operator-0servicemonitorCustomResourceDefinition.yaml grafana-serviceMonitor.yaml prometheus-adapter-clusterRoleAggregatedMetricsReader.yaml prometheus-rules.yaml0prometheus-operator-clusterRoleBinding.yaml grafana-service.yaml prometheus-adapter-clusterRoleBindingDelegator.yaml prometheus-serviceAccount.yaml0prometheus-operator-clusterRole.yaml kube-state-metrics-clusterRoleBinding.yaml prometheus-adapter-clusterRoleBinding.yaml prometheus-serviceMonitorApiserver.yaml0prometheus-operator-deployment.yaml kube-state-metrics-clusterRole.yaml prometheus-adapter-clusterRoleServerResources.yaml prometheus-serviceMonitorCoreDNS.yaml0prometheus-operator-serviceAccount.yaml kube-state-metrics-deployment.yaml prometheus-adapter-clusterRole.yaml prometheus-serviceMonitorKubeControllerManager.yaml0prometheus-operator-serviceMonitor.yaml kube-state-metrics-roleBinding.yaml prometheus-adapter-configMap.yaml prometheus-serviceMonitorKubelet.yaml0prometheus-operator-service.yaml kube-state-metrics-role.yaml prometheus-adapter-deployment.yaml prometheus-serviceMonitorKubeScheduler.yamlalertmanager-alertmanager.yaml kube-state-metrics-serviceAccount.yaml prometheus-adapter-roleBindingAuthReader.yaml prometheus-serviceMonitor.yamlalertmanager-secret.yaml kube-state-metrics-serviceMonitor.yaml prometheus-adapter-serviceAccount.yaml prometheus-service.yamlalertmanager-serviceAccount.yaml kube-state-metrics-service.yaml prometheus-adapter-service.yamlalertmanager-serviceMonitor.yaml node-exporter-clusterRoleBinding.yaml prometheus-clusterRoleBinding.yamlalertmanager-service.yaml node-exporter-clusterRole.yaml prometheus-clusterRole.yaml
检查一下 prometheus-serviceMonitorKubelet.yaml文件的配置,默认serviceMonitor是关联kubelet 的10250端口采集metrics数据为了安全,已经将数据迁移到了10255上面,这里我们只需要将https-metrics更改为http-metrics。有兴趣的可以查看源代码,需要对Go语言有点了解。
修改完成以后直接应用,当前路径下面的所有YAML配置:
# kubectl apply -f .
部署完成会自动创建CRD资源、一个命名为monitor的namespace、svc、以及各个监控组件等等。
CRD资源:
# kubectl get crd |egrep coreosalertmanagers.monitoring.coreos.com 2019-07-19T07:46:41Zpodmonitors.monitoring.coreos.com 2019-07-19T07:46:41Zprometheuses.monitoring.coreos.com 2019-07-19T07:46:41Zprometheusrules.monitoring.coreos.com 2019-07-19T07:46:41Zservicemonitors.monitoring.coreos.com 2019-07-19T07:46:41Z
命名空间以及其他监控组件:
# kubectl get namespaces |egrep monitormonitoring Active 67d# kubectl get deployments -n monitoringNAME DESIRED CURRENT UP-TO-DATE AVAILABLE AGEgrafana 1 1 1 1 67dkube-state-metrics 1 1 1 1 67dprometheus-adapter 1 1 1 1 67dprometheus-operator 1 1 1 1 67d
SVC
# kubectl get -n monitoring svcNAME TYPE CLUSTER-IP EXTERNAL-IP PORT(S) AGEalertmanager-main ClusterIP 172.23.35.101 <none> 9093/TCP 67dalertmanager-operated ClusterIP None <none> 9093/TCP,6783/TCP 67dgrafana ClusterIP 172.23.244.138 <none> 3000/TCP 67dkube-state-metrics ClusterIP None <none> 8443/TCP,9443/TCP 67dnode-exporter ClusterIP None <none> 9100/TCP 67dprometheus-adapter ClusterIP 172.23.92.175 <none> 443/TCP 67dprometheus-k8s ClusterIP 172.23.146.26 <none> 9090/TCP 67dprometheus-operated ClusterIP None <none> 9090/TCP 35dprometheus-operator ClusterIP None <none> 8080/TCP 67d
有了svc以后我们就可以通过Ingress或者NodePort的方式访问集群内的http或者TCP的服务,比如promehtues的页面、alertmanager的页面、grafana的监控模版页面。个人比较推荐使用Ingress无论你是使用nginx-ingress还是traefik-ingress控制器。NodePort我觉的是一个很不好的习惯尤其是当你访问的目标端口上面没有NodePort所对应的端口时,时会通过iptables端口转发的形式转发到目标端口所在的节点,效率非常低,生产上面不推荐使用。不过,如果时使用阿里云的SLB做负载均衡这个问题不是很严重,因为阿里云的kubernetes的集群会在kube-system命名空间下面安装一个组件,这个组件是在我们集群中使用了LoadBalancer的方式的时候,组件会获取目标pod所运行的节点,以及节点对应的IP,并添加到SLB中。除非自建的集群也写一个这个这样的工具,否则不是很推荐NodePort的方式。
Pod的资源:
# kubectl get pods -n monitoringNAME READY STATUS RESTARTS AGEalertmanager-main-0 2/2 Running 0 67dalertmanager-main-1 2/2 Running 0 67dalertmanager-main-2 2/2 Running 0 46dgrafana-89894d799-fffgn 1/1 Running 1 25dkube-state-metrics-7fbddc9b89-7l9d7 4/4 Running 0 42hnode-exporter-4vl7c 2/2 Running 1 53dnode-exporter-54fzs 2/2 Running 2 67dnode-exporter-55fcj 2/2 Running 1 36dnode-exporter-6h7nz 2/2 Running 0 53dnode-exporter-78c54 2/2 Running 2 67dnode-exporter-7wdbq 2/2 Running 1 67dnode-exporter-9gz2r 2/2 Running 1 14dnode-exporter-9kvnh 2/2 Running 0 50dnode-exporter-b78kz 2/2 Running 1 14dnode-exporter-bh7qv 2/2 Running 0 67dnode-exporter-br5n2 2/2 Running 0 29dnode-exporter-cb8nr 2/2 Running 1 50dnode-exporter-cdjtz 2/2 Running 1 50dnode-exporter-fcd6g 2/2 Running 0 67dnode-exporter-fh5vp 2/2 Running 1 53dnode-exporter-fsh4x 2/2 Running 0 29dnode-exporter-h7jk4 2/2 Running 0 20dnode-exporter-hhsng 2/2 Running 0 67dnode-exporter-hnz9n 2/2 Running 0 29dnode-exporter-j5k7v 2/2 Running 0 50dnode-exporter-km8fq 2/2 Running 0 29dnode-exporter-lps9s 2/2 Running 1 50dnode-exporter-lpsx4 2/2 Running 0 67dnode-exporter-mp6km 2/2 Running 0 29dnode-exporter-msz54 2/2 Running 2 67dnode-exporter-pfz2h 2/2 Running 2 67dnode-exporter-pmwbd 2/2 Running 0 67dnode-exporter-pnz4x 2/2 Running 2 67dnode-exporter-pvcm6 2/2 Running 0 53dnode-exporter-tp2ph 2/2 Running 1 28dnode-exporter-vtp56 2/2 Running 0 29dnode-exporter-wg8dd 2/2 Running 0 67dnode-exporter-whw7k 2/2 Running 0 29dnode-exporter-wzf4w 2/2 Running 2 67dprometheus-adapter-b7d894c9c-xw7vp 1/1 Running 0 67dprometheus-k8s-0 3/3 Running 0 28dprometheus-k8s-1 3/3 Running 0 35dprometheus-operator-66bbf6b5b7-wcg2b 1/1 Running 0 67d
当然还有很多prometheus-operator的自定义API对象,比如:
# kubectl get -n monitoring servicemonitors.monitoring.coreos.comNAME AGEalertmanager 67dapp-account 19dapp-b-veterantam 19dapp-business 19dapp-college 19dapp-commodity 19dapp-config 19d
配置
我这里通过ingress访问prometheus后页面如下:
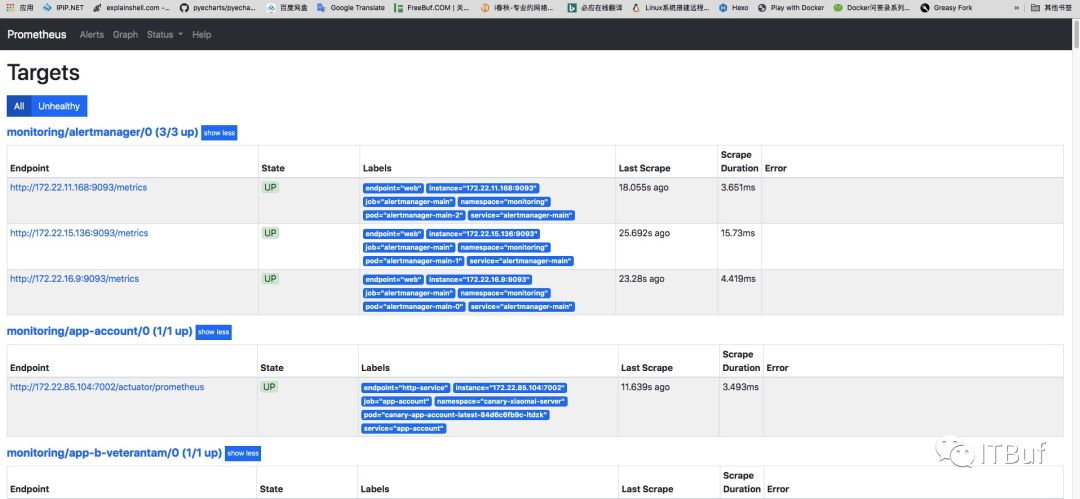
这个页面一直往下拉取发现有红色出现,这表示服务没有被prometheus监控到,或者监控配置有误。
通过上面的红色名字内容我们可以找到对应的serviceMonitor文件:
prometheus-serviceMonitorKubeScheduler.yaml
apiVersion: monitoring.coreos.com/v1kind: ServiceMonitormetadata:labels:k8s-app: kube-schedulername: kube-schedulernamespace: monitoringspec:endpoints:- interval: 30s # 拉取metrics的周期port: http-metrics #对应service的PortjobLabel: k8s-appnamespaceSelector: # 匹配的命名空间matchNames:- kube-systemselector: # 匹配的 Service 的labels,如果使用mathLabels,则下面的所有标签都匹配时才会匹配该service,如果使用matchExpressions,则至少匹配一个标签的service都会被选择matchLabels:k8s-app: kube-scheduler
根据上面的配置文件我们可以查看kube-system命名空间下面的svc,发现没有labels为kube-scheduler的svc。这里我们自己创建一个prometheus-kube-schedule的svc:
apiVersion: v1kind: Servicemetadata:namespace: kube-systemname: kube-schedulerlabels:k8s-app: kube-schedulerspec:selector:component: kube-schedulerports:- name: http-metricsport: 10251targetPort: 10251protocol: TCP
上面配置文件最终的要是labels和selector,这两个配置可以从已经部署的好的kube-scheduler的pod文件中获取(我这里的kubernetes是使用kubeadm部署的所以组件是运行在容器中的),如果是运行在外面的话也有方法需要手动配置endpoint,并且endpoint必须和svc对应就可以了。
从对应的Pod中获取labels:
# kubectl describe -n kube-system pods kube-scheduler-cn-hangzhou.10.1.65.201Name: kube-scheduler-cn-hangzhou.10.1.65.201Namespace: kube-systemPriority: 2000000000PriorityClassName: system-cluster-criticalNode: cn-hangzhou.10.1.65.201/10.1.65.201Start Time: Thu, 25 Jul 2019 17:33:03 +0800Labels: component=kube-schedulertier=control-plane
这里的component: kube-scheduler和我们刚刚创建的svc刚刚好对上。
应用我们上面的svc:
# kubectl apply -f prometheus-kube-schedule.yaml
过一会就能看到prometheus已经成功监控到了:
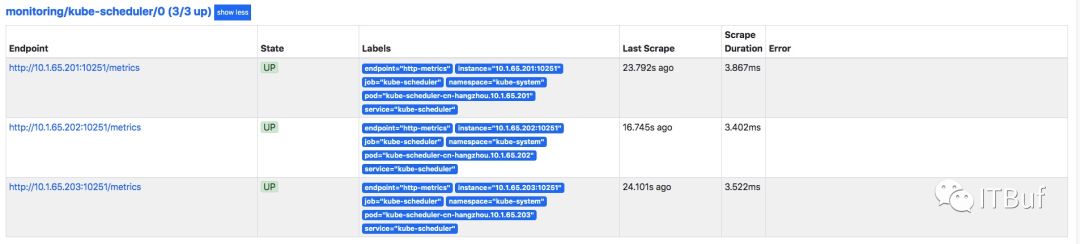
集群中的kube-controller-manager、coreDNS如果没有svc也可以用这种方法。
对于kubeadm部署etcd是集群之外的svc建立的比较特殊,需要自己编写endpoint。
各位看官如果还满意的话,可否关注一下我们:
微信订阅号:ITBuf
企鹅号:TSG技术分享
您的认可是对我们最大的支持。
