概述
我们的目标不在于画一些漂亮的监控统计图,而在于对各个在线服务做实时监控。在我们监控系统中,通过维护一个服务监控列表,系统自动同步到Prometheus配置文件,无需重启任何服务也无需安装任何Agent,在我们SDP客户端中管理这个监控服务表: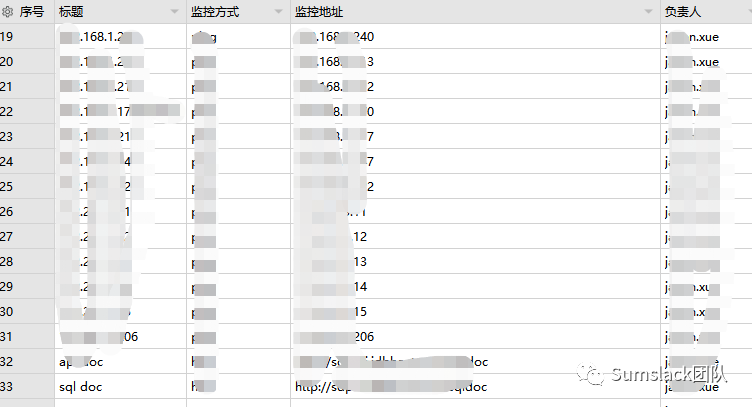
•负责人:主要起到该服务不可用时,系统会自动钉钉到该用户做预警提醒;•监控方式:我们支持ping,tcp,http,springboot2等多种方式,可以任意扩展;添加数据后,系统自动会将该条目纳入监控,当服务不可用时,会自动钉钉提醒您。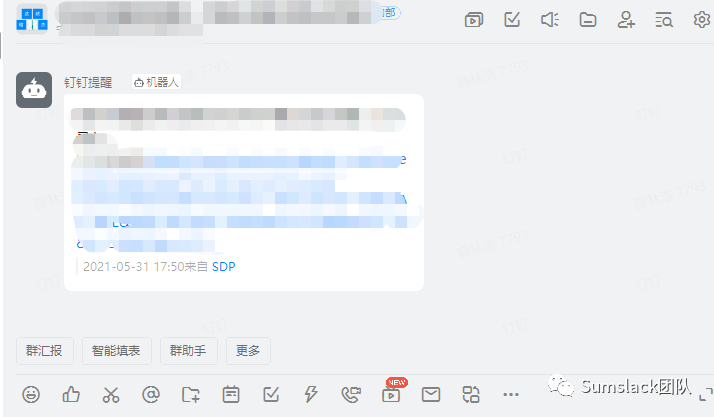
Prometheus的好处是对比nagios,zabbix等监控工具,Prometheus无需安装任何agent到目标服务器,通过pull的方式达到服务监控的目的,非常方便。
常用命令
•启动:nohup ./prometheus --web.enable-lifecycle &
,加入web.enable-lifecycle
目的是为了能在不重启服务的情况下,使得修改的配置文件生效•不重启加载配置文件:kill -1 进程号 然后执行:curl -XPOST http://IP:9090/-/reload
•检查配置文件是否正确:./promtool check config prometheus.yml
•删除某Job:curl -X POST -g 'http://192.168.1.128:9090/api/v1/admin/tsdb/delete_series?match[]={instance=".*baidu.*"}'
监控类型
根据不同的监控服务类型,将你的服务/系统纳入到prometheus监控中:
•SpringBoot2.x项目:添加一行:/opt/sumscope/prometheus/configs/springboot2.json
多维度监控SpringBoo2项目的运行监控状态,添加后,系统会自动检测,无需重启任何服务
•
服务端口连通性检测:用于检测某个服务telnet的端口通不通,添加后,系统会自动检测,无需重启任何服务
•
服务http连通性检测:/opt/sumscope/prometheus/configs/blackbox/tcp.json
http服务返回响应码2xx,添加后,系统会自动检测,无需重启任何服务
•
ping:/opt/sumscope/prometheus/configs/blackbox/icmp.json
服务器ping操作检测,使用icmp,添加后,系统会自动检测,无需重启任何服务
监控整合
SpringBoot 2.x项目
•pom.xml引入依赖
<dependency><groupId>org.springframework.boot</groupId><artifactId>spring-boot-starter-actuator</artifactId></dependency><dependency><groupId>io.micrometer</groupId><artifactId>micrometer-registry-prometheus</artifactId></dependency>
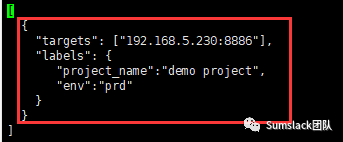
•prometheus.yml配置
- job_name: 'springboot2demo'metrics_path: '/prometheus'static_configs:- targets: ['192.168.5.230:8886']
•配置文件
spring.application.name=mydemoserver.port=8886management.security.enabled=falsemanagement.metrics.export.prometheus.enabled=truemanagement.metrics.export.jmx.enabled=truemanagement.endpoints.web.exposure.include=*management.endpoints.web.base-path=/
•新增Configuration
@Configurationpublic class MyPrometheusConfig {@BeanMeterRegistryCustomizer<MeterRegistry> configurer(@Value("${spring.application.name}") String applicationName) {return (registry) -> registry.config().commonTags("application", applicationName);}}
与Grafana整合
Dashboard里导入模板ID号:
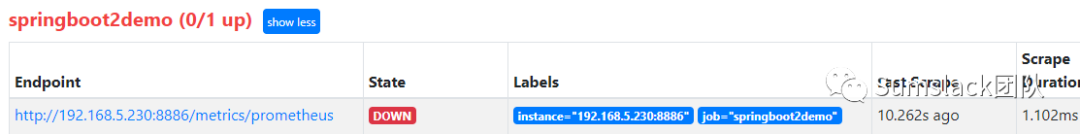
10280,在界面中就可以自动发现这个SpringBoot2.x的项目监控了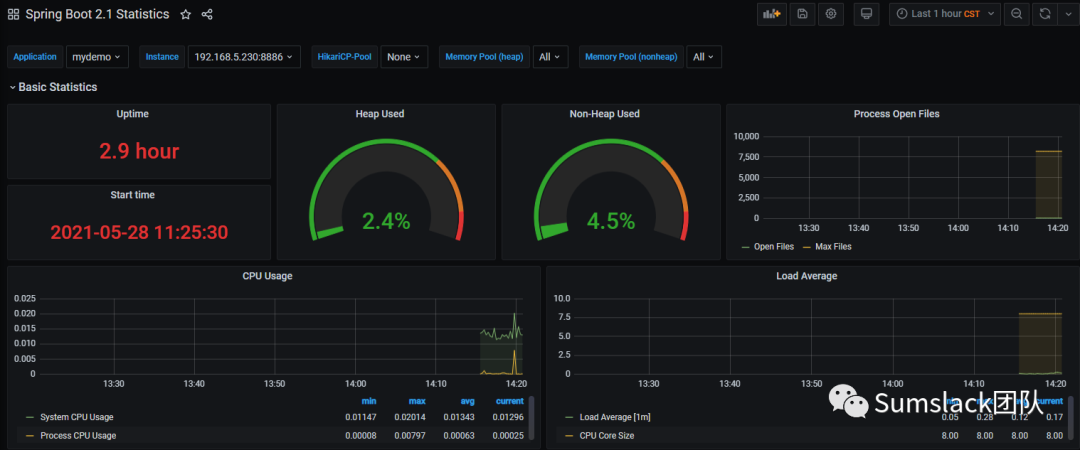 如果服务挂了,会在Targets处有提醒:
exporter
我们可以使用blackbox exporter
,在Grafana导入模板号:9965,提供了icmp,http等检查。另外Prometheus还支持MySQL,RabbitMQ,Kafka等中间件的exporter,你也可以实现自己的exporter。
你可以继续阅读:
一款自动生成后台代码的管理系统的设计与实现 | “大”中台,“小”前端的架构演变| 云服务平台中推送服务的设计与实现 | 对微服务的理解以及实现一套微服务对外发布API管理平台 | 项目开发中常用的设计模式整理 | 异构语言调用平台的设计与实现 | 大话正则表达式 | 云API平台的设计与实现 | 个税改了,工资少了,不要慌!文末附计算器
关注我们的公众号
长按识别二维码关注我们