


Table of Contents
一. 问题描述
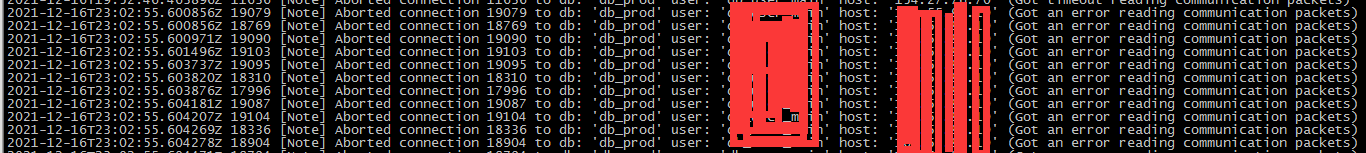
今天朋友的数据库出现了一些连接失败
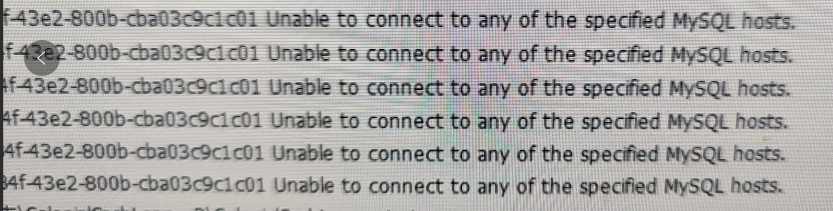
查看MySQL的错误日志,发现有如下报错:
2021-12-16T09:34:13.091556Z 0 [Note] InnoDB: page_cleaner: 1000ms intended loop took 4177ms. The settings might not be optimal. (flushed=493 and evicted=0, during the time.) 2021-12-16T09:31:55.886147Z 16262 [Note] Aborted connection 16262 to db: ''****'' user: '****' host: ''****'' (Got an error writing communication packets) 2021-12-16T09:31:56.111603Z 16255 [Note] Aborted connection 16255 to db: ''****'' user: '****' host: ''****'' (Got an error writing communication packets) 2021-12-16T09:31:56.303709Z 16236 [Note] Aborted connection 16236 to db: ''****'' user: '****' host: ''****'' (Got an error writing communication packets) 2021-12-16T09:31:56.663354Z 16245 [Note] Aborted connection 16245 to db: ''****'' user: '****' host: ''****'' (Got an error writing communication packets) 2021-12-16T09:31:57.022734Z 16240 [Note] Aborted connection 16240 to db: ''****'' user: '****' host: ''****'' (Got an error writing communication packets) 2021-12-16T09:31:57.256939Z 16004 [Note] Aborted connection 16004 to db: ''****'' user: '****' host: ''****'' (Got an error writing communication packets)复制
二. 解决方案
2.1 排查page_cleaner的报错
因为每次出现写错误的时候,都会出现这个page_cleaner的报错,首先考虑是资源的问题。
但是朋友的数据库服务器 32核 128GB内存 2T的存储,硬件资源绝对足够,而且在报错期间IO使用率也才20%左右。
首先调整参数
show variables like '%innodb_io_capacity%'; show variables like '%innodb_max_dirty_pages_pct%'; show variables like '%innodb_max_dirty_pages_pct_lwm%'; set global innodb_io_capacity = 100; set global innodb_max_dirty_pages_pct = 50; set global innodb_io_capacity_max = 1000;复制
观察了一段时间,发现问题依旧。
2.2 排查慢SQL

上面 慢日志 Time + Query_time 就刚好是错误日志记录错误的时间了。
900w左右数据的大表直接一个update就更新,难怪会导致写入问题。
写了个存储过程,将单表更新改为 根据id列 分批更新
过了2天,继续观察,问题依旧。
2.3 停应用 分批更新大表
上文提到的 900w左右数据的大表直接一个update就更新,而且这个update语句有30多个,相当于一个900w的大表被更新30多次。
写了个存储过程,将单表更新改为 根据id列 1000条数据更新一次。
delimiter //

drop procedure  if exists p_batch_tmp//

create procedure  p_batch_tmp()
begin

  # 定义一个变量,默认为0
  DECLARE l_count INTEGER DEFAULT 0;

  # 定义一个开始及结束的值
  DECLARE l_beg INTEGER DEFAULT 1;
  DECLARE l_end INTEGER DEFAULT 1000;


  -- 获取表的总行数
  select max(data_id)
    into l_count
   from us_data_payday_demo_copy1;

  while l_beg <=  l_count  DO
     -- 分批更新数据
     # 去除前后空格
    update us_data_payday_demo_copy1
      set First_Name = trim(First_Name)
      where data_id between l_beg and l_end;
     commit;

     set l_beg = l_beg + 1000;
     set l_end = l_end + 1000;

  end while;

end;
//

delimiter ;
复制
为了避免网络原因中断,这里使用到mysql的事件
create event evt_now_batch
on schedule
at now()
do call p_batch_tmp;
复制
居然发现依旧有 page_cleaner的报错:
InnoDB: page_cleaner: 1000ms intended loop took 4177ms. The settings might not be optimal. (flushed=493 and evicted=0, during the time.)
此时没有应用的更新,只有我存储过程单线程更新大表的数据,而且每一个sql都用到主键 data_id列,居然依旧报错。
2.4 测试磁盘性能
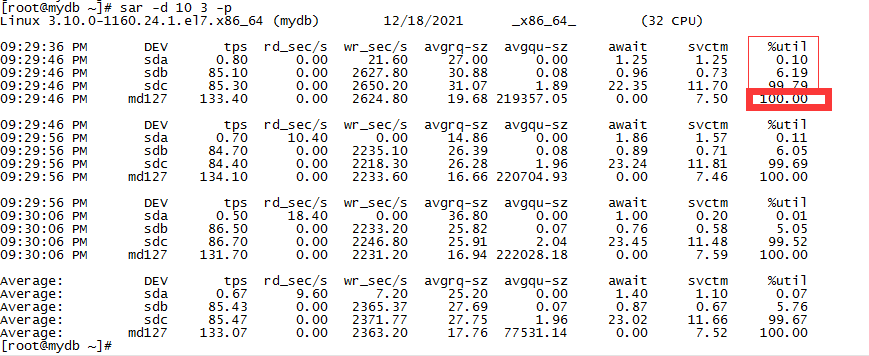
sar命令查看:
sar -d 10 3 -p复制
%util 为 100.00 代表表示磁盘产生的I/O请求太多,I/O系统已经满负荷的在工作,该磁盘可能存在瓶颈。长期下去,势必影响系统的性能,可以通过优化程序或者通过更换更高、更快的磁盘来解决此问题。
fio测试
测试随机读命令:
fio -filename=/dev/mapper/centos-home -direct=1 -iodepth 1 -thread -rw=randread -ioengine=psync -bs=16k -size=10G -numjobs=10 -runtime=1000 -group_reporting -name=mytest复制
输出结果:
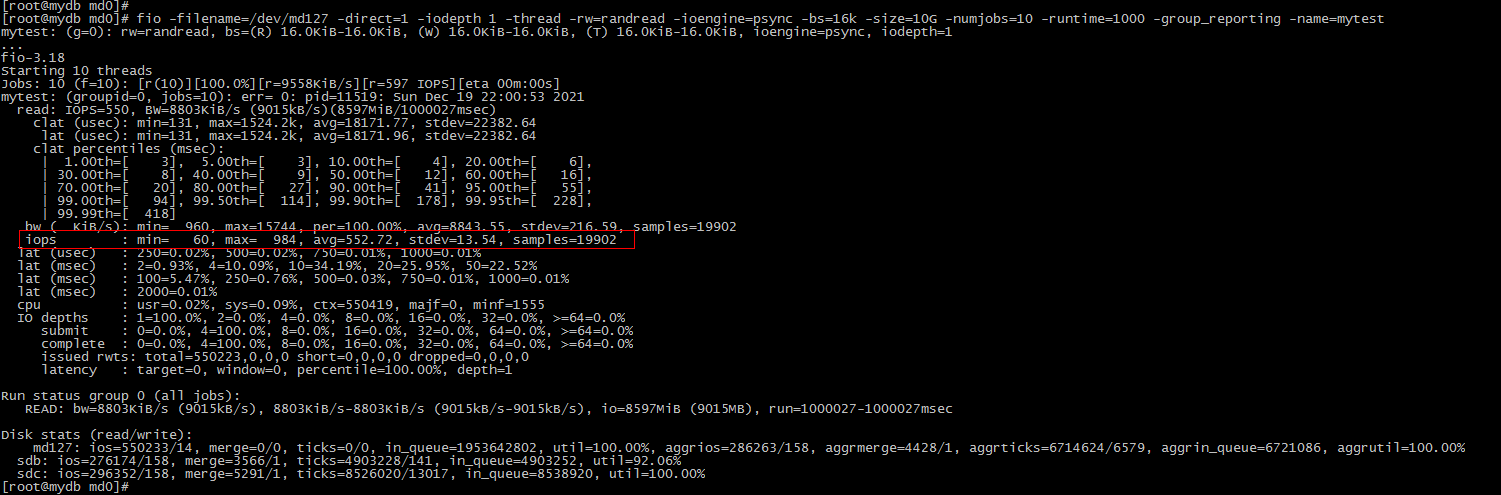
对比下我们公司测试服务器的输出:
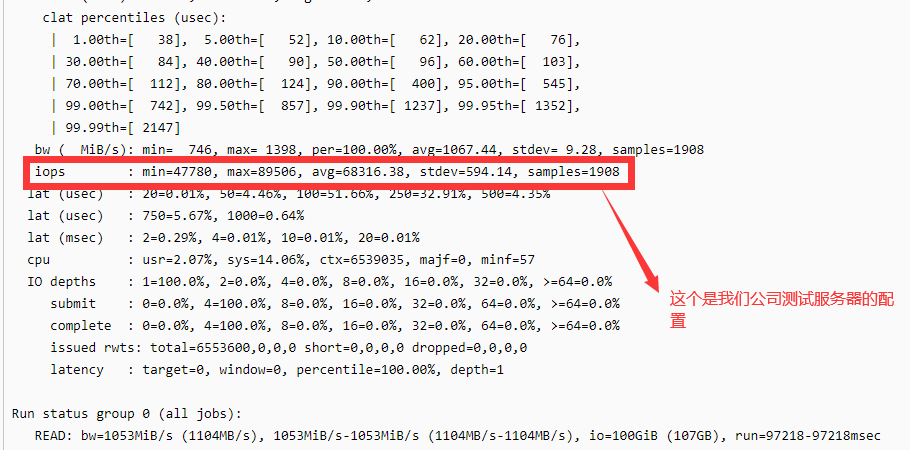
iops 差距在100倍以上
最终问题排查到,是磁盘的IO性能不给力,太慢了。
后来得知朋友的公司使用的是一个很老旧的机器,CPU和内存还算给力,磁盘真的慢到不行。
已经知会朋友,让朋友换硬件。
