1、前言
在计算2组不同数据的相关性时,我们最经常使用的是计算完这2组数据的时间序列,然后计算时间序列之间的相关系数。有些时候,我们会需要比较2个不同数据在空间上的相关性,这就需要计算空间相关系数。在NCL中有专门的函数:
https://www.ncl.ucar.edu/Document/Functions/Contributed/pattern_cor.shtml
今天要介绍使用xskillscore库来达到相同的目的。
2、安装
conda install -c conda-forge xskillscore
3、函数
xskillscore.pearson_r(a, b, dim=None, weights=None, skipna=False, keep_attrs=False)
Parameters
a (xarray.Dataset or xarray.DataArray) – Labeled array(s) over which to apply the function.
b (xarray.Dataset or xarray.DataArray) – Labeled array(s) over which to apply the function.
dim (str, list) – The dimension(s) to apply the correlation along. Note that this dimension will be reduced as a result. Defaults to None reducing all dimensions.
weights (xarray.Dataset or xarray.DataArray or None) – Weights matching dimensions of
dim
to apply during the function.skipna (bool) – If True, skip NaNs when computing function.
keep_attrs (bool) – If True, the attributes (attrs) will be copied from the first input to the new one. If False (default), the new object will be returned without attributes.
Returns
Pearson’s correlation coefficient.
Return type
xarray.DataArray or xarray.Dataset
4、参考案例
 1a = xr.DataArray(np.random.rand(5, 3, 3),
 2...                  dims=['time', 'x', 'y'])
 3>>> b = xr.DataArray(np.random.rand(5, 3, 3),
 4...                  dims=['time', 'x', 'y'])
 5>>> xs.pearson_r(a, b, dim='time')
 6<xarray.DataArray (x: 3, y: 3)>
 7array([[-0.17455755, -0.26648379, -0.74265833],
 8       [ 0.32535918,  0.42496646,  0.1940647 ],
 9       [-0.3203094 ,  0.33207755,  0.89250429]])
10Dimensions without coordinates: x, y
1xs.pearson_r(a, b, dim='time')
5、实战
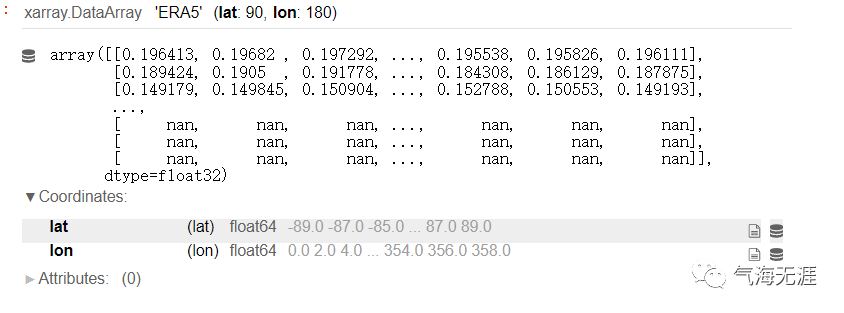
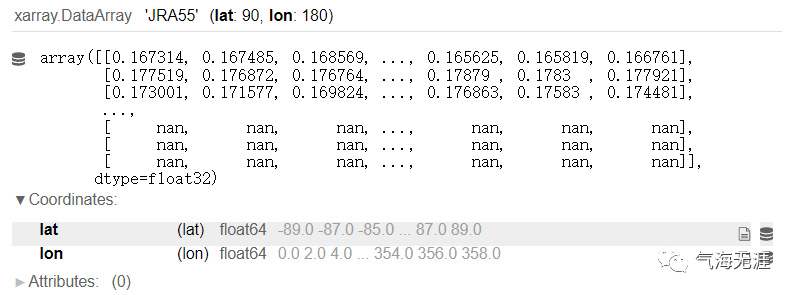
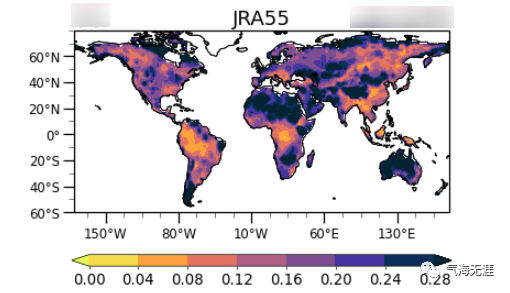
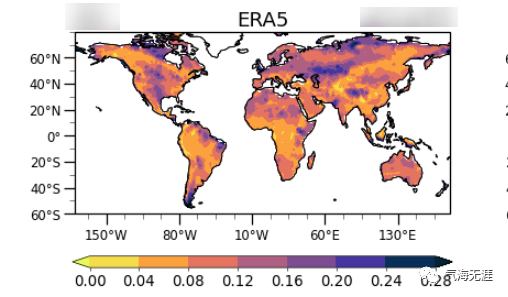
我现在想用ERA5和JRA55的2组数据计算一个共同年份上的气候态空间相关性,首先我用cdo将2个数据的分辨率进行统一和和处理,并读入数据
1data=xarray.open_dataset('/mnt/d/science/Fig19.std/evaluation_std.nc')
2ERA5 =data.ERA5
3JRA55=data.JRA55


可以看到2个数据的空间上已经没有time维度了,这是我处理的时候直接计算了time平均的原因,然后lat和lon的分辨率也一致,所以可以进行计算:
1print(xs.pearson_r(ERA5, JRA55, dim= ("lon", "lat"), keep_attrs=True,skipna=True) )
计算的话只需要一行就行,我加入了skipna参数是因为我的数据只有陆地,如果不加这个跳过缺测参数的话结果就是nan。
返回的结果为,相关系数为0.66.


在空间上确实能难用肉眼看出相关性的量化程度,使用xs库可以直接定量的计算出来。
有问题可以到QQ群里进行讨论,我们在那边等大家。
QQ群号:854684131


