


一次打Oracle小补丁引发的事故,环境是Linux 7上的19C两节点RAC,打完小补丁过了几个小时,其中一个节点发生重启现象。
- DB alert日志无报错信息,05:17:22 开始启动数据库
2022-01-11T04:55:07.629428+08:00
TT02 (PID:67750): SRL selected for T-2.S-26402 for LAD:2
2022-01-11T04:55:16.834464+08:00
ARC2 (PID:67638): Archived Log entry 100056 added for T-2.S-26401 ID 0xecb9a320 LAD:1
# 重启前无报错信息
2022-01-11T05:17:22.625738+08:00
Starting ORACLE instance (normal) (OS id: 15301)
2022-01-11T05:17:22.777374+08:00
************************************************************
Instance SGA_TARGET = 307200 MB and SGA_MAX_SIZE = 307200 MB
************************************************************
- CRS alter日志(故障节点2)
2022-01-11 00:32:49.113 [OCSSD(72170)]CRS-7503: The Oracle Grid Infrastructure process 'ocssd' observed communication issues between node 'rac2' and node 'rac1', interface list of local node 'rac2' is '192.168.0.2:54393;', interface list of remote node 'rac1' is '192.168.0.1:18424;'.
2022-01-11 01:06:58.153 [EVMD(68443)]CRS-7503: The Oracle Grid Infrastructure process 'evmd' observed communication issues between node 'rac2' and node 'rac1', interface list of local node 'rac2' is '192.168.0.2:40437;', interface list of remote node 'rac1' is '192.168.0.1:43662;'.
# 重启前无报错信息
2022-01-11 05:15:52.838 [OHASD(61516)]CRS-8500: Oracle Clusterware OHASD process is starting with operating system process ID 61516
2022-01-11 05:15:52.909 [OHASD(61516)]CRS-0714: Oracle Clusterware Release 19.0.0.0.0.
2022-01-11 05:15:52.924 [OHASD(61516)]CRS-2112: The OLR service started on node rac2.
2022-01-11 05:15:53.251 [OHASD(61516)]CRS-1301: Oracle High Availability Service started on node rac2.
# 此处显示 05:08:56 节点2 由于大多数表决磁盘没有完成 I/O,oracssdagent 即将重新启动此节点。
2022-01-11 05:15:53.254 [OHASD(61516)]CRS-8011: reboot advisory message from host: rac2, component: cssagent, with time stamp: L-2022-01-11-05:08:56.490
2022-01-11 05:15:53.255 [OHASD(61516)]CRS-8013: reboot advisory message text: oracssdagent is about to reboot this node due to no I/O completions with majority of voting disks.
2022-01-11 05:15:53.256 [OHASD(61516)]CRS-8017: location: /etc/oracle/lastgasp has 2 reboot advisory log files, 1 were announced and 0 errors occurred
2022-01-11 05:15:53.809 [ORAROOTAGENT(69333)]CRS-8500: Oracle Clusterware ORAROOTAGENT process is starting with operating system process ID 69333
2022-01-11 05:15:53.814 [CSSDAGENT(69347)]CRS-8500: Oracle Clusterware CSSDAGENT process is starting with operating system process ID 69347
2022-01-11 05:15:53.815 [CSSDMONITOR(69354)]CRS-8500: Oracle Clusterware CSSDMONITOR process is starting with operating system process ID 69354
2022-01-11 05:15:53.832 [ORAAGENT(69343)]CRS-8500: Oracle Clusterware ORAAGENT process is starting with operating system process ID 69343
2022-01-11 05:15:54.485 [ORAAGENT(69655)]CRS-8500: Oracle Clusterware ORAAGENT process is starting with operating system process ID 69655
- CRS alter日志(远程节点1)
2022-01-11 03:54:42.911 [CVUD(117742)]CRS-10051: CVU found following errors with Clusterware setup : PRVG-13159 : On node "rac2" the file "/etc/resolv.conf" could not be parsed because the file is empty.
PRVE-0421 : No entry exists in /etc/fstab for mounting /dev/shm
PRVF-4664 : Found inconsistent name resolution entries for SCAN name "rac-scan"
PRVG-11368 : A SCAN is recommended to resolve to "3" or more IP addresses, but SCAN "rac-scan" resolves to only "/192.168.0.13"

2022-01-11 05:06:04.438 [CRSD(110493)]CRS-7503: The Oracle Grid Infrastructure process 'crsd' observed communication issues between node 'rac1' and node 'rac2', interface list of local node 'rac1' is '192.168.0.1:15060;', interface list of remote node 'rac2' is '192.168.0.2:33424;'.
2022-01-11 05:07:54.319 [ORAAGENT(120835)]CRS-5818: Aborted command 'check' for resource 'ora.LISTENER_SCAN1.lsnr'. Details at (:CRSAGF00113:) {1:16836:2} in /oracle/app/grid/diag/crs/rac1/crs/trace/crsd_oraagent_grid.trc.
2022-01-11 05:08:04.332 [EVMD(67934)]CRS-7503: The Oracle Grid Infrastructure process 'evmd' observed communication issues between node 'rac1' and node 'rac2', interface list of local node 'rac1' is '192.168.0.1:43662;', interface list of remote node 'rac2' is '192.168.0.2:40437;'.
2022-01-11 05:08:14.620 [CRSD(110493)]CRS-7503: The Oracle Grid Infrastructure process 'crsd' observed communication issues between node 'rac1' and node 'rac2', interface list of local node 'rac1' is '192.168.0.1:15060;', interface list of remote node 'rac2' is '192.168.0.2:33424;'.
2022-01-11 05:08:55.476 [OCSSD(71998)]CRS-1663: Member kill issued by PID 15278-387376 for 1 members, group DB+ASM. Details at (:CSSGM00044:) in /oracle/app/grid/diag/crs/rac1/crs/trace/ocssd.trc.
2022-01-11 05:08:55.579 [OCSSD(71998)]CRS-1607: Node rac2 is being evicted in cluster incarnation 516104351; details at (:CSSNM00007:) in /oracle/app/grid/diag/crs/rac1/crs/trace/ocssd.trc.
# 节点2 由于大多数表决磁盘没有完成 I/O 被 reboot。
2022-01-11 05:08:56.492 [OHASD(58992)]CRS-8011: reboot advisory message from host: rac2, component: cssagent, with time stamp: L-2022-01-11-05:08:56.490
2022-01-11 05:08:56.494 [OHASD(58992)]CRS-8013: reboot advisory message text: oracssdagent is about to reboot this node due to no I/O completions with majority of voting disks.
2022-01-11 05:09:03.844 [OCSSD(71998)]CRS-7503: The Oracle Grid Infrastructure process 'ocssd' observed communication issues between node 'rac1' and node 'rac2', interface list of local node 'rac1' is '192.168.0.1:54820;', interface list of remote node 'rac2' is '192.168.0.2:58358;'.
2022-01-11 05:09:25.713 [OCSSD(71998)]CRS-1601: CSSD Reconfiguration complete. Active nodes are rac1 .
2022-01-11 05:09:27.305 [CRSD(110493)]CRS-5504: Node down event reported for node 'rac2'.
2022-01-11 05:09:28.523 [CRSD(110493)]CRS-2773: Server 'rac2' has been removed from pool 'Generic'.
2022-01-11 05:09:28.525 [CRSD(110493)]CRS-2773: Server 'rac2' has been removed from pool 'ora.orcl'.
-
通过OSW分析系统资源使用情况
分析iostat,以下是5个 voting disk
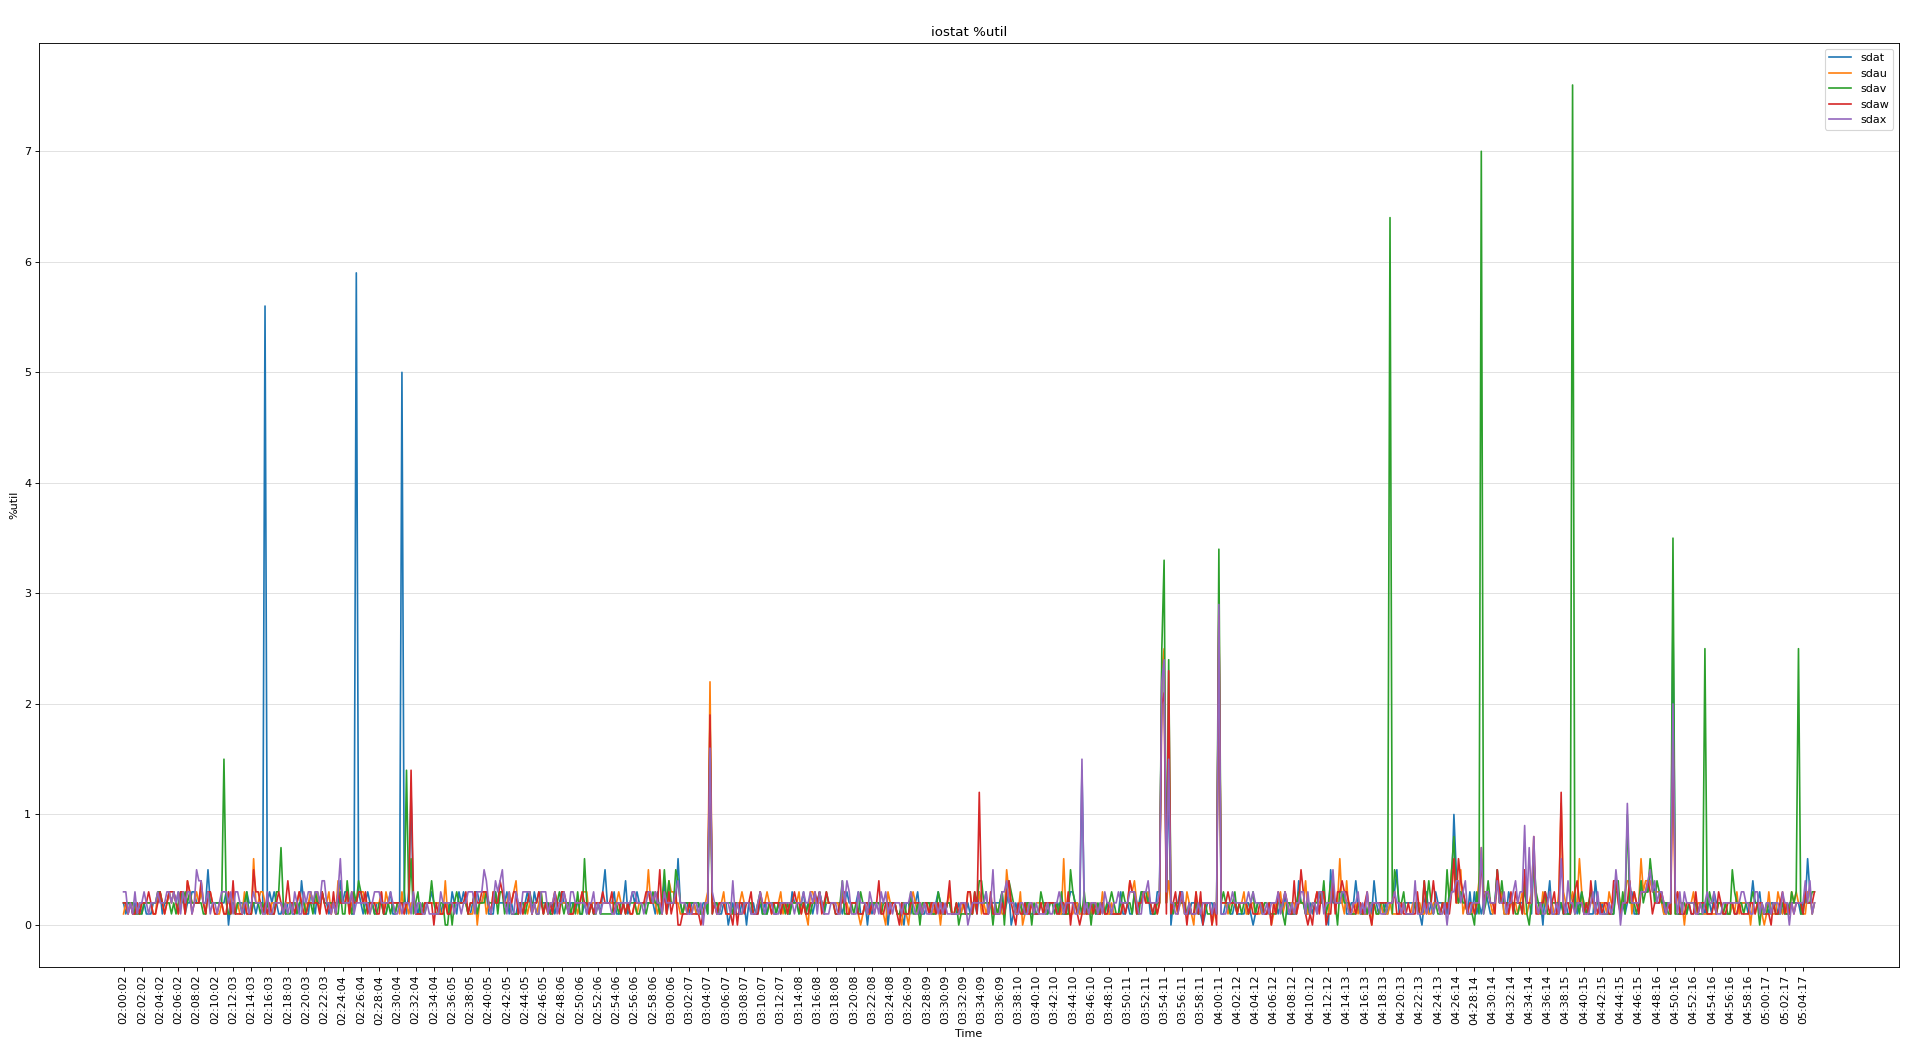
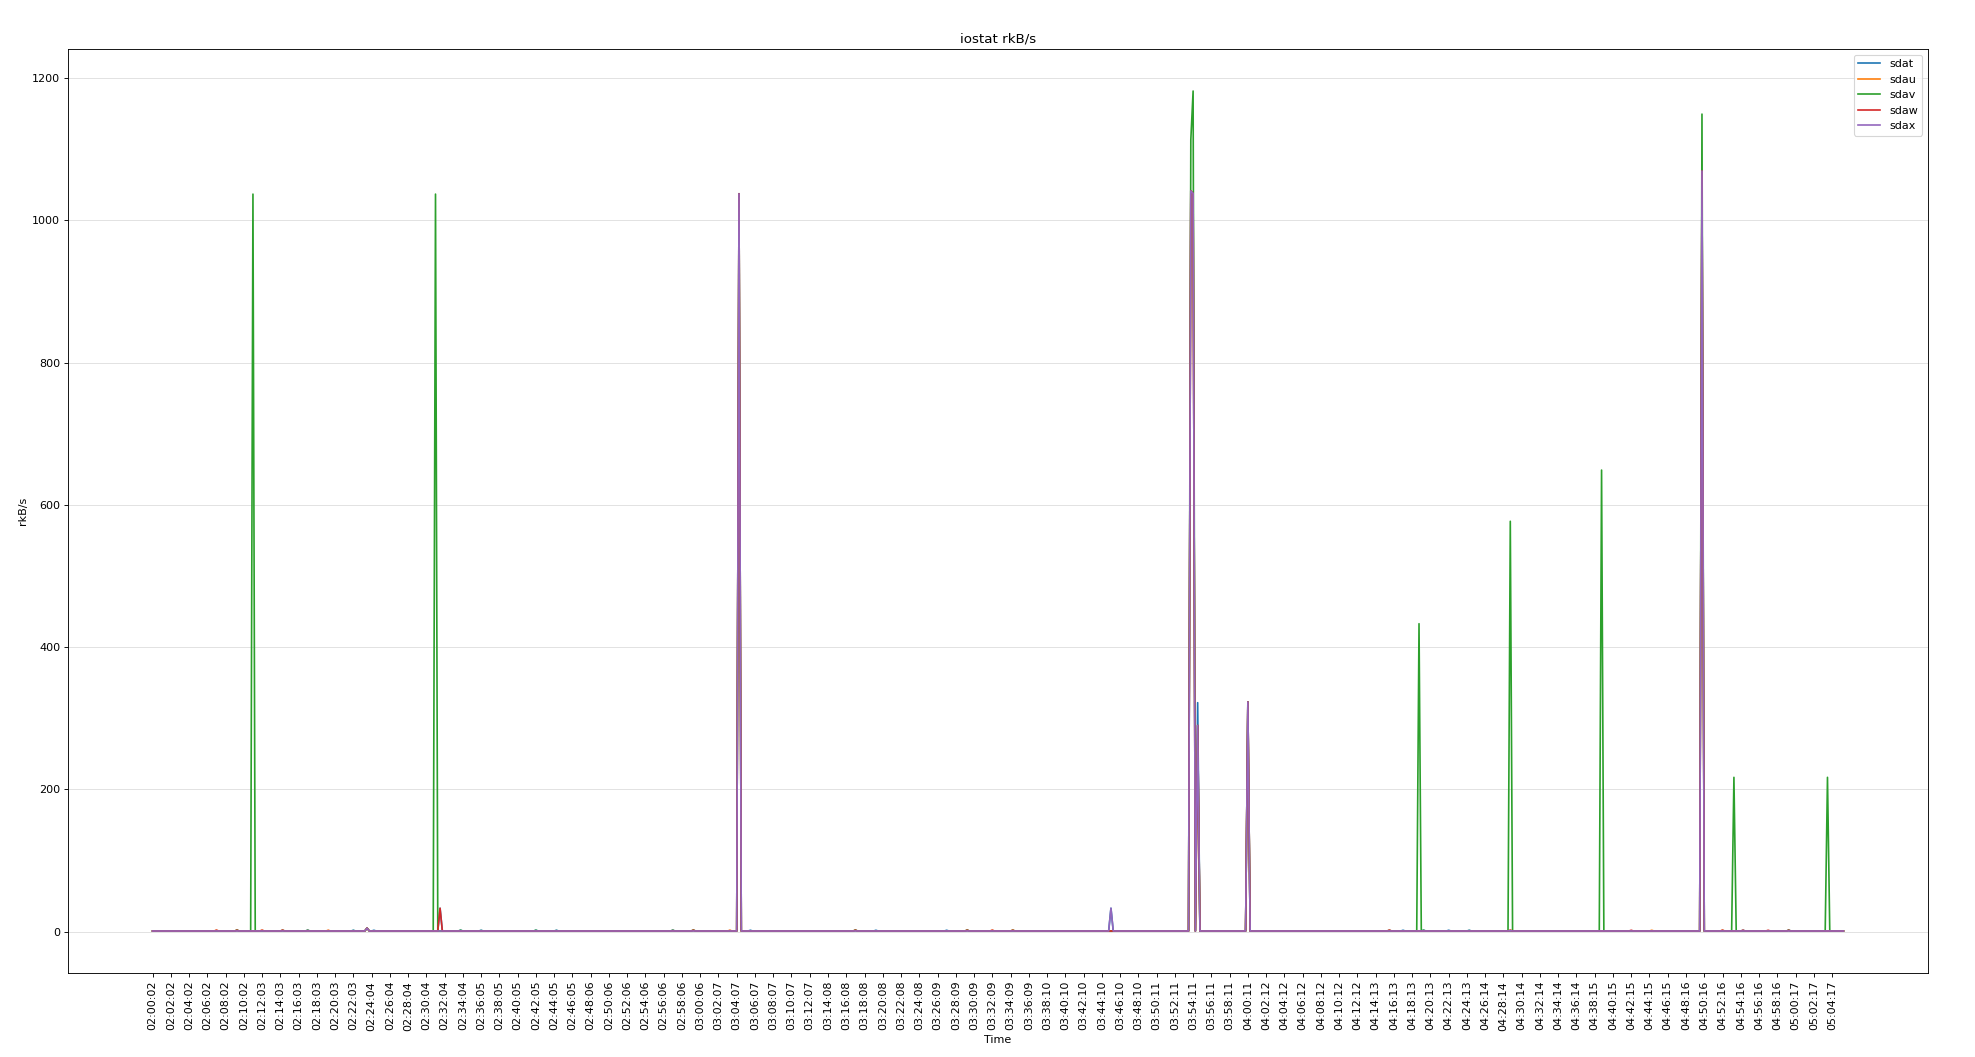
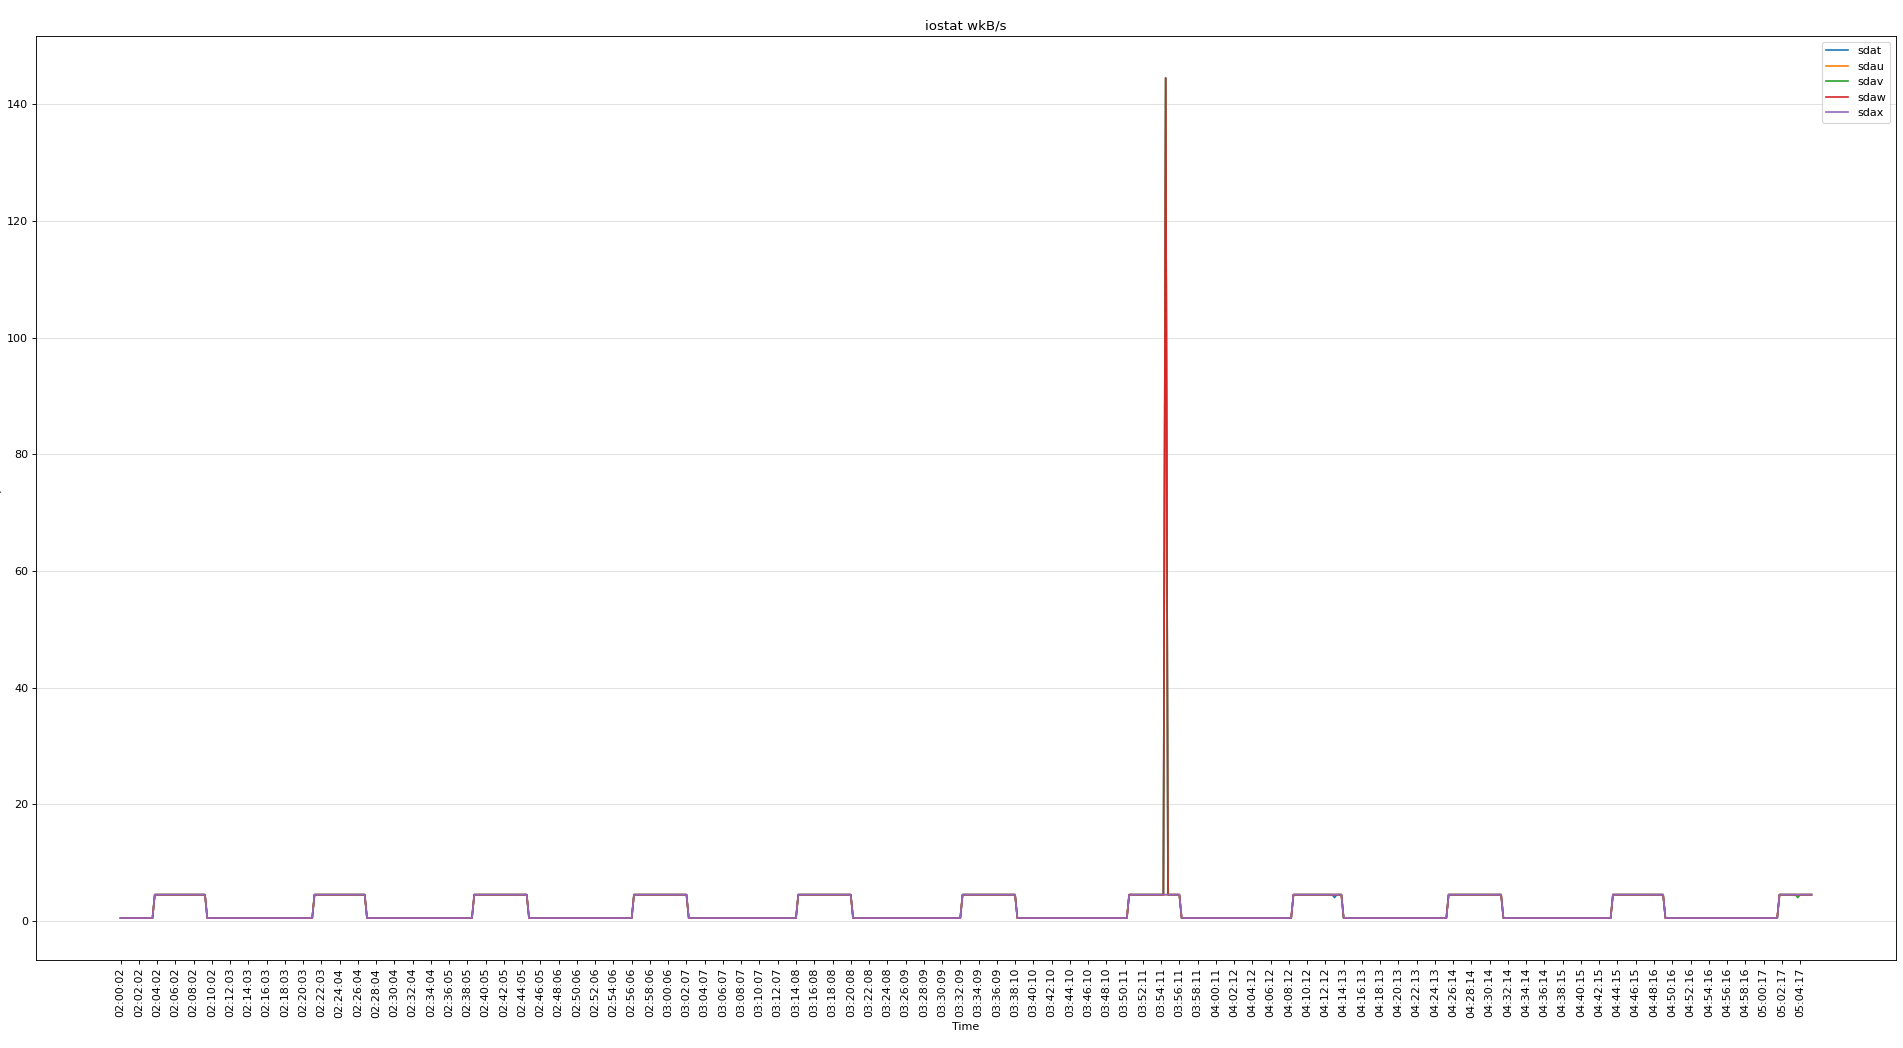
所有磁盘的繁忙程度
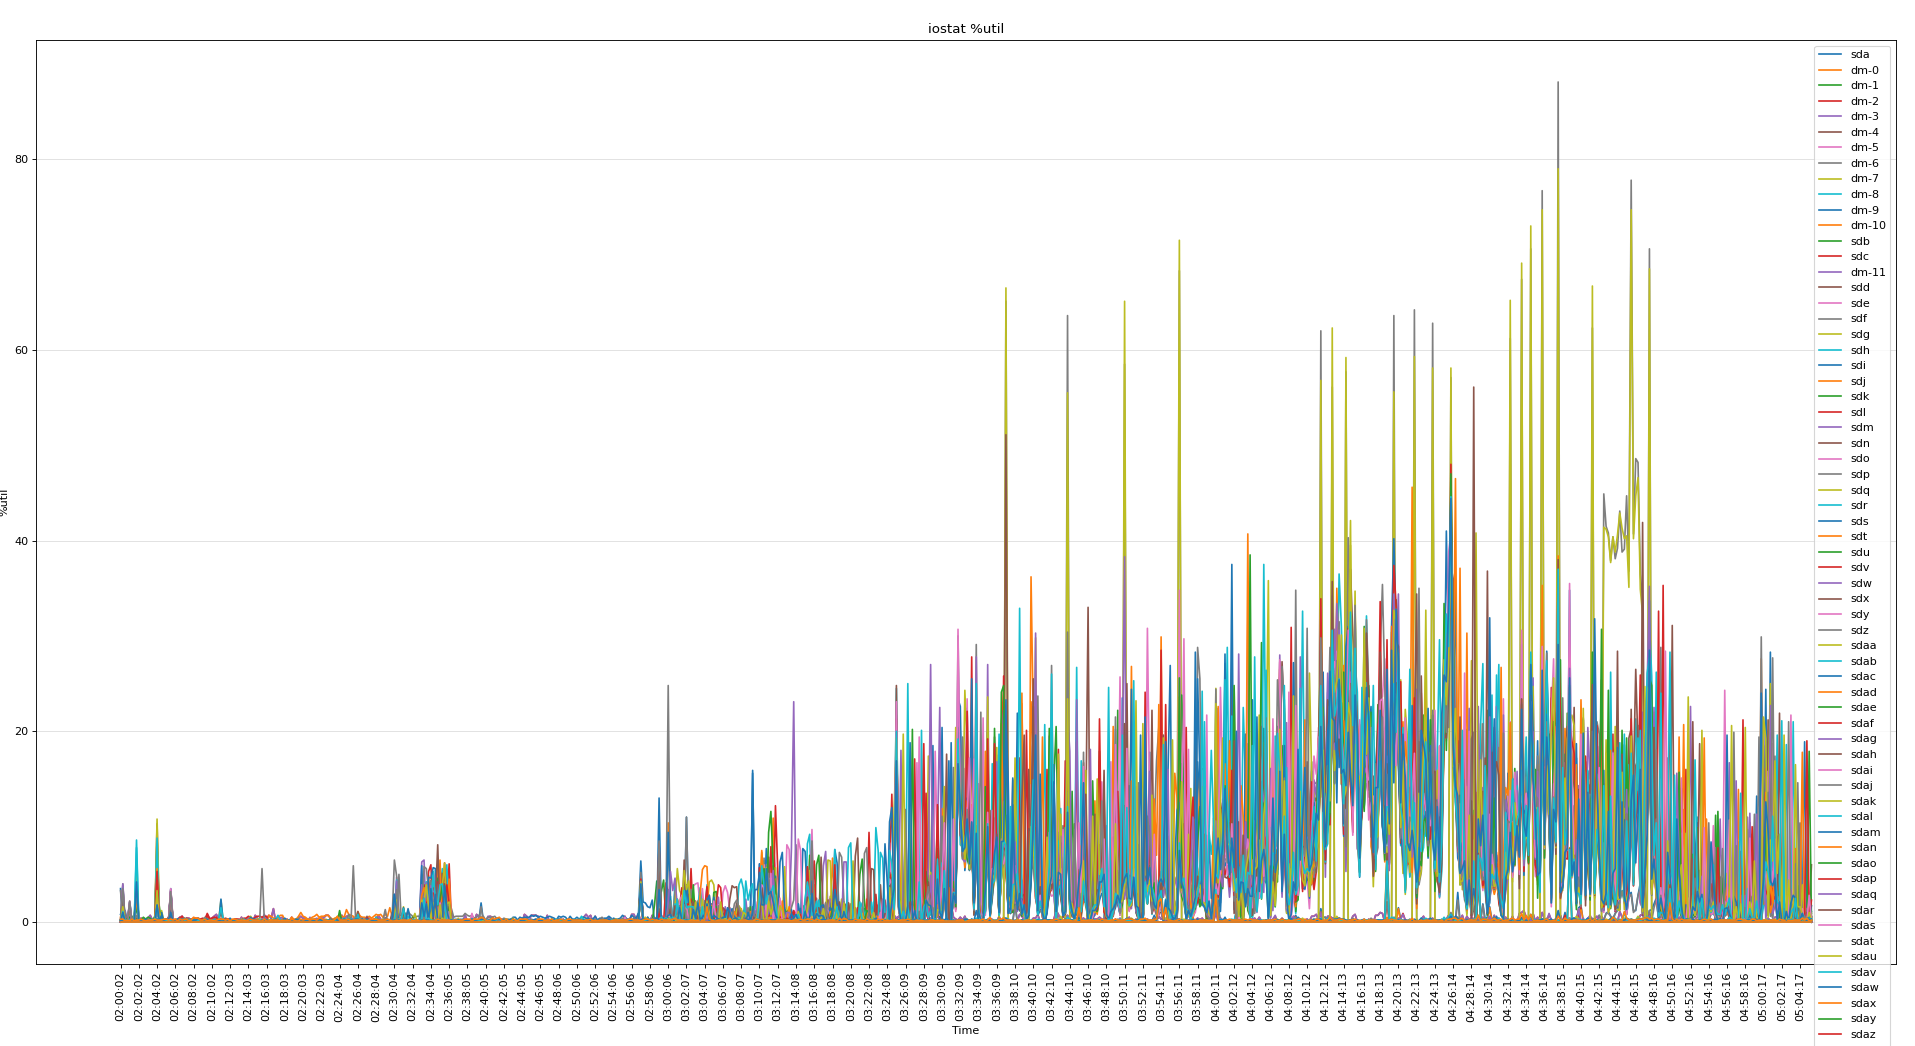
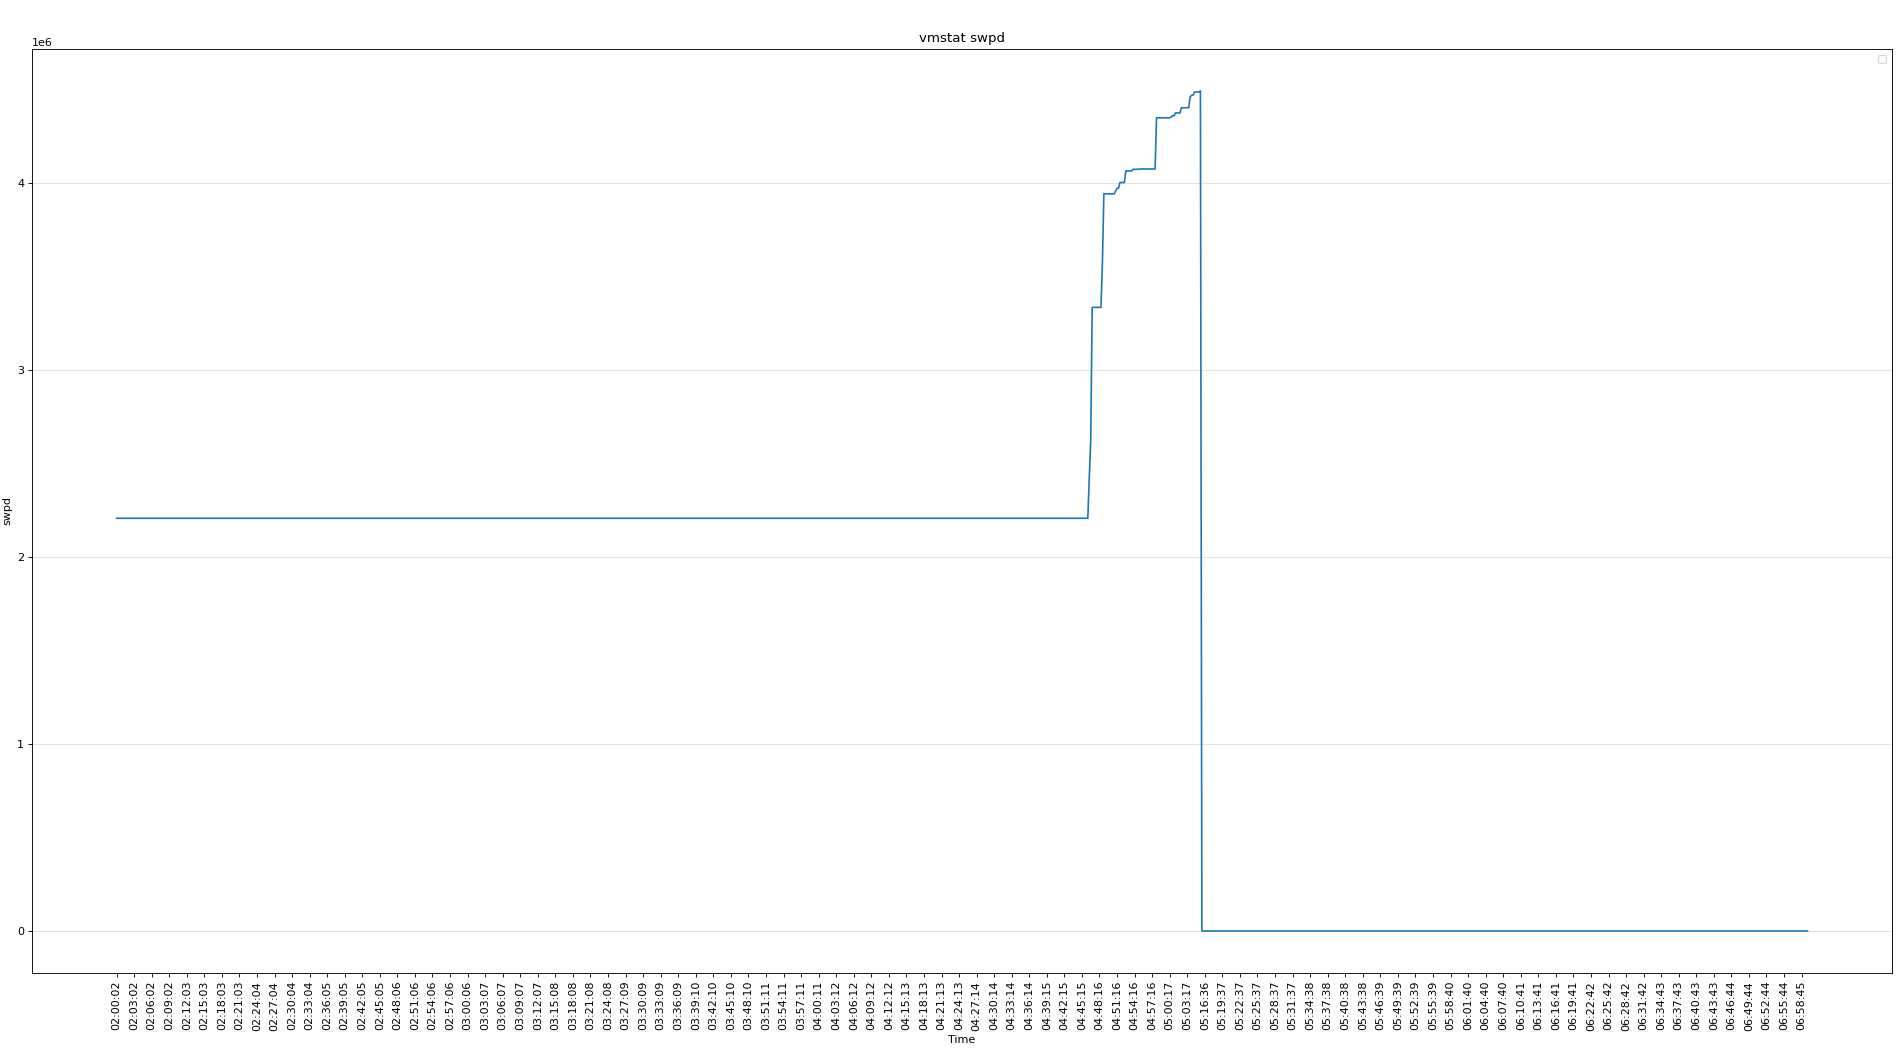
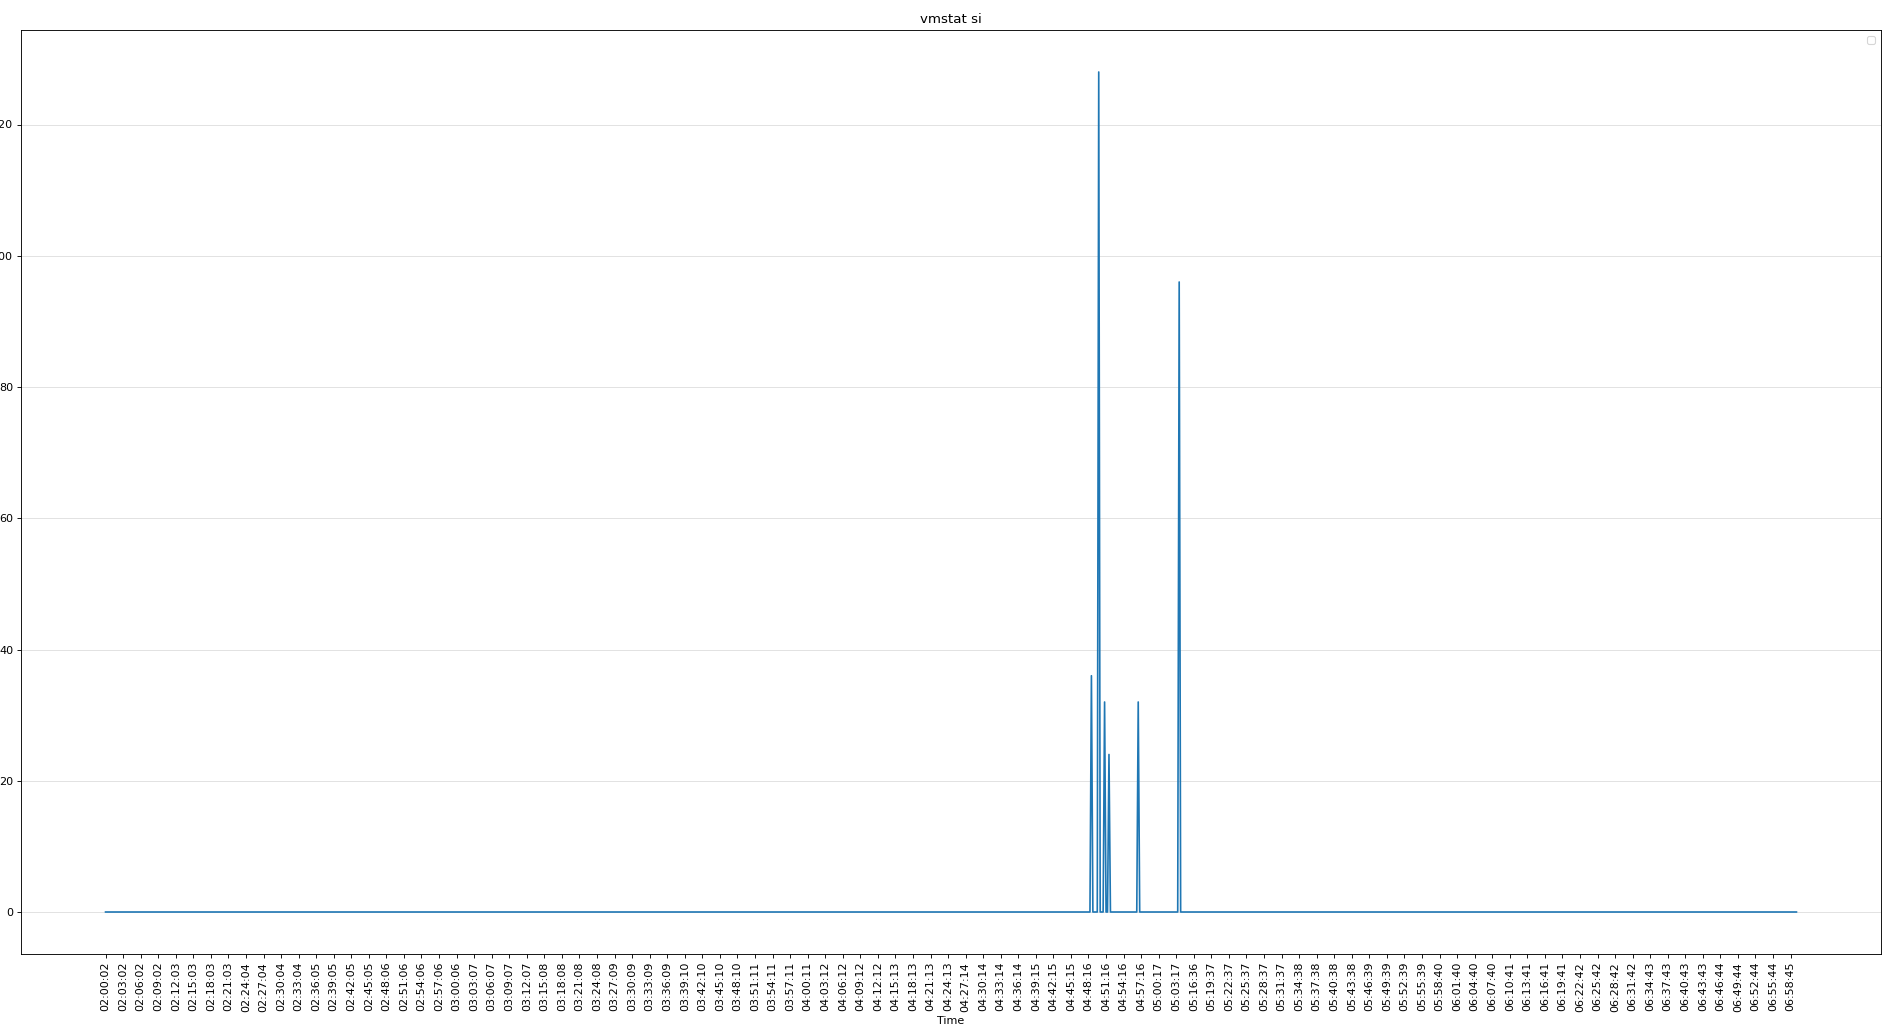
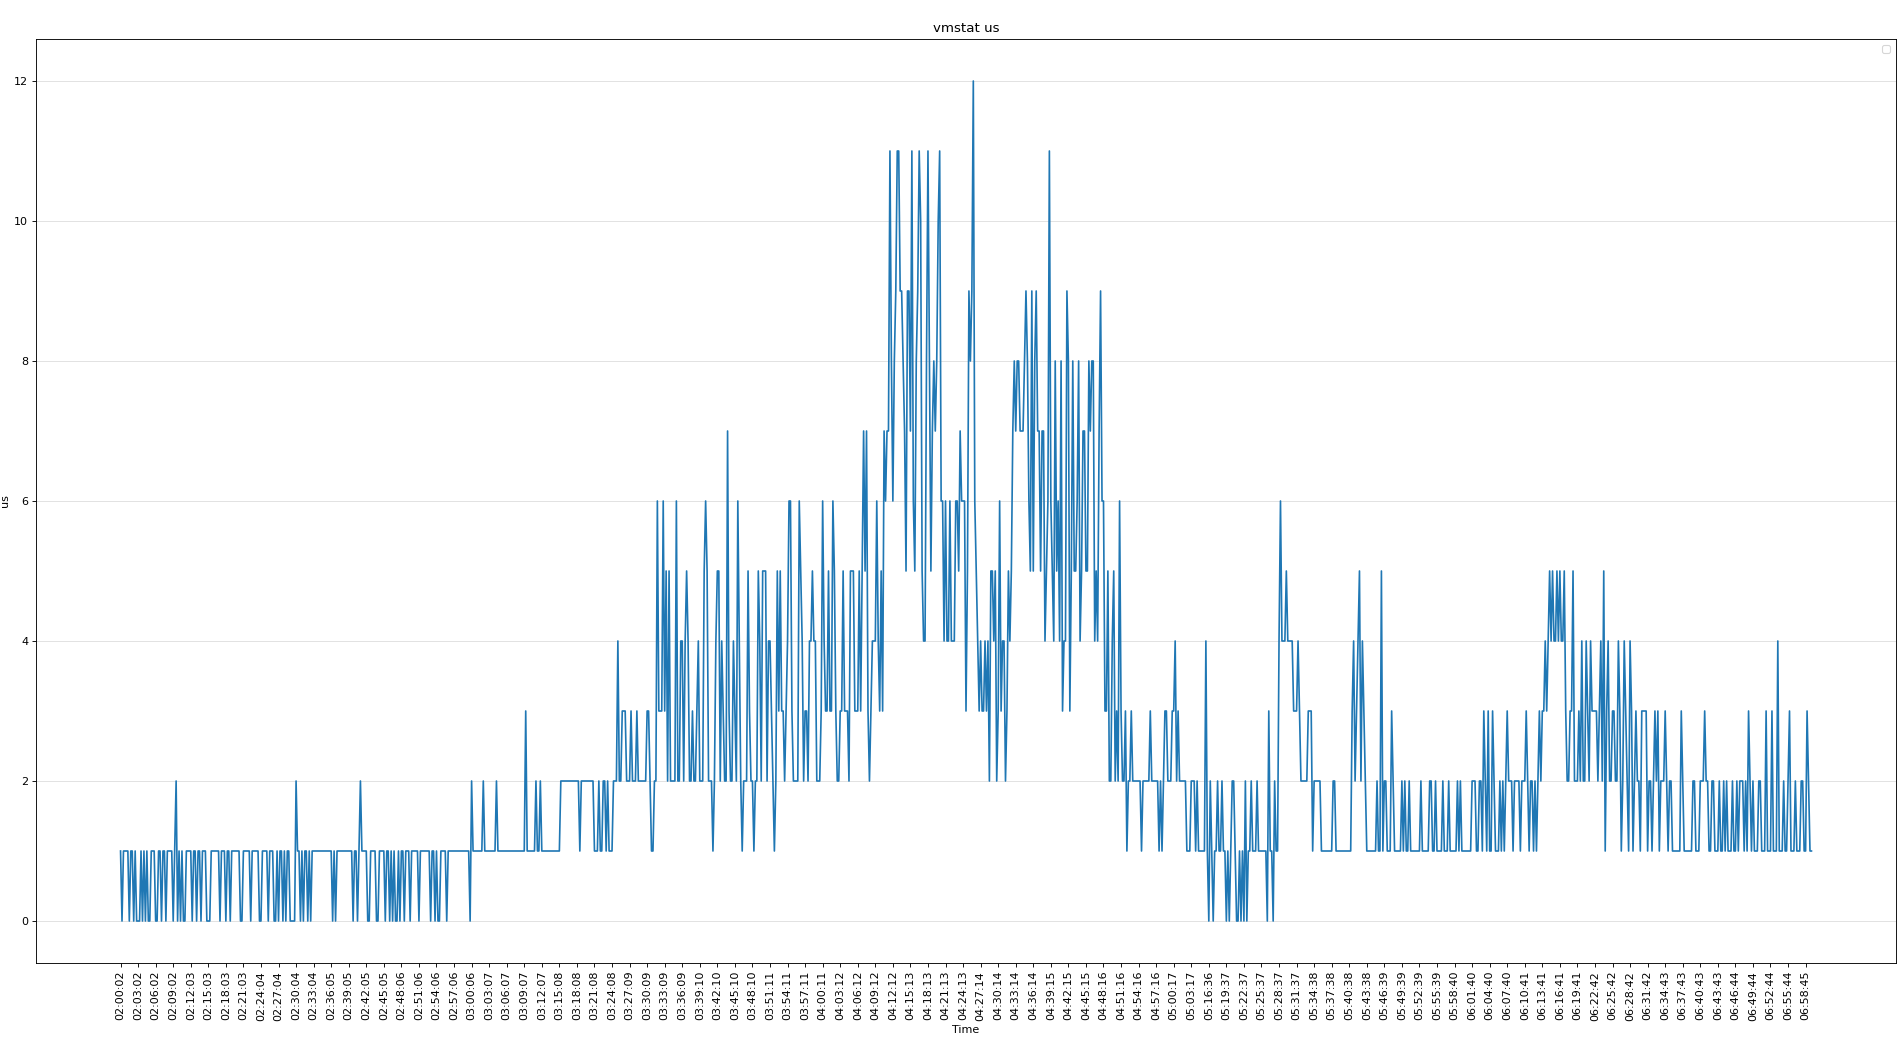
可见磁盘的问题不大,下面分析vmstat可以看出当时内存使用非常严重
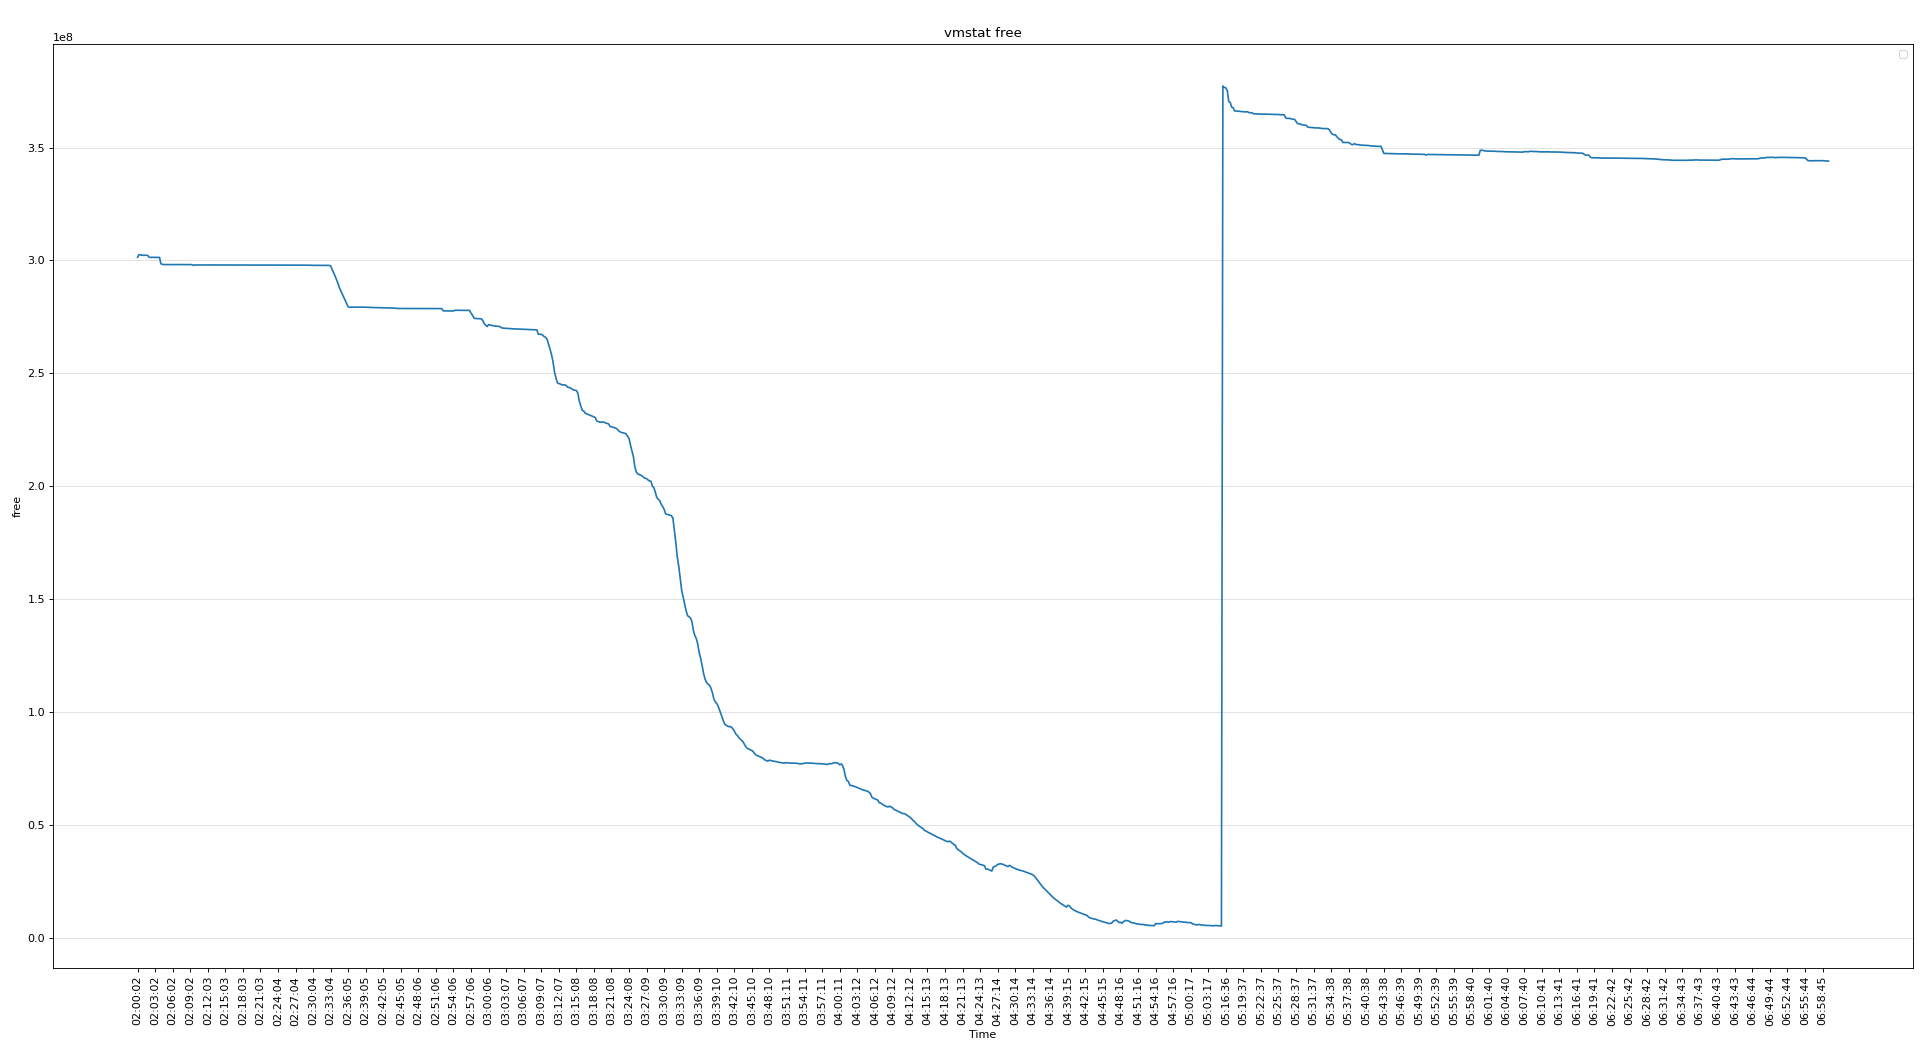
使用了SWAP
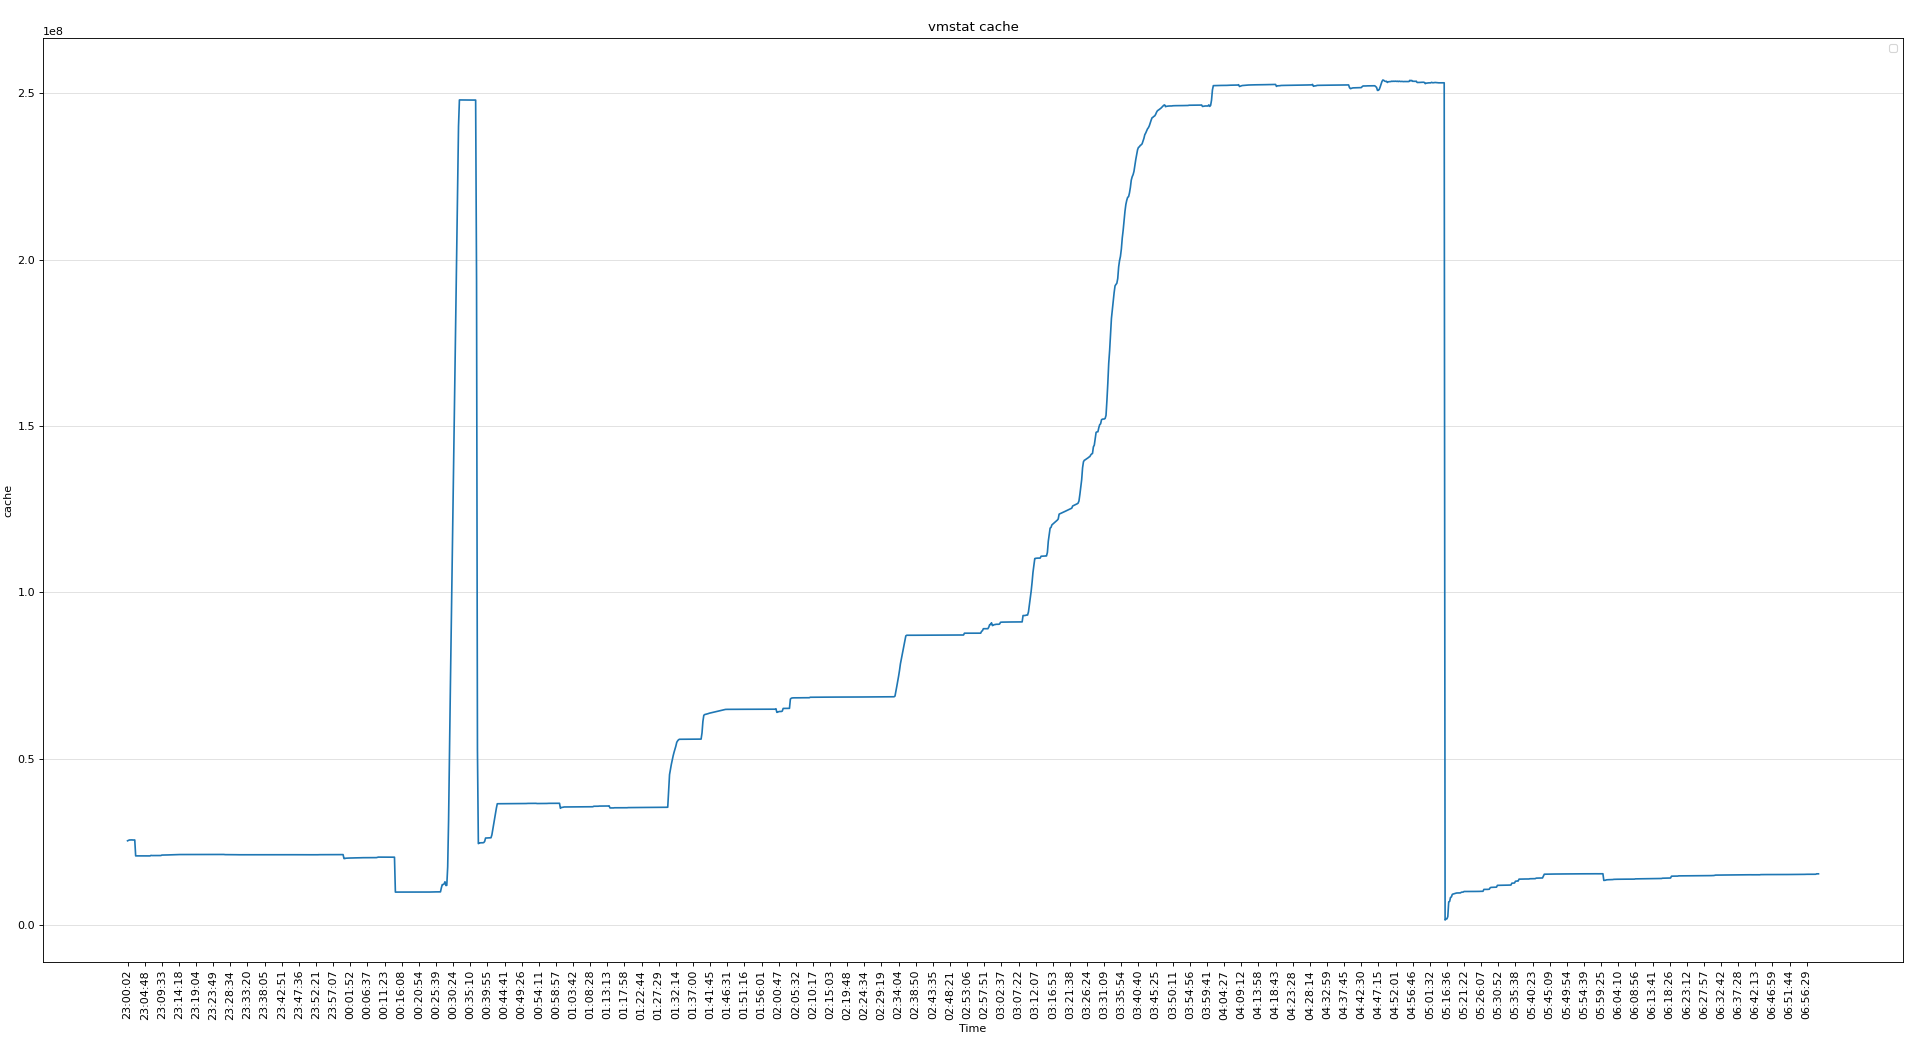
cache使用较多,不知道为啥
CPU使用率不高
-
知识点
oracle@rac2:/home/oracle> cat /proc/sys/vm/min_free_kbytes   # 页最小阈值
4194304
页低阈值 pages_low = pages_min*5/4 = 5242880k
页高阈值 pages_high = pages_min*3/2 = 6291456k

# 剩余内存小于页最小阈值, 说明进程可⽤内存都耗尽了, 只有内核才可以分配内存。
# 剩余内存落在页最小阈值和页低阈值中间, 说明内存压力比较大, 剩余内存不多了。 这时 kswapd0 会执⾏内存回收,直到剩余内存大于页高阈值为止。
# 剩余内存落在页低阈值和页高阈值中间, 说明内存有一定压力, 但还可以满⾜新内存请求。
# 剩余内存大于页高阈值, 说明剩余内存比较多, 没有内存压力。
- 节点2重启前,剩余内存较少(5190700k), 小于 pages_low(5242880K),内存压力大。
zzz ***Tue Jan 11 05:05:32 CST 2022
procs -----------memory---------- ---swap-- -----io---- -system-- ------cpu-----
 r  b   swpd   free   buff  cache   si   so    bi    bo   in   cs us sy id wa st
16  1 4490752 5207092  84692 253125568    0    0   478   273    0    0  2  2 95  0  0
 6  1 4494592 5189996  84708 253123104    0 3324 30951 34025 197572 111405  1  3 96  0  0
 4  0 4494848 5190700  84732 253122400    0  188 24189  3557 146797 88372  1  2 98  0  0
Linux OSWbb v8.3.2 rac2
SNAP_INTERVAL 15
CPU_CORES 80
VCPUS 160
OSWBB_ARCHIVE_DEST /oracle/app/grid/oracle.ahf/data/repository/suptools/rac2/oswbb/grid/archive
zzz ***Tue Jan 11 05:16:06 CST 2022
procs -----------memory---------- ---swap-- -----io---- -system-- ------cpu-----
 r  b   swpd   free   buff  cache   si   so    bi    bo   in   cs us sy id wa st
12  1      0 380316096   6660 1503980    0    0   159     8  372  219  1  4 95  0  0
 7  0      0 378362304   7852 1584300    0    0 24612  4577 90896 98582  6  2 92  0  0
15  0      0 377275776   9536 1601152    0    0 21580 21502 102854 123845  4  2 94  0  0
- 数据库 SGA(300G) + PGA(80G) + 进程内存(3000个进程左右,预估每个3M,合计9G) < 400G
[root@pg13 ~]# cat oswps.sh
fname=$1
data_array=(`grep "zzz" $fname |awk -F"***" '{print $2}' |sed 's/ /_/g'`)

for i in ${!data_array[@]};
do
        sed_start_1=${data_array[$i]}
        sed_start_2=`echo $sed_start_1 |sed 's/_/ /g'`
        i=$i+1
        sed_end=${data_array[$i]}
        sed_end=`echo $sed_end |sed 's/_/ /g'`

        num=`sed -n "/$sed_start_2/,/$sed_end/p" $fname |egrep ^oracle |wc -l`
        echo $sed_start_1 $num
done

[root@pg13 ~]# sh oswps.sh rac2_ps_22.01.11.0500.dat
Tue_Jan_11_05:03:47_CST_2022 3022
Tue_Jan_11_05:04:02_CST_2022 3031
Tue_Jan_11_05:04:17_CST_2022 0
Tue_Jan_11_05:16:06_CST_2022 6
Tue_Jan_11_05:16:21_CST_2022 0
Tue_Jan_11_05:16:36_CST_2022 0
Tue_Jan_11_05:16:51_CST_2022 0
Tue_Jan_11_05:17:06_CST_2022 6
Tue_Jan_11_05:17:21_CST_2022 2
Tue_Jan_11_05:17:36_CST_2022 74
- 分析 meminfo
从 meminfo 看,CACHE使用较多(250G), 匿名页使用也较多(163G),CACHE一般为文件系统页缓存(ORACLE ASM 不使用 CACHE),从PS的监控数据看,未找到异常占用内存的进程。
但后面分现 meminfo 中还有一个异常点,就是 pagetables 占的内存较多(PageTables: 91600048 kB),剩余的大页较多(HugePages_Free: 153805),不正常。
zzz ***Tue Jan 11 05:05:32 CST 2022
MemTotal:       790552132 kB
MemFree:         5201744 kB
MemAvailable:          0 kB
Buffers:           84692 kB
Cached:         250267324 kB  # <<<<< 250G
SwapCached:        17512 kB
Active:         163760368 kB  # <<<<< 163G
Inactive:       113563000 kB
Active(anon):   163400368 kB
Inactive(anon): 113033788 kB
Active(file):     360000 kB
Inactive(file):   529212 kB
Unevictable:     4251944 kB
Mlocked:         4252088 kB
SwapTotal:      20971516 kB
SwapFree:       16480764 kB
Dirty:               204 kB
Writeback:             0 kB
AnonPages:      31370864 kB
Mapped:         207003588 kB
Shmem:          249168216 kB
Slab:            2858256 kB
SReclaimable:     962168 kB
SUnreclaim:      1896088 kB
KernelStack:      119856 kB
PageTables:     91600048 kB  # <<<<< 91G
NFS_Unstable:          0 kB
Bounce:                0 kB
WritebackTmp:          0 kB
CommitLimit:    218627868 kB
Committed_AS:   313497152 kB
VmallocTotal:   34359738367 kB
VmallocUsed:     2418400 kB
VmallocChunk:   34357114360 kB
HardwareCorrupted:     0 kB
AnonHugePages:         0 kB
CmaTotal:              0 kB
CmaFree:               0 kB
HugePages_Total:   192988
HugePages_Free:    153805  # <<<<< 300G
HugePages_Rsvd:        0
HugePages_Surp:        0
Hugepagesize:       2048 kB
DirectMap4k:    34501632 kB
DirectMap2M:    242862080 kB
DirectMap1G:    528482304 kB
继续分析,查看DB ALERT LOG,可以看到在打完补丁,起库的日志中看到大页只分配了39183(76G),剩余共享内存使用的4k的页,分配了58581835(223G)。
2022-01-11T00:28:34.776117+08:00
 Domain name: user.slice
2022-01-11T00:28:34.776192+08:00
 Per process system memlock (soft) limit = UNLIMITED
2022-01-11T00:28:34.776257+08:00
 Expected per process system memlock (soft) limit to lock
 instance MAX SHARED GLOBAL AREA (SGA) into memory: 300G
2022-01-11T00:28:34.776383+08:00
 Available system pagesizes:
  4K, 2048K
2022-01-11T00:28:34.776504+08:00
 Supported system pagesize(s):
2022-01-11T00:28:34.776567+08:00
  PAGESIZE  AVAILABLE_PAGES  EXPECTED_PAGES  ALLOCATED_PAGES  ERROR(s)
2022-01-11T00:28:34.776633+08:00
        4K       Configured              14        58581835        NONE
2022-01-11T00:28:34.777018+08:00
     2048K            39387          153601           39183        NONE
- 这里为什么没有全用上大页呢,怀疑当时起库时可用的大页不足。
查看打补丁时的停库(00:13:23)和起库时间(00:28:34)
2022-01-11T00:04:57.263597+08:00
Thread 2 advanced to log sequence 26368 (LGWR switch),  current SCN: 17283142928376
  Current log# 7 seq# 26368 mem# 0: +DATA/ORCL/ONLINELOG/group_7.398.1080744843
2022-01-11T00:04:57.492759+08:00
TT03 (PID:103953): SRL selected for T-2.S-26368 for LAD:2
2022-01-11T00:05:02.189653+08:00
ARC1 (PID:47485): Archived Log entry 99931 added for T-2.S-26367 ID 0xecb9a320 LAD:1
# 停库时间
2022-01-11T00:13:23.046802+08:00
Shutting down ORACLE instance (immediate) (OS id: 43111)

2022-01-11T00:14:10.945385+08:00
Stopping background process RBAL
2022-01-11T00:14:14.725352+08:00
freeing rdom 0
freeing the fusion rht of pdb 0
2022-01-11T00:14:28.584765+08:00
Warning: 2 processes are still attacheded to shmid 753673:
 (size: 57344 bytes, creator pid: 18969, last attach/detach pid: 28293)
Instance shutdown complete (OS id: 43111)
# 起库时间
2022-01-11T00:28:34.620322+08:00
Starting ORACLE instance (normal) (OS id: 54670)
2022-01-11T00:28:34.773499+08:00
************************************************************
Instance SGA_TARGET = 307200 MB and SGA_MAX_SIZE = 307200 MB
************************************************************
- 起库前(00:28:34)大页内存的使用情况,剩余39808(77G),果然起库时可用的大页不足。
zzz ***Tue Jan 11 00:28:24 CST 2022
MemTotal:       790552132 kB
MemFree:        359520492 kB
MemAvailable:   354082620 kB
Buffers:          142740 kB
Cached:         10248144 kB
...
HugePages_Total:   192988
HugePages_Free:    39808
HugePages_Rsvd:      421
HugePages_Surp:        0
Hugepagesize:       2048 kB
- 所以再次怀疑打补丁关库(00:13:23)后,大页没有释放。
# 停库时间
2022-01-11T00:13:23.046802+08:00
Shutting down ORACLE instance (immediate) (OS id: 43111)

2022-01-11T00:14:10.945385+08:00
Stopping background process RBAL
2022-01-11T00:14:14.725352+08:00
freeing rdom 0
freeing the fusion rht of pdb 0
2022-01-11T00:14:28.584765+08:00
Warning: 2 processes are still attacheded to shmid 753673:
 (size: 57344 bytes, creator pid: 18969, last attach/detach pid: 28293)
Instance shutdown complete (OS id: 43111)
可以看到数据库是在00:14:28分关闭的,但大00:22:09时,大页还没有释放。
zzz ***Tue Jan 11 00:22:09 CST 2022
MemTotal:       790552132 kB
MemFree:        361520900 kB
MemAvailable:   355090684 kB
Buffers:          130284 kB
Cached:          8306876 kB
...
HugePages_Total:   192988
HugePages_Free:    39808
HugePages_Rsvd:      421
HugePages_Surp:        0
Hugepagesize:       2048 kB
同时细看日志,发现关闭时,仍有进程在使用共享内存。
2022-01-11T00:14:28.584765+08:00
Warning: 2 processes are still attacheded to shmid 753673:
 (size: 57344 bytes, creator pid: 18969, last attach/detach pid: 28293)
通过ps监控数据,定位到关库后,还没有关闭的server进程(82595),在00:20:33已经关完数据库的情况下又产生一个进程(73140)。正常数据库关闭后,SERVER进程会自动关掉,这次挺奇怪。
grid@rac2:/home/grid> cat /oracle/app/grid/.../oswps/rac2_ps_22.01.11.0000.dat |sed -n '/00:14:38/,/00:28:24/p'|egrep "^oracle" |grep oracleorcl2

oracle    82595  82535  19  0.0  0.0 315033232 15416 pipe_wait  S 00:13:37 00:00:00 oracleorcl2 (DESCRIPTION=(LOCAL=YES)(ADDRESS=(PROTOCOL=beq)))
oracle    82595  82535  19  0.0  0.0 315033232 15416 pipe_wait  S 00:13:37 00:00:00 oracleorcl2 (DESCRIPTION=(LOCAL=YES)(ADDRESS=(PROTOCOL=beq)))
oracle    82595  82535  19  0.0  0.0 315033232 15416 pipe_wait  S 00:13:37 00:00:00 oracleorcl2 (DESCRIPTION=(LOCAL=YES)(ADDRESS=(PROTOCOL=beq)))
oracle    73140  73132  19  0.0  0.0 458072 14960 pipe_wait     S 00:20:33 00:00:00 oracleorcl2 (DESCRIPTION=(LOCAL=YES)(ADDRESS=(PROTOCOL=beq)))
oracle    82595  82535  19  0.0  0.0 315033232 15416 pipe_wait  S 00:13:37 00:00:00 oracleorcl2 (DESCRIPTION=(LOCAL=YES)(ADDRESS=(PROTOCOL=beq)))
oracle    73140  73132  19  0.0  0.0 458072 14960 pipe_wait     S 00:20:33 00:00:00 oracleorcl2 (DESCRIPTION=(LOCAL=YES)(ADDRESS=(PROTOCOL=beq)))
oracle    82595  82535  19  0.0  0.0 315033232 15416 pipe_wait  S 00:13:37 00:00:00 oracleorcl2 (DESCRIPTION=(LOCAL=YES)(ADDRESS=(PROTOCOL=beq)))
oracle    73140  73132  19  0.0  0.0 458072 14960 pipe_wait     S 00:20:33 00:00:00 oracleorcl2 (DESCRIPTION=(LOCAL=YES)(ADDRESS=(PROTOCOL=beq)))
oracle    82595  82535  19  0.0  0.0 315033232 15416 pipe_wait  S 00:13:37 00:00:00 oracleorcl2 (DESCRIPTION=(LOCAL=YES)(ADDRESS=(PROTOCOL=beq)))
oracle    73140  73132  19  0.0  0.0 458072 14960 pipe_wait     S 00:20:33 00:00:00 oracleorcl2 (DESCRIPTION=(LOCAL=YES)(ADDRESS=(PROTOCOL=beq)))
oracle    82595  82535  19  0.0  0.0 315033232 15416 pipe_wait  S 00:13:37 00:00:00 oracleorcl2 (DESCRIPTION=(LOCAL=YES)(ADDRESS=(PROTOCOL=beq)))
追踪一下进程(82595)
grid@rac2:/home/grid> cat /oracle/app/grid/oracle.ahf/data/repository/suptools/rac2/oswbb/grid/archive/oswps/rac2_ps_22.01.11.0000.dat |sed -n '/00:15:23/,/00:15:38/p'|egrep "^oracle" |grep oracleorcl2
oracle    82595  82535  19  0.0  0.0 315033232 15416 pipe_wait                               S 00:13:37 00:00:00 oracleorcl2 (DESCRIPTION=(LOCAL=YES)(ADDRESS=(PROTOCOL=beq)))

grid@rac2:/home/grid> cat /oracle/app/grid/oracle.ahf/data/repository/suptools/rac2/oswbb/grid/archive/oswps/rac2_ps_22.01.11.0000.dat |sed -n '/00:15:23/,/00:15:38/p'|egrep 82535
oracle    82595  82535  19  0.0  0.0 315033232 15416 pipe_wait                               S 00:13:37 00:00:00 oracleorcl2 (DESCRIPTION=(LOCAL=YES)(ADDRESS=(PROTOCOL=beq)))
oracle    82535  72407  19  0.0  0.0 114040 13312 n_tty_read                                 S 00:13:37 00:00:00 sqlplus   as sysdba

grid@rac2:/home/grid> cat /oracle/app/grid/oracle.ahf/data/repository/suptools/rac2/oswbb/grid/archive/oswps/rac2_ps_22.01.11.0000.dat |sed -n '/00:15:23/,/00:15:38/p'|egrep 72407
oracle    82535  72407  19  0.0  0.0 114040 13312 n_tty_read                                 S 00:13:37 00:00:00 sqlplus   as sysdba
oracle    72407  72281  19  0.0  0.0 116788  3320 do_wait                                    S 00:13:32 00:00:00 -bash

grid@rac2:/home/grid> cat /oracle/app/grid/oracle.ahf/data/repository/suptools/rac2/oswbb/grid/archive/oswps/rac2_ps_22.01.11.0000.dat |sed -n '/00:15:23/,/00:15:38/p'|egrep 72281
oracle    72407  72281  19  0.0  0.0 116788  3320 do_wait                                    S 00:13:32 00:00:00 -bash
oracle    72281  69874  19  0.0  0.0 163376  2420 poll_schedule_timeout                      S 00:13:32 00:00:00 sshd: oracle@pts/2

grid@rac2:/home/grid> cat /oracle/app/grid/oracle.ahf/data/repository/suptools/rac2/oswbb/grid/archive/oswps/rac2_ps_22.01.11.0000.dat |sed -n '/00:15:23/,/00:15:38/p'|egrep 69874
root      69874  58356  19  0.0  0.0 163376  6036 poll_schedule_timeout                      S 00:13:31 00:00:00 sshd: oracle [priv]
oracle    72281  69874  19  0.0  0.0 163376  2420 poll_schedule_timeout                      S 00:13:32 00:00:00 sshd: oracle@pts/2

grid@rac2:/home/grid> cat /oracle/app/grid/oracle.ahf/data/repository/suptools/rac2/oswbb/grid/archive/oswps/rac2_ps_22.01.11.0000.dat |sed -n '/00:15:23/,/00:15:38/p'|egrep 58356
root     122271  58356  19  0.0  0.0 163376  6032 poll_schedule_timeout                      S 00:04:16 00:00:00 sshd: oracle [priv]
root     108972  58356  19  0.0  0.0 165196  5928 poll_schedule_timeout                      S 09:10:36 00:00:00 sshd: oracle [priv]
root      69874  58356  19  0.0  0.0 163376  6036 poll_schedule_timeout                      S 00:13:31 00:00:00 sshd: oracle [priv]
root      58356      1  19  0.0  0.0 112756  4352 poll_schedule_timeout                      S   Aug 19 00:04:31 /usr/sbin/sshd -D
root      47981  58356  19  0.0  0.0 167728  6424 poll_schedule_timeout                      S   Nov 06 00:00:00 sshd: hgaqjc [priv]
root      47614  58356  19  0.0  0.0 167716  6424 poll_schedule_timeout                      S   Nov 04 00:00:00 sshd: hgaqjc [priv]
root      31839  58356  19  0.0  0.0 163388  6028 poll_schedule_timeout                      S   Jan 05 00:00:00 sshd: oracle [priv]
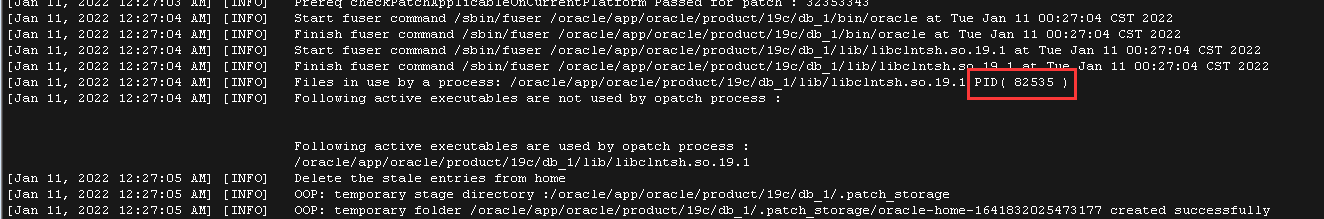
通过补丁的日志也能发现这个进程(82595)的父进程(82535),在安装补丁时显示仍在占用库文件libclntsh.so.19.1,同事kill了以后安装的补丁。
more /oracle/app/oracle/product/19c/db_1/cfgtoollogs/opatch/opatch2022-01-11_00-26-54AM_1.log
由于进程仍然在使用共享内存,导致无法回收共享内存段,HugePage仍在占用,导致重启后无足够的HugePage使用,重新分配4k的内存页。
- 遗留一个疑问点,进程(82595)未正常退出的原因(Oracle SR的回复)。
当时这个 server process 在执行一个 OS kernel 函数 pipe_wait, 看起来它在执行OS的 systemcall 并进入异常状态,
要进一步分析这个问题,必须当时就检查这个 process 执行的具体的 kernel level 的完整的 callstack:

使用root执行
# cat /proc/<OSPID>/stack <==替换这里的<OSPID>为当时出问题的进程

请您在下次发生类似问题时,收集未退出进程的 /proc/<OSPID>/stack

BTW: 我们查了一下,很多 hang 在 pipe_wait 上的的进程都是在做 OS vfs IO 操作。
总结
- 根据HugePage的变化总结本次故障
1. 数据库打补丁关库前(停库时间00:13:23),大页内存使用正常
zzz ***Tue Jan 11 00:12:38 CST 2022
HugePages_Total:   192988
HugePages_Free:    39808
HugePages_Rsvd:      421

2. 数据库打补丁关库后,起库前(起库时间00:28:34),共享内存没有释放,导致 HugePage 没有释放
zzz ***Tue Jan 11 00:22:09 CST 2022
HugePages_Total:   192988
HugePages_Free:    39808
HugePages_Rsvd:      421

3. 数据库打补丁起库后(起库时间00:28:34),剩余的大页内存正在被使用,因为剩余的大页不足以存放 SGA,所以 SGA 没有完全用上 HugePage,大部分使用的4K的页。
zzz ***Tue Jan 11 00:28:39 CST 2022
HugePages_Total:   192988
HugePages_Free:    38026
HugePages_Rsvd:    37822

zzz ***Tue Jan 11 00:28:54 CST 2022
HugePages_Total:   192988
HugePages_Free:    16400
HugePages_Rsvd:    16196

zzz ***Tue Jan 11 00:29:09 CST 2022
HugePages_Total:   192988
HugePages_Free:      869
HugePages_Rsvd:      665

4. 在 01:13:58 左右,HugePage 被释放,但是 Oracle 用不上。
zzz ***Tue Jan 11 01:13:58 CST 2022
HugePages_Total:   192988
HugePages_Free:    154049
HugePages_Rsvd:      244

同时82595进程也是在这个时间点消失的,脚本 grep 82595
Tue_Jan_11_01:13:43_CST_2022 1
Tue_Jan_11_01:13:58_CST_2022 0

5. 当数据库连接数高时页表占用过多内存,同时页表过大影响性能,最后内存不足,导致IO无法完成,节点驱逐。
zzz ***Tue Jan 11 05:16:06 CST 2022
HugePages_Total:   192988
HugePages_Free:    192988
HugePages_Rsvd:        0

6. 2021-01-11 05:17:22 数据库再次重启时,几乎全部分配的2m内存页(Hugepage),恢复了正常
zzz ***Tue Jan 11 05:19:37 CST 2022
HugePages_Total:   192988
HugePages_Free:    39810
HugePages_Rsvd:      423

2022-01-11T05:17:22.778865+08:00
 Available system pagesizes:
  4K, 2048K
2022-01-11T05:17:22.778981+08:00
 Supported system pagesize(s):
2022-01-11T05:17:22.779041+08:00
  PAGESIZE  AVAILABLE_PAGES  EXPECTED_PAGES  ALLOCATED_PAGES  ERROR(s)
2022-01-11T05:17:22.779104+08:00
        4K       Configured              14              14        NONE
2022-01-11T05:17:22.779226+08:00
     2048K           192988          153601          153601        NONE
- 总结下数据库启停流程
1. 确认主机
ip a
uname -a

2. 确认数据库和spfile
$ export ORACLE_SID=<SID of the instance>
$ export ORACLE_HOME=<location of ORACLE_HOME>
$ sqlplus / as sysdba
SQL> show parameter name
SQL> show parameter spfile

3. 注释 crontab ,注意root用户下是否也存在数据库相关的crontab

$ crontab –l > /home/oracle/crontab_bak_xxxx
$ crontab –e  --清空

4. 检查活动会话,是否存在类似备份的任务,提前处理掉
SQL> @ase.sql

5. 关闭监听
su - grid
srvctl stop listener -node rac2

6. 杀会话
su - oracle
ps -ef|grep "LOCAL=NO"|grep $ORACLE_SID |grep -v grep |wc -l
ps -ef|grep "LOCAL=NO"|grep $ORACLE_SID |grep -v grep |awk '{print "kill -9 " $2}'|sh

7. 检查是否有未提交事物
select
  s.username,
  t.xidusn,
  t.xidslot,
  t.xidsqn,
  x.ktuxesiz
from
  sys.x$ktuxe  x,
  sys.v_$transaction  t,
  sys.v_$session  s
where
  x.inst_id = userenv('Instance') and
  x.ktuxesta = 'ACTIVE' and
  x.ktuxesiz =1 and
  t.xidusn = x.ktuxeusn and
  t.xidslot = x.ktuxeslt and
  t.xidsqn = x.ktuxesqn and
  s.saddr = t.ses_addr;

8. 检查session,切日志做checkpoint
select inst_id, sessions_current,sessions_highwater from gv$license;
@kill TYPE='USER'
alter system switch logfile;
alter system archive log current;
alter system checkpoint;

9. 关闭数据库,跟踪 alert log,是否异常输出
shutdown immediate

如果使用srvctl关闭数据库,注意加参数,默认是abort
srvctl stop instance -db orcl -instance orcl1 -stopoption IMMEDIATE
srvctl stop database -db orcl -stopoption IMMEDIATE

10. 确认共享内存段已释放,是否存在残留进程
cat /proc/meminfo    --检查大页内存已释放
ipcs -m
对于一个主机上多个实例时,无法从共享段区分属于哪个实例使用,需要增加一步使用oracle的sysresv工具:
$ORACLE_HOME/bin/sysresv

如果实例关闭后共享内存在等待1-2分钟未自动释放,可以使用ipcrm手动释放共享内存段
ipcrm -m shmid    //删除共享内存段

检查是否存在残留进程
ps -ef|grep LOCAL |grep $ORACLE_SID |grep -v grep

11. 启动数据库,跟踪 alert log
SQL> startup
或者使用srvctl
srvctl start instance -db orcl -instance orcl1
srvctl start database -db orcl


2022-01-10T23:54:29.121877+08:00
 Available system pagesizes:
  4K, 2048K
2022-01-10T23:54:29.121989+08:00
 Supported system pagesize(s):
2022-01-10T23:54:29.122047+08:00
  PAGESIZE  AVAILABLE_PAGES  EXPECTED_PAGES  ALLOCATED_PAGES  ERROR(s)
2022-01-10T23:54:29.122105+08:00
        4K       Configured              14              14        NONE
2022-01-10T23:54:29.122474+08:00
     2048K           192475          153601          153601        NONE

12. 起库后的检查
检查是否可以切换日志
alter system switch logfile;

检查监听
lsnrctl status

检查OGG,检查Dataguard
最后修改时间:2022-01-14 10:21:52
【版权声明】本文为墨天轮用户原创内容,转载时必须标注文章的来源(墨天轮),文章链接,文章作者等基本信息,否则作者和墨天轮有权追究责任。如果您发现墨天轮中有涉嫌抄袭或者侵权的内容,欢迎发送邮件至:contact@modb.pro进行举报,并提供相关证据,一经查实,墨天轮将立刻删除相关内容。
