


客户反应一套数据库alert日志报ORA-00600 [kdsgrp1],需要分析定位。
问题分析
alert日志报错如下:
Errors in file /home/app/oracle/diag/rdbms/stdadt/stdadt/trace/stdadt_ora_38276.trc  (incident=62491):
ORA-00600: , : [kdsgrp1], [], [], [], [], [], [], [], [], [], [], []
Use ADRCI or Support Workbench to package the incident.
See Note 411.1 at My Oracle Support for error and packaging details.
Thu Jul 09 11:13:06 2020
Sweep [inc][62491]: completed
Thu Jul 09 11:13:07 2020
Errors in file /home/app/oracle/diag/rdbms/stdadt/stdadt/trace/stdadt_ora_38830.trc  (incident=62492):
ORA-00600: , : [kdsgrp1], [], [], [], [], [], [], [], [], [], [], []
Use ADRCI or Support Workbench to package the incident.
See Note 411.1 at My Oracle Support for error and packaging details.
Thu Jul 09 11:13:52 2020
Errors in file /home/app/oracle/diag/rdbms/stdadt/stdadt/trace/stdadt_ora_38201.trc  (incident=62155):
ORA-00600: , : [kdsgrp1], [], [], [], [], [], [], [], [], [], [], []
Use ADRCI or Support Workbench to package the incident.
See Note 411.1 at My Oracle Support for error and packaging details.
通过trace文件查看,报错的都是同一条SQL,
========= Dump for incident 62330 (ORA 600 [kdsgrp1]) ========

*** 2020-07-09 09:05:49.147
dbkedDefDump(): Starting incident default dumps (flags=0x2, level=3, mask=0x0)

*** 2020-07-09 09:05:49.175
----- Current SQL Statement for this session (sql_id=0x8bxd0727n8s) -----
select * from (    select * from (     select * from TBL_LS_STANDARD_EVENT_BI where OPT_TIME >= TO_DATE(:1, 'yyyymmdd')-1 and OPT_TIME <= TO_DATE(:2, 'yyyymmdd') and STANDARDED_FLAG = 0 and FILTER_FLAG = 0    )b     where              to_number(to_char(OPT_TIME,'ss')) between 20 and 39               )c  where rownum <= :3
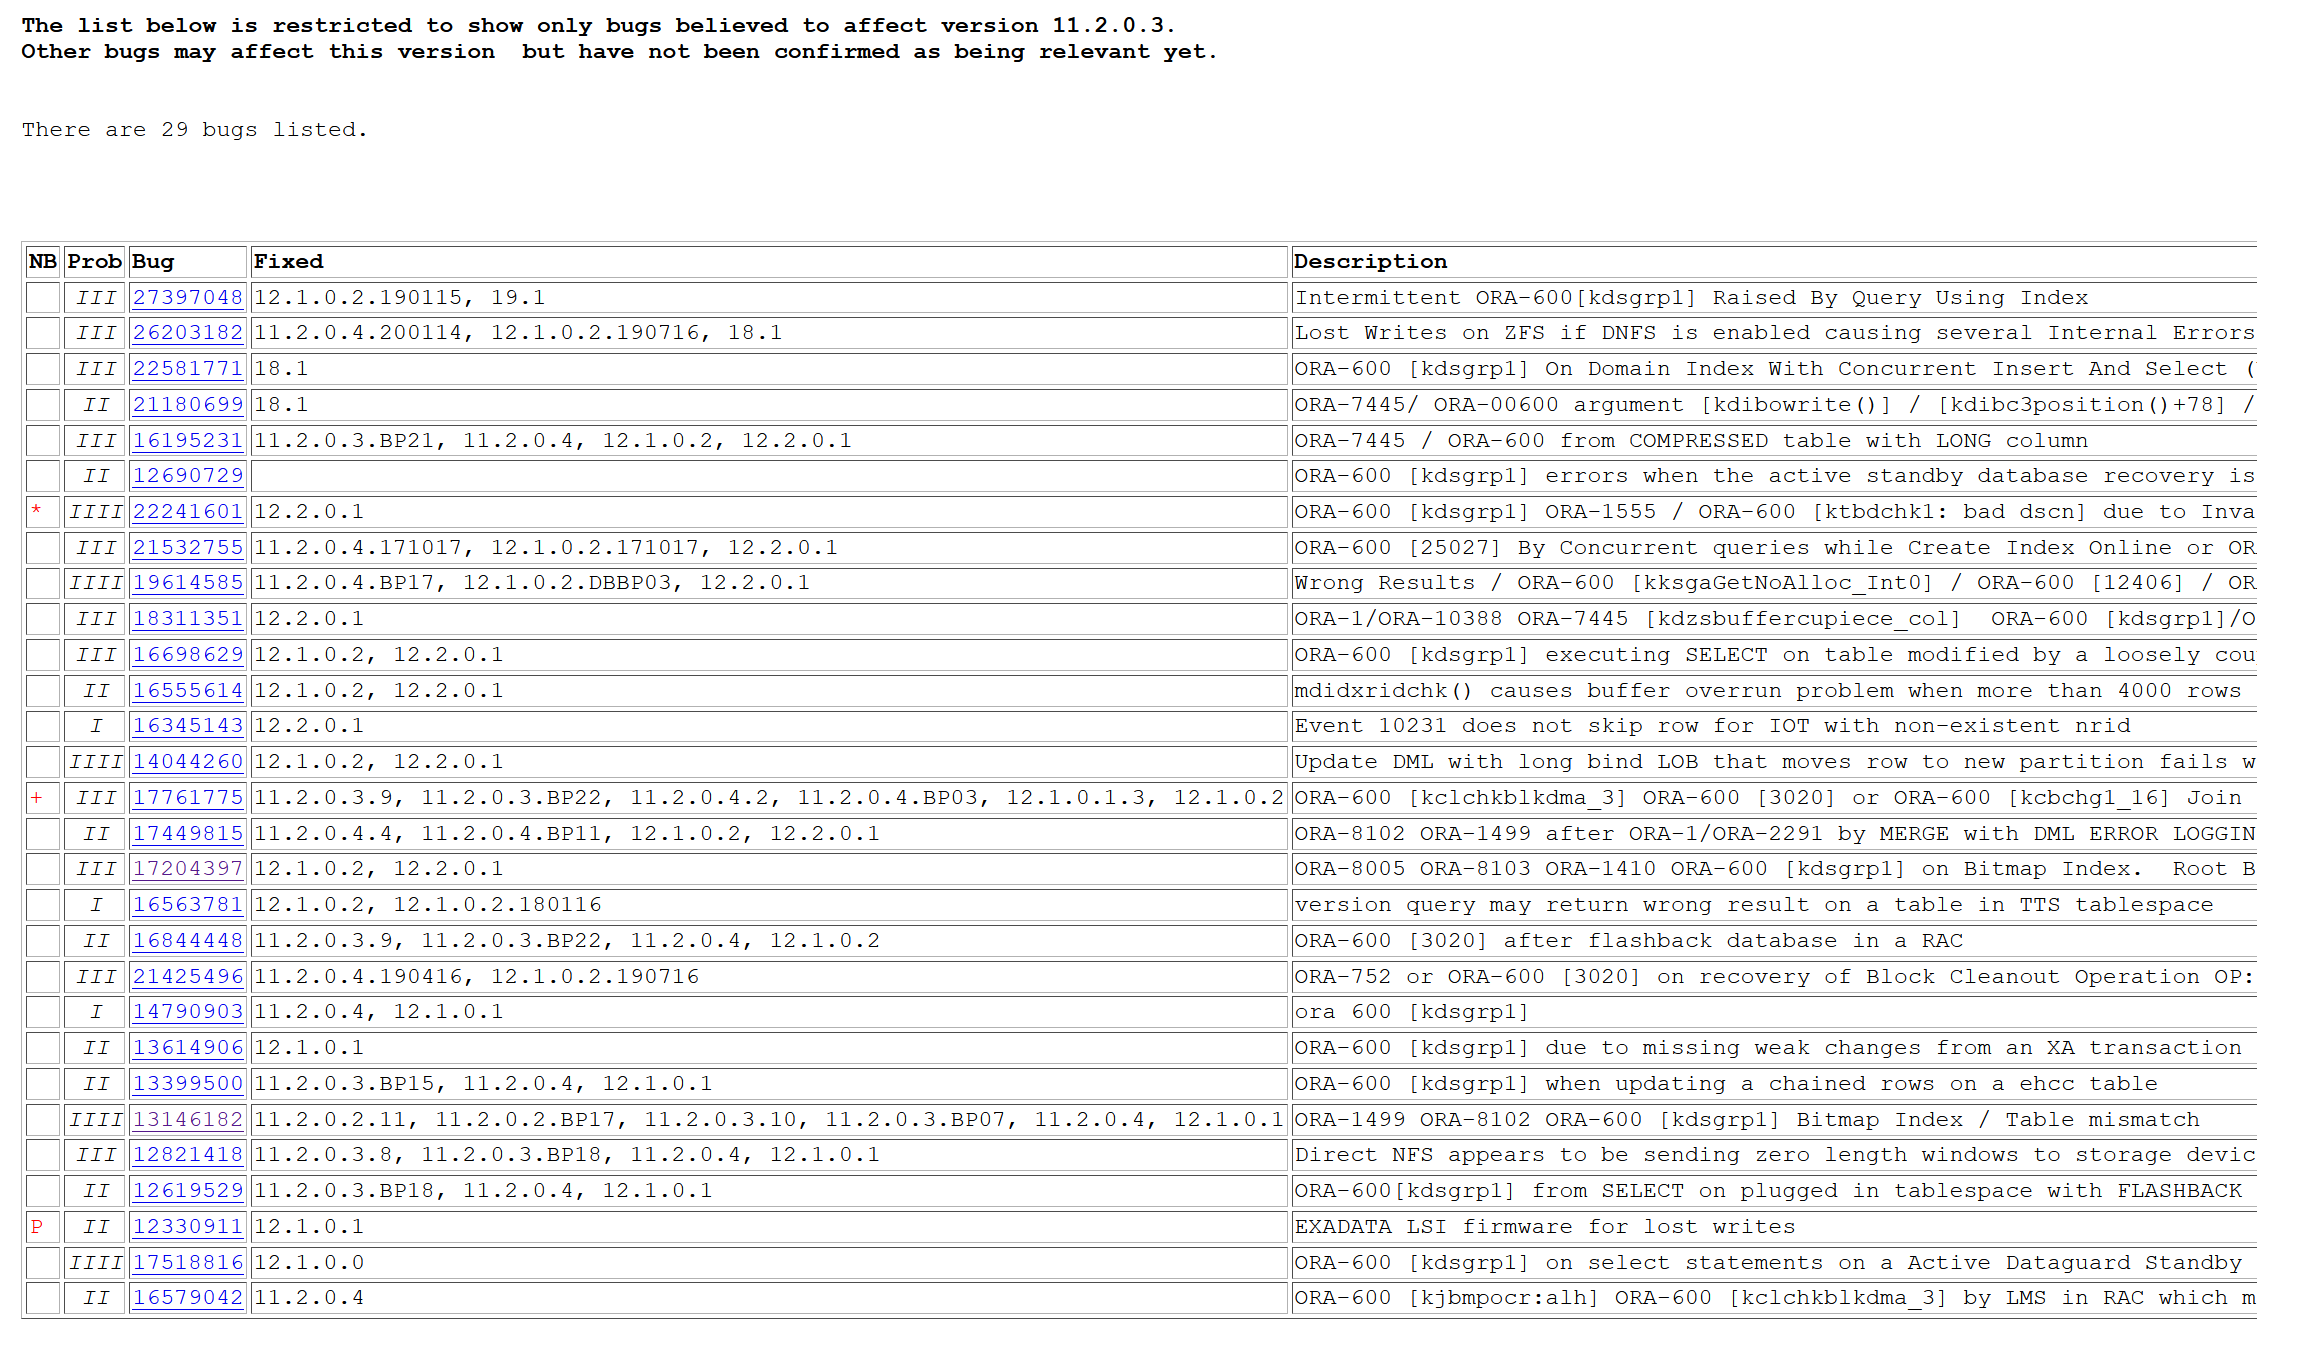
通过MOS文档ORA-600 [kdsgrp1] (Doc ID 285586.1),该版本有29个BUG,主要涉及到索引或者数据坏块、一致性读之类的问题。
同时在trace文件中,我们也能看到file# 21 block# 1126926的数据访问错误
* kdsgrp1-1: *************************************************
            row 0x0551320e.0 continuation at
            0x0551320e.0 file# 21 block# 1126926 slot 0 not found
KDSTABN_GET: 0 ..... ntab: 1
curSlot: 0 ..... nrows: 15
kdsgrp - dump CR block dba=0x0551320e
Block header dump:  0x0551320e
 Object id on Block? Y
 seg/obj: 0x12935  csc: 0xc61.f2e05d51  itc: 2  flg: E  typ: 1 - DATA
     brn: 0  bdba: 0x5511a06 ver: 0x01 opc: 0
     inc: 0  exflg: 0

 Itl           Xid                  Uba         Flag  Lck        Scn/Fsc
0x01   0x001c.004.0000597b  0x00f5cb9a.0605.05  --U-    1  fsc 0x01ae.f2e12ac9
0x02   0x0006.006.000c7f83  0x0adfad5d.ad41.03  --U-    1  fsc 0x01a9.f2ec8739
通过执行计划查看SQL的访问路径,走了两个bitmap索引,上面的BUG中也有几个是关于bitmap的
SQL_ID  0x8bxd0727n8s, child number 0
-------------------------------------
select * from (    select * from (     select * from
TBL_LS_STANDARD_EVENT_BI where OPT_TIME >= TO_DATE(:1, 'yyyymmdd')-1
and OPT_TIME <= TO_DATE(:2, 'yyyymmdd') and STANDARDED_FLAG = 0 and
FILTER_FLAG = 0    )b     where
to_number(to_char(OPT_TIME,'ss')) between 20 and 39               )c
where rownum <= :3

Plan hash value: 171791634

-----------------------------------------------------------------------------------------------------------
| Id  | Operation                      | Name                     | Rows  | Bytes | Cost (%CPU)| Time     |
-----------------------------------------------------------------------------------------------------------
|   0 | SELECT STATEMENT               |                          |       |       |   451 (100)|          |
|*  1 |  COUNT STOPKEY                 |                          |       |       |            |          |
|*  2 |   FILTER                       |                          |       |       |            |          |
|*  3 |    TABLE ACCESS BY INDEX ROWID | TBL_LS_STANDARD_EVENT_BI |     1 | 30840 |   451   (0)| 00:00:06 |
|   4 |     BITMAP CONVERSION TO ROWIDS|                          |       |       |            |          |
|   5 |      BITMAP AND                |                          |       |       |            |          |
|*  6 |       BITMAP INDEX SINGLE VALUE| IND_BI_STD_FLAG          |       |       |            |          |
|*  7 |       BITMAP INDEX SINGLE VALUE| IND_BI_FLT_FLAG          |       |       |            |          |
-----------------------------------------------------------------------------------------------------------

Predicate Information (identified by operation id):
---------------------------------------------------

   1 - filter(ROWNUM<=:3)
   2 - filter(TO_DATE(:1,'yyyymmdd')-1<=TO_DATE(:2,'yyyymmdd'))
   3 - filter((TO_NUMBER(TO_CHAR(INTERNAL_FUNCTION("TBL_LS_STANDARD_EVENT_BI"."OPT_TIME"),'ss'))>=2
              0 AND TO_NUMBER(TO_CHAR(INTERNAL_FUNCTION("TBL_LS_STANDARD_EVENT_BI"."OPT_TIME"),'ss'))<=39 AND
              "OPT_TIME"<=TO_DATE(:2,'yyyymmdd') AND "OPT_TIME">=TO_DATE(:1,'yyyymmdd')-1))
   6 - access("STANDARDED_FLAG"=0)
   7 - access("FILTER_FLAG"=0)

Note
-----
   - dynamic sampling used for this statement (level=2)
为了验证是不是索引和表的数据一致性问题,通过以下几种方式统计记录数,发现通过主键和全表扫查出的结果是一致的,而通过bitmap访问记录数会多,感觉bitmap有问题的可能性较大。
SQL> select /*+ index(t IND_BI_STD_FLAG) */ count(*) from LINKAGE.TBL_LS_STANDARD_EVENT_BI t;  --bitmap

  COUNT(*)
----------
    569061

SQL> select /*+ index(t IND_BI_FLT_FLAG) */ count(*) from LINKAGE.TBL_LS_STANDARD_EVENT_BI t;  --bitmap

  COUNT(*)
----------
    569061

SQL> select /*+ index(t PK_TBL_LS_STANDARD_EVENT_BI) */ count(*) from LINKAGE.TBL_LS_STANDARD_EVENT_BI t;   --主键

  COUNT(*)
----------
    548356

SQL> select /*+ full(t) */ count(*) from LINKAGE.TBL_LS_STANDARD_EVENT_BI t;

  COUNT(*)
----------
    548356
通过如下SQL,我们可以查到bitmap索引中比表中多出的2万条记录的rowid、文件号和块号,如下的21文件1126926号块,正是前面trace文件中报出的。
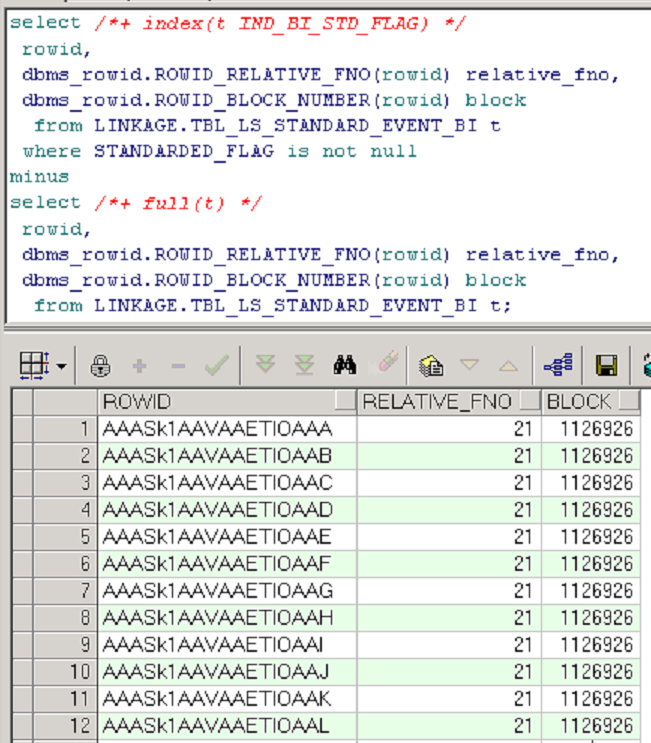
再进一步做一次确认,bitmap索引访问多出的2万多条记录,在表中查不到,那么可以肯定,问题出在两个bitmap上。
SQL> create table LINKAGE.t_missing_rows as select * from LINKAGE.TBL_LS_STANDARD_EVENT_BI where 1=2;

Table created.

SQL> declare
  2    cursor missing_rows is
  3      select /*+ index(t IND_BI_STD_FLAG) */
  4       rowid rid
  5        from LINKAGE.TBL_LS_STANDARD_EVENT_BI t
  6       where STANDARDED_FLAG is not null
  7      minus
  8      select /*+ full(t) */
  9       rowid rid
 10        from LINKAGE.TBL_LS_STANDARD_EVENT_BI t;
 11  begin
 12    for i in missing_rows loop
 13      insert into LINKAGE.t_missing_rows
 14        select /*+ ROWID(t) */
 15         *
 16          from LINKAGE.TBL_LS_STANDARD_EVENT_BI t
 17         where rowid = i.rid;
 18    end loop;
 19    commit;
 20  end;
 21  /

PL/SQL procedure successfully completed.

SQL> commit;

Commit complete.

SQL> select count(*) from LINKAGE.t_missing_rows;

  COUNT(*)
----------
         0
至此,针对这个问题,我们可以安心的重建索引解决。
问题处理
online重建两个bitmap,经观察alert日志中没有再报错。
最后修改时间:2020-09-15 15:43:21
【版权声明】本文为墨天轮用户原创内容,转载时必须标注文章的来源(墨天轮),文章链接,文章作者等基本信息,否则作者和墨天轮有权追究责任。如果您发现墨天轮中有涉嫌抄袭或者侵权的内容,欢迎发送邮件至:contact@modb.pro进行举报,并提供相关证据,一经查实,墨天轮将立刻删除相关内容。
