数据丢失快速恢复
数据丢失快速恢复的重要性
数据丢失快速恢复目的:尽快修复数据,恢复业务。
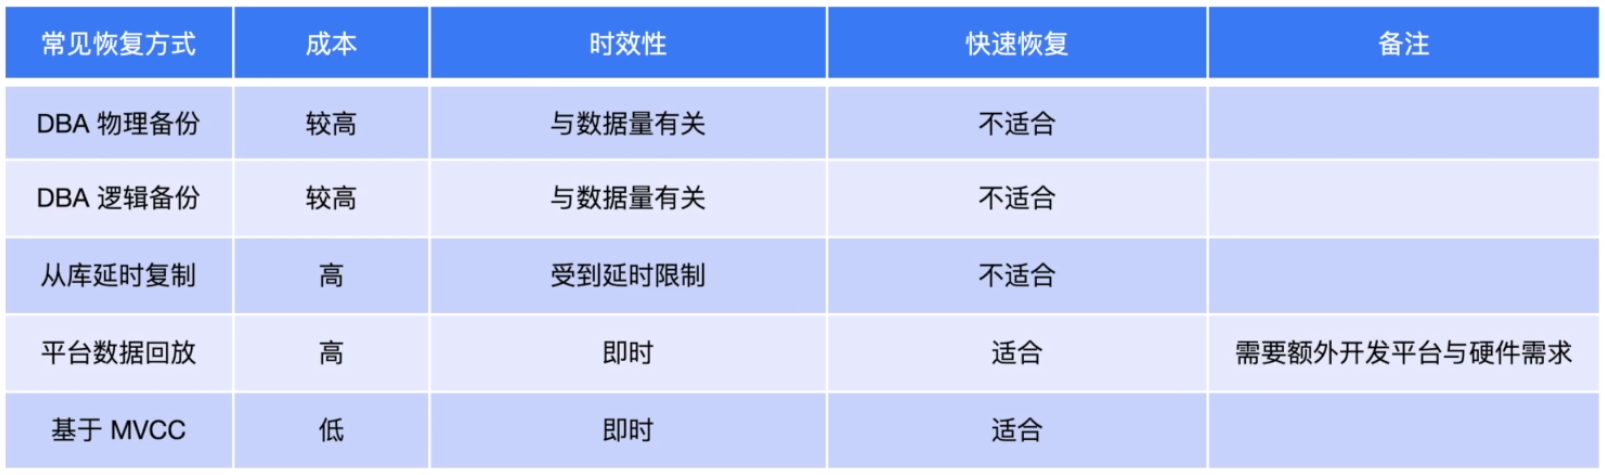
TiDB 快速恢复与其他恢复技术对比
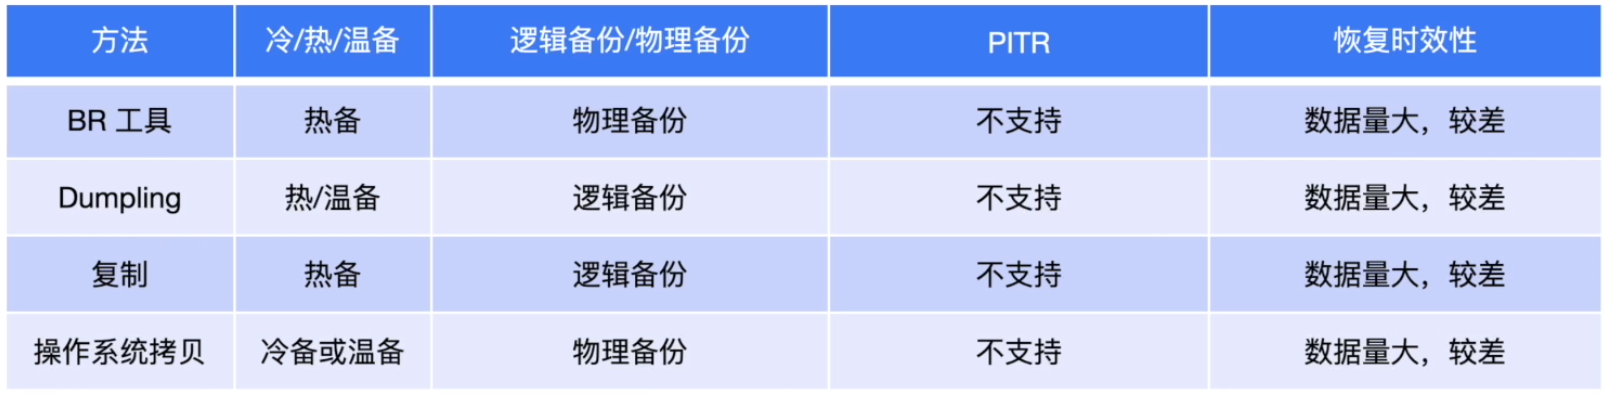
TiDB常用备份恢复技术
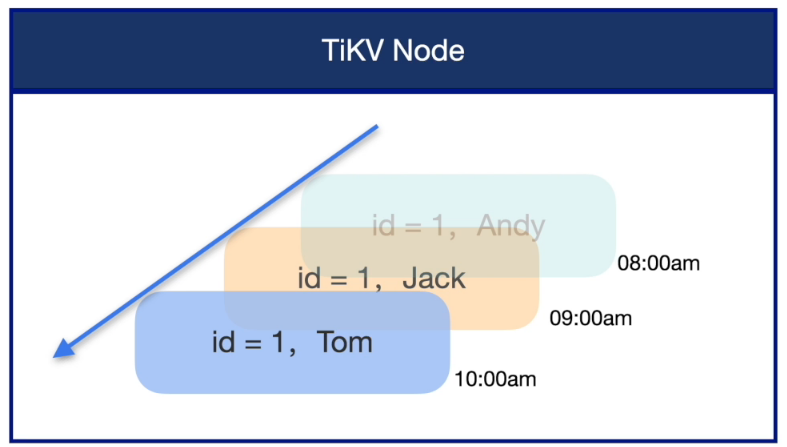
TiDB 数据快速恢复原理
MVCC 是 TiDB 数据库原生的一项功能,默认使用无需配置,他使用多个历史快照的方式来维护数据在某个时间点对并发访问的一致性。
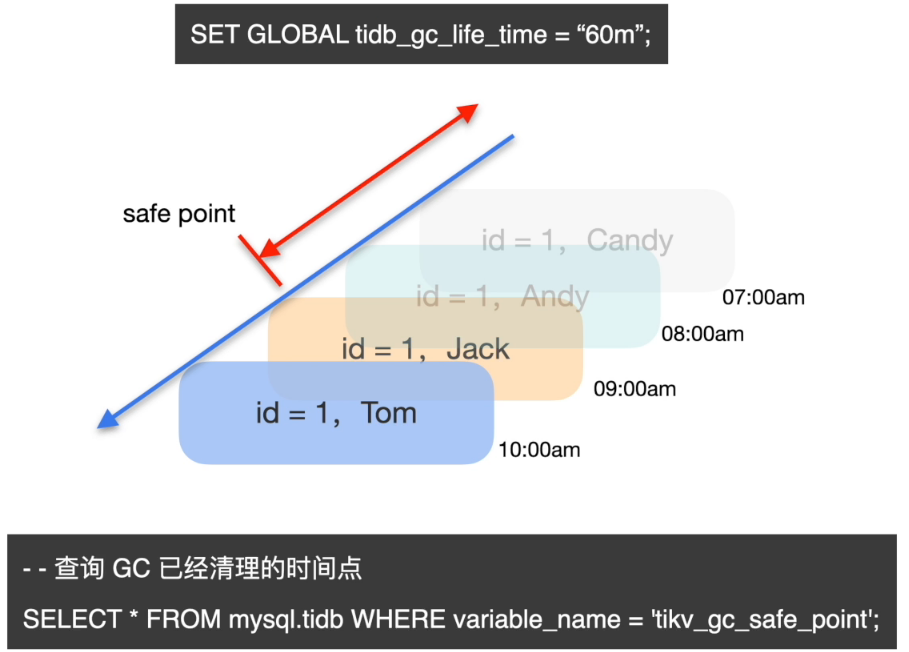
数据恢复前置条件 - GC
数据快速恢复操作方式
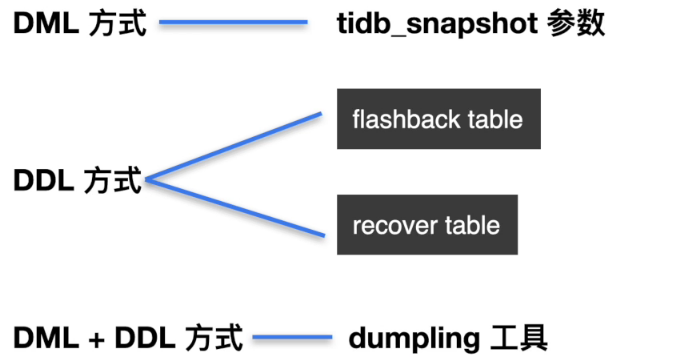
设置 tidb_snapshot 参数来读取历史数据
步骤一: 查看历史数据
set @@tidb_snapshot="2020-10-08 16:45:26";
Query OK, 0 rows affected (0.00 sec)
复制
步骤二: 对检索到的目标结果进行二次处理,应用到目标业务表
FLASHBACK TABLE
-- 1. 查询 DDL 操作时间戳
admin show ddl jobs;

-- 2. 设置 tidb_snapshot
set @@tidb_snapshot="yyy-mm-dd hh:mi:ss";

-- 3. 执行 Flashback 命令恢复数据 (适用于 Drop 与 Truncate)
FLASHBACK TABLE target_table_name [TO new_table_name]
复制
RECOVER TABLE
-- 适用于Drop操作
RECOVER TABLE table_name;
复制
dumpling --snapshot
-- 1. 确认目标数据恢复的时间戳
-- 2. dumpling 备份目标数据历史记录
dumpling -h 172.xx.xx.xx -P 4000 -uroot -p xxx -t 32 -F 64MiB -B target_db --snapshot "yyyy-mm-dd hh:mi:ss" -o /tmp/dumpling_dir
-- 3. TiDB-Lighting 导入数据
复制
数据库热点问题诊断与处理
为什么要解决热点
分布式架构中各个组件的理想状态: 资源利用率相对均衡
形成写热点的原因
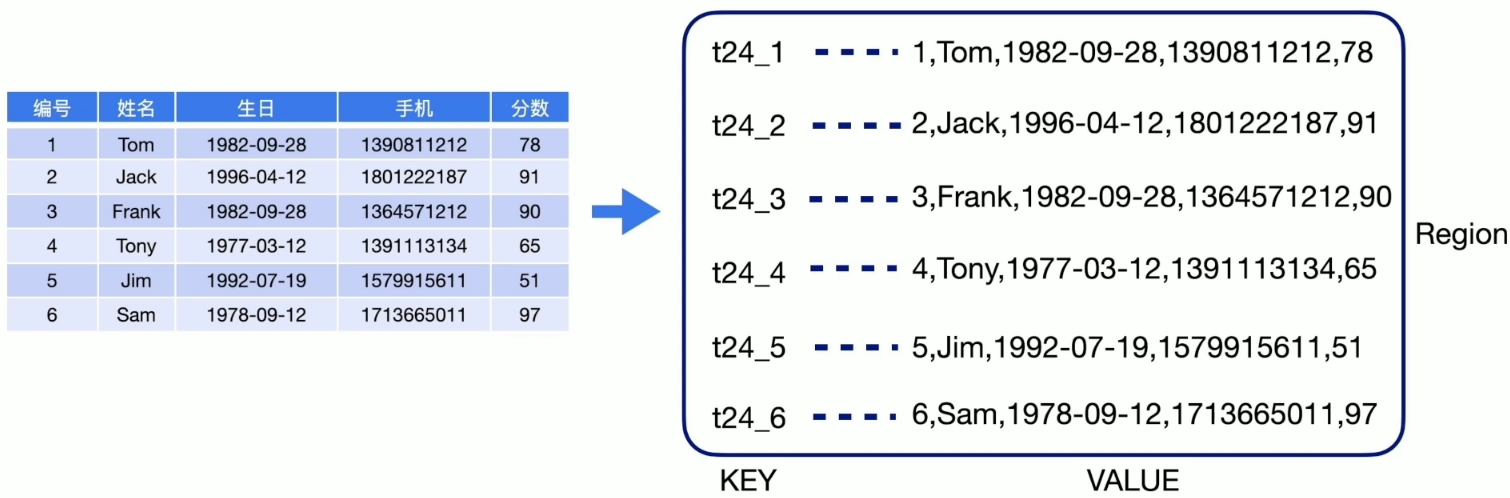
- 数据组织模型
形成读热点的原因
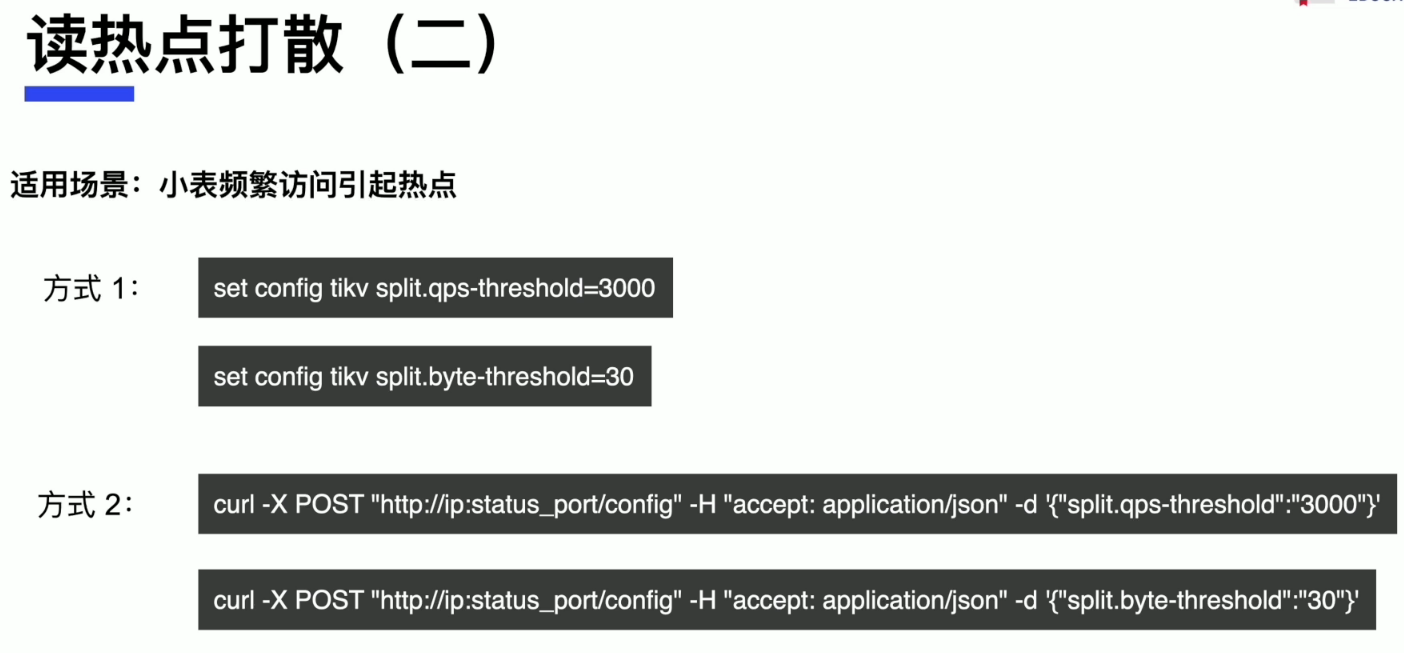
- 高频访问的小表
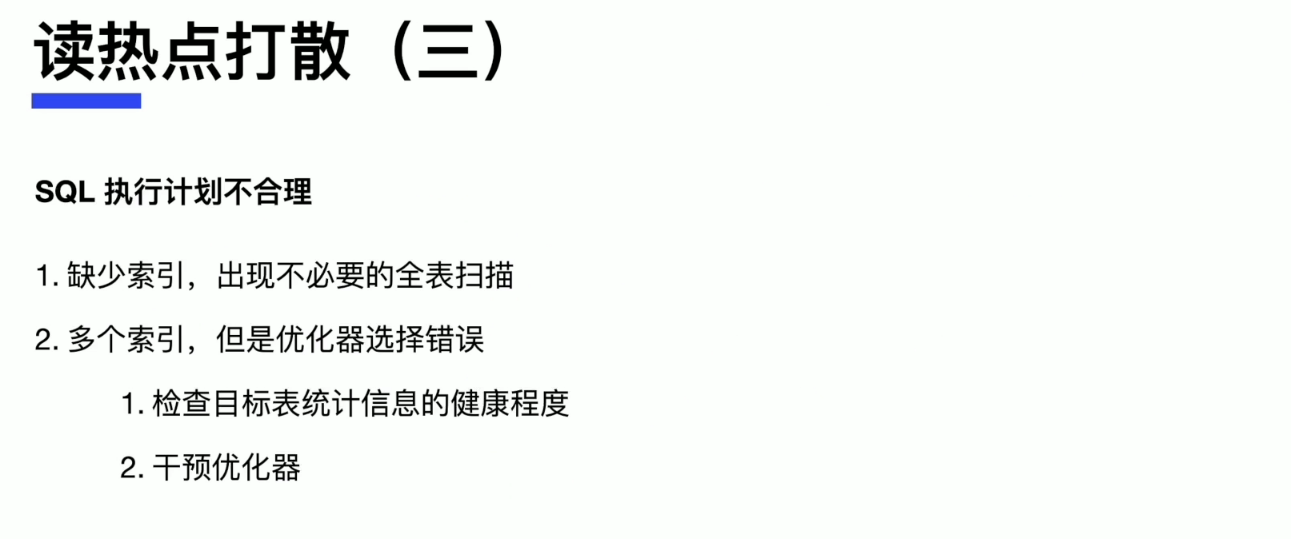
- SQL 执行计划不合理
- 具有顺序增长属性的索引扫描
定位热点
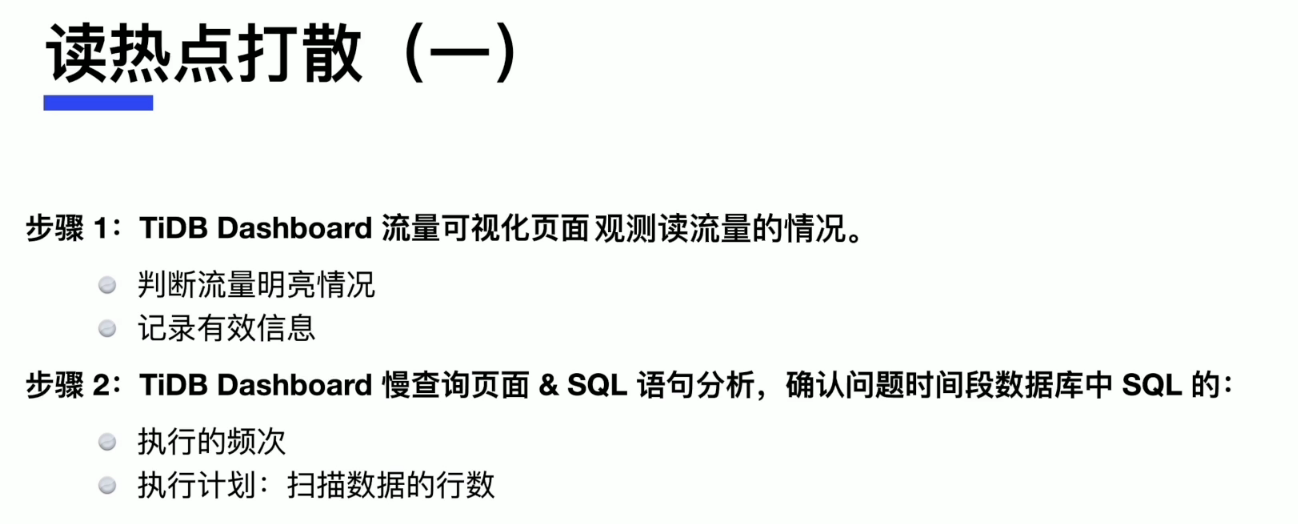
- TiDB Dashboard
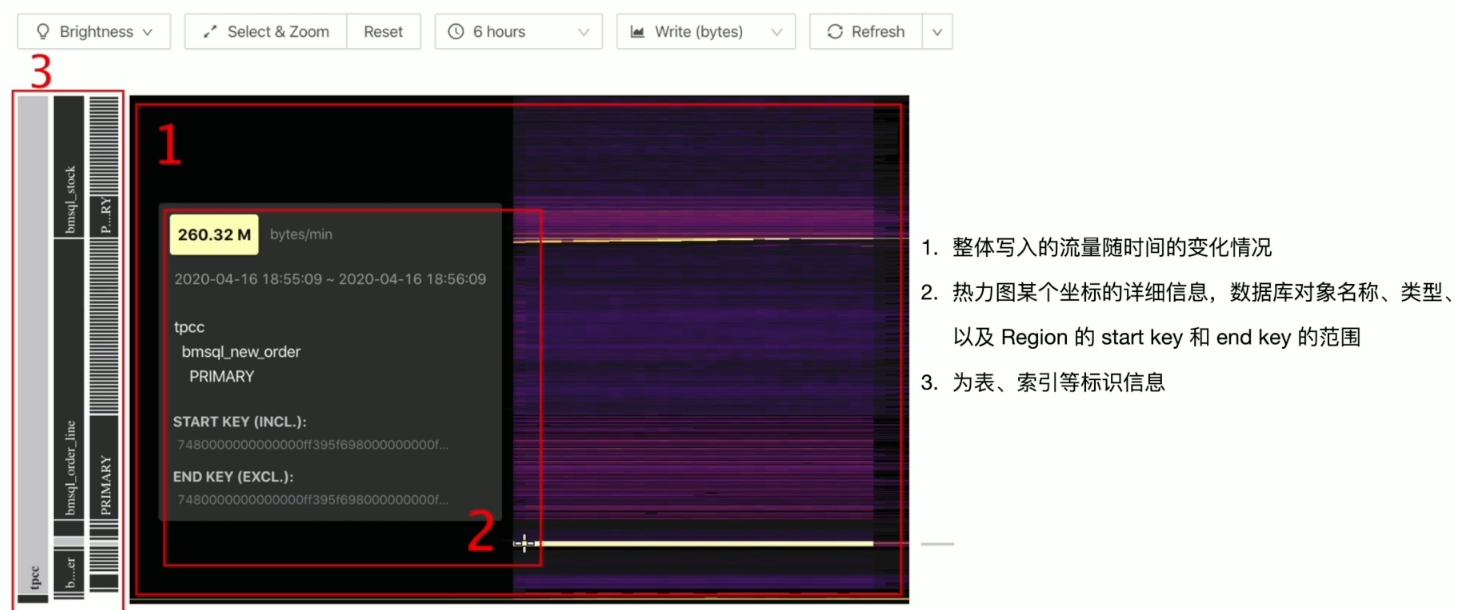
- 流量可视化页面
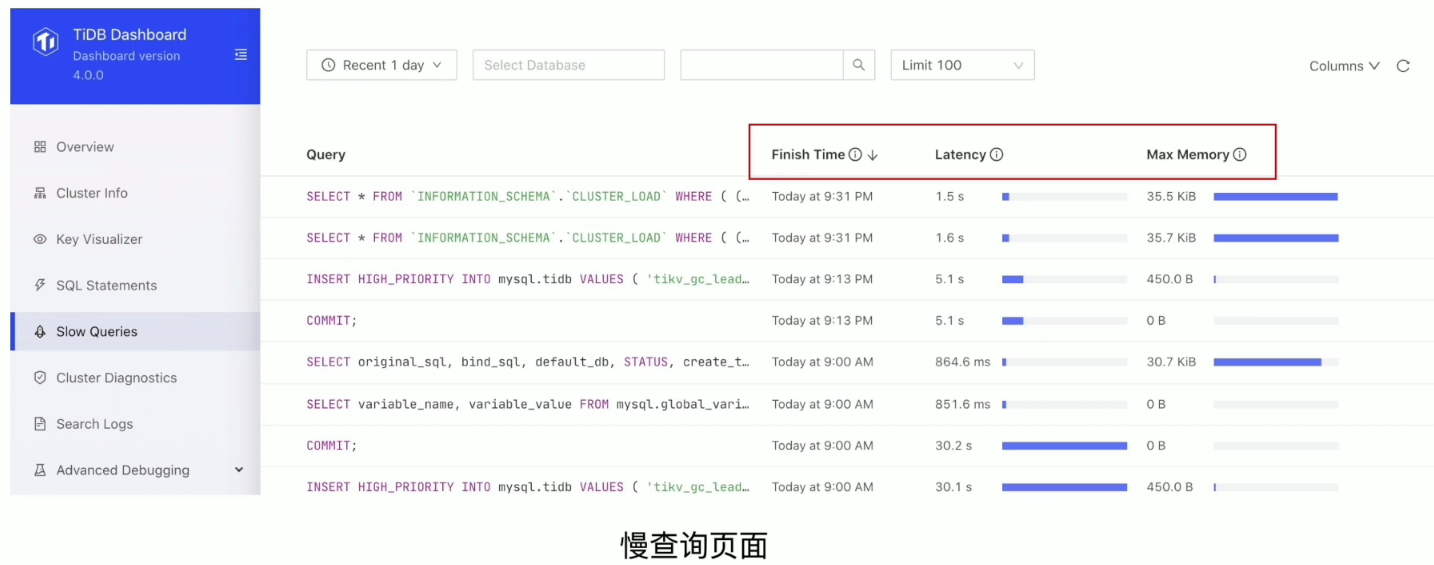
- 慢查询页面
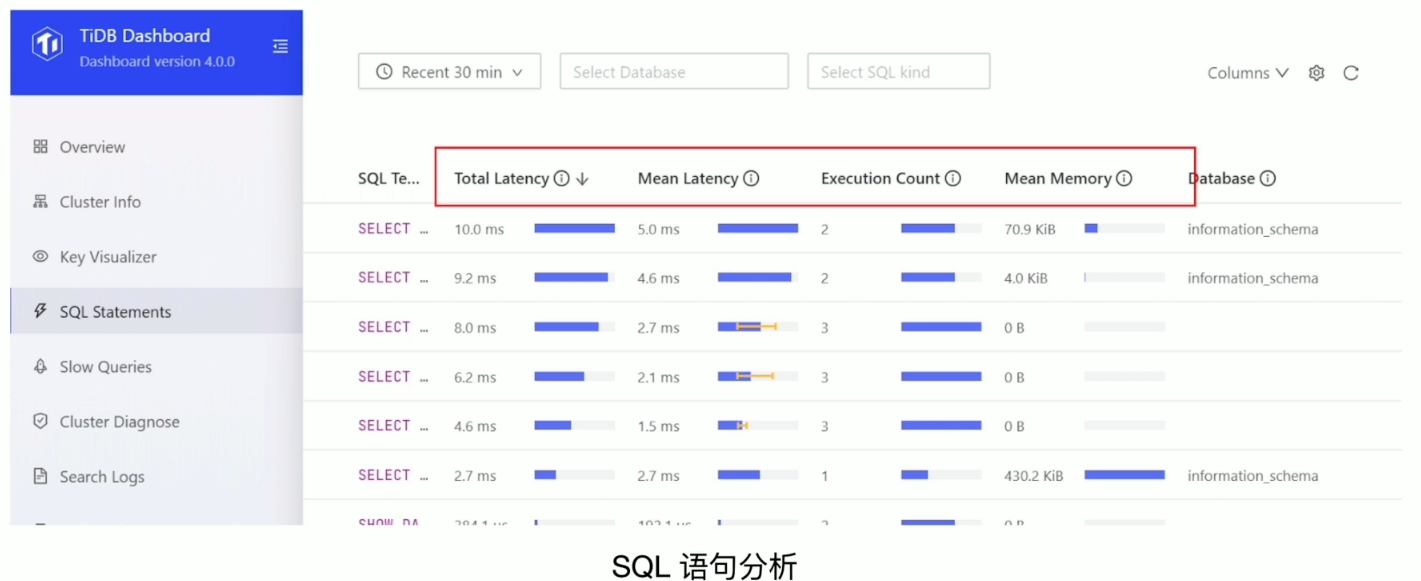
- SQL 语句分析
- Grafana 监控
- TiKV-Trouble-Shooting
- TiKV-Details
- PD
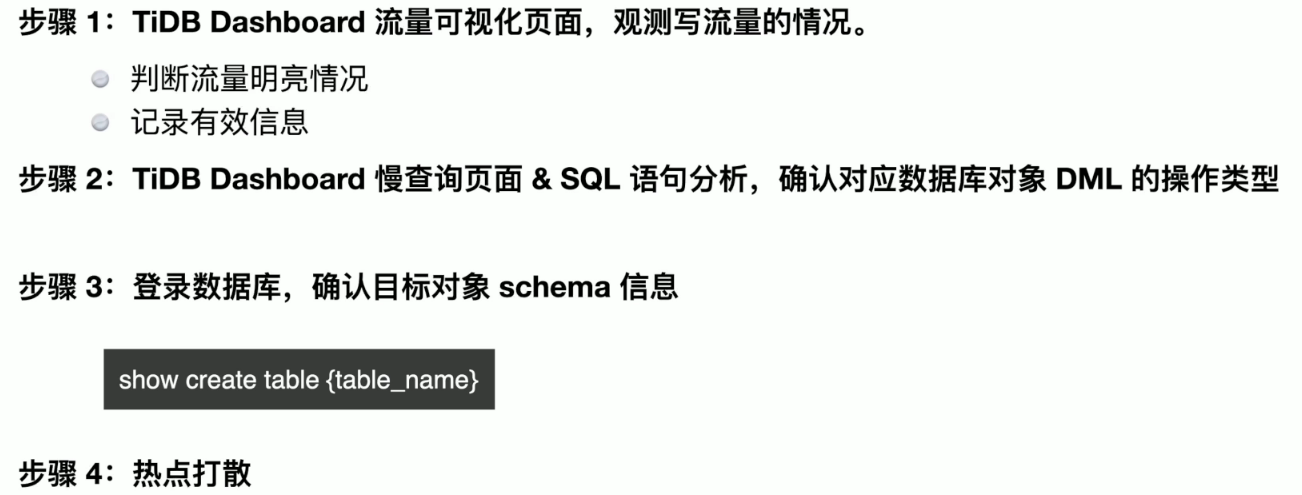
TiDB Dashboard 流量可视化
TiDB Dashboard SQL 语句执行情况
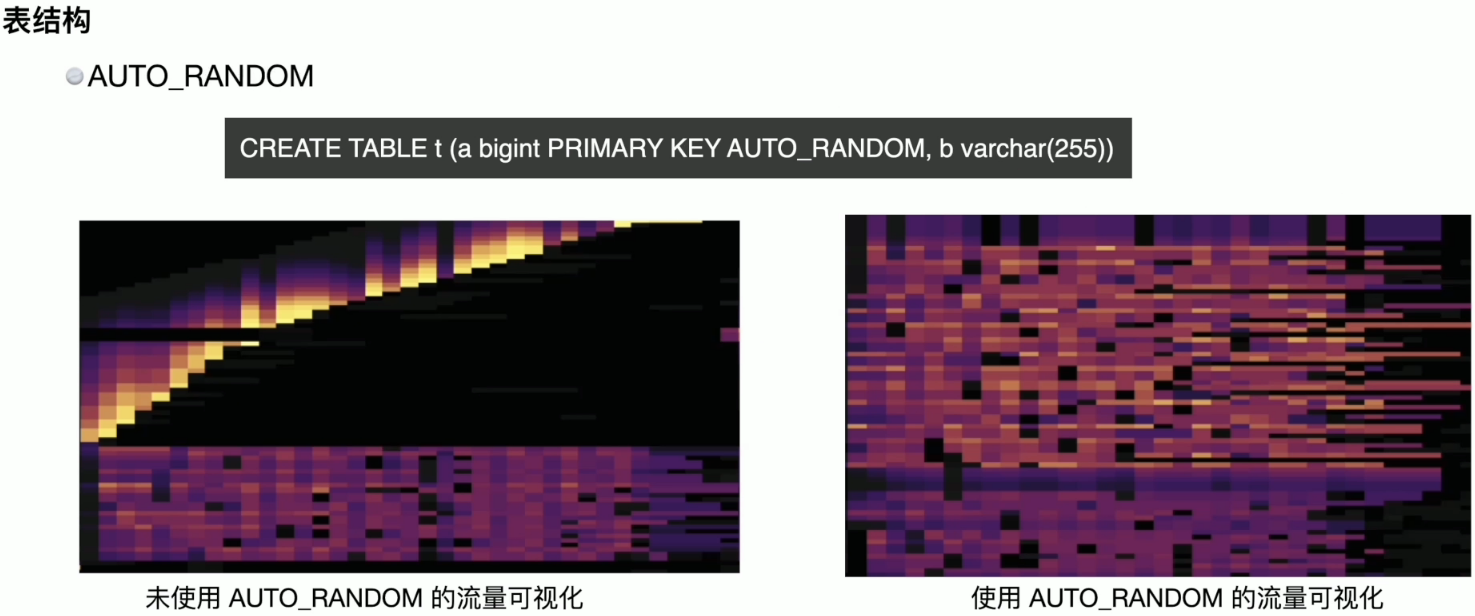
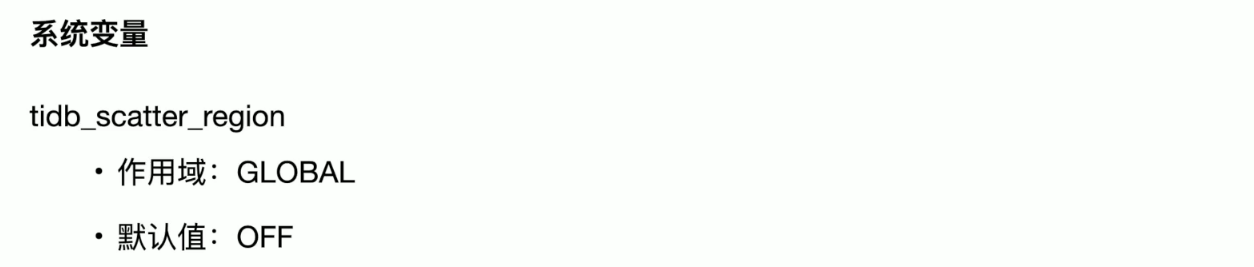
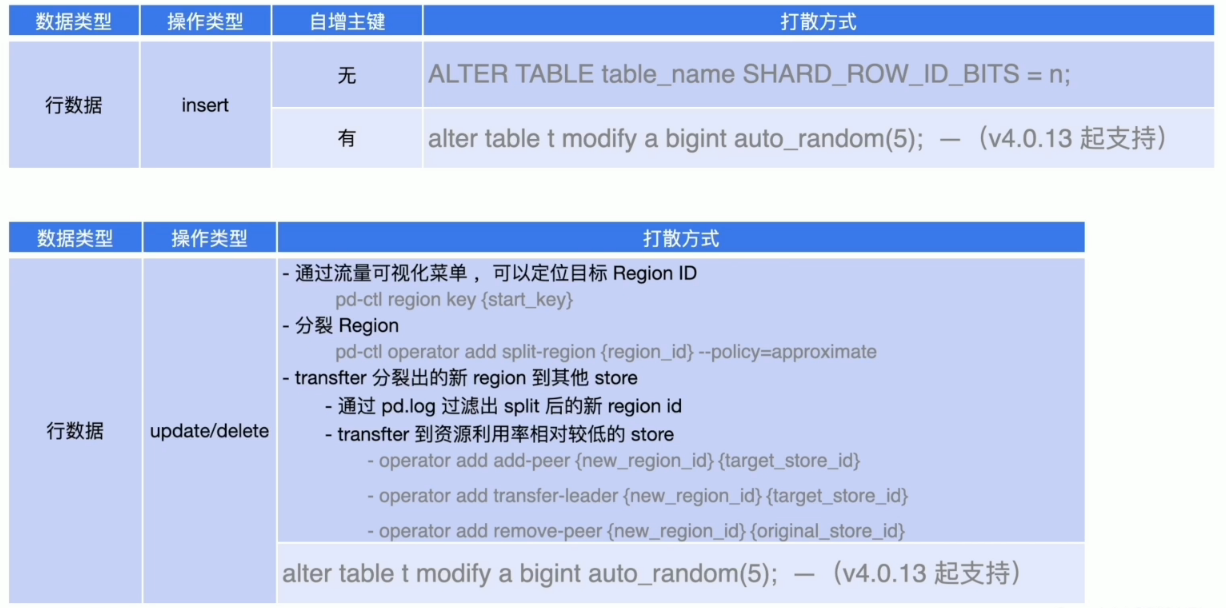
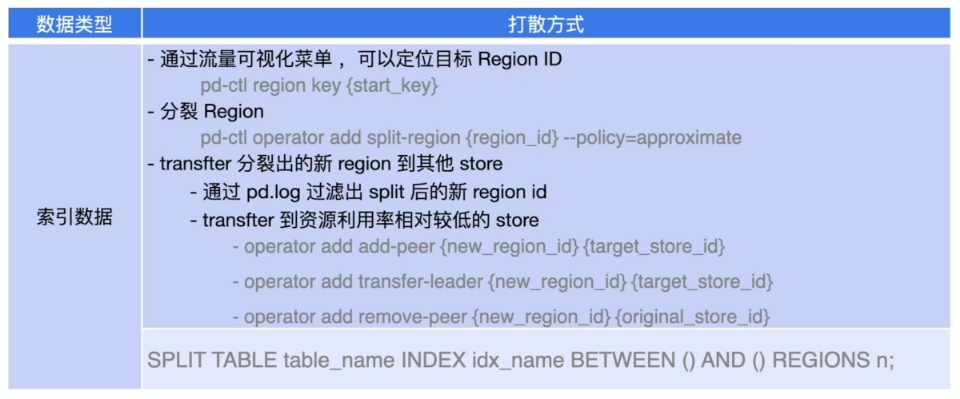
写热点打散
数据库对象


业务运行过程中的写热点打散
读热点打散

TiDB 数据库写入慢常见处理方式
数据库写入慢的现象
- TiDB Server、 TiKV、PD 三大基础组件
- Binlog、TiCDC 等周边生态组件
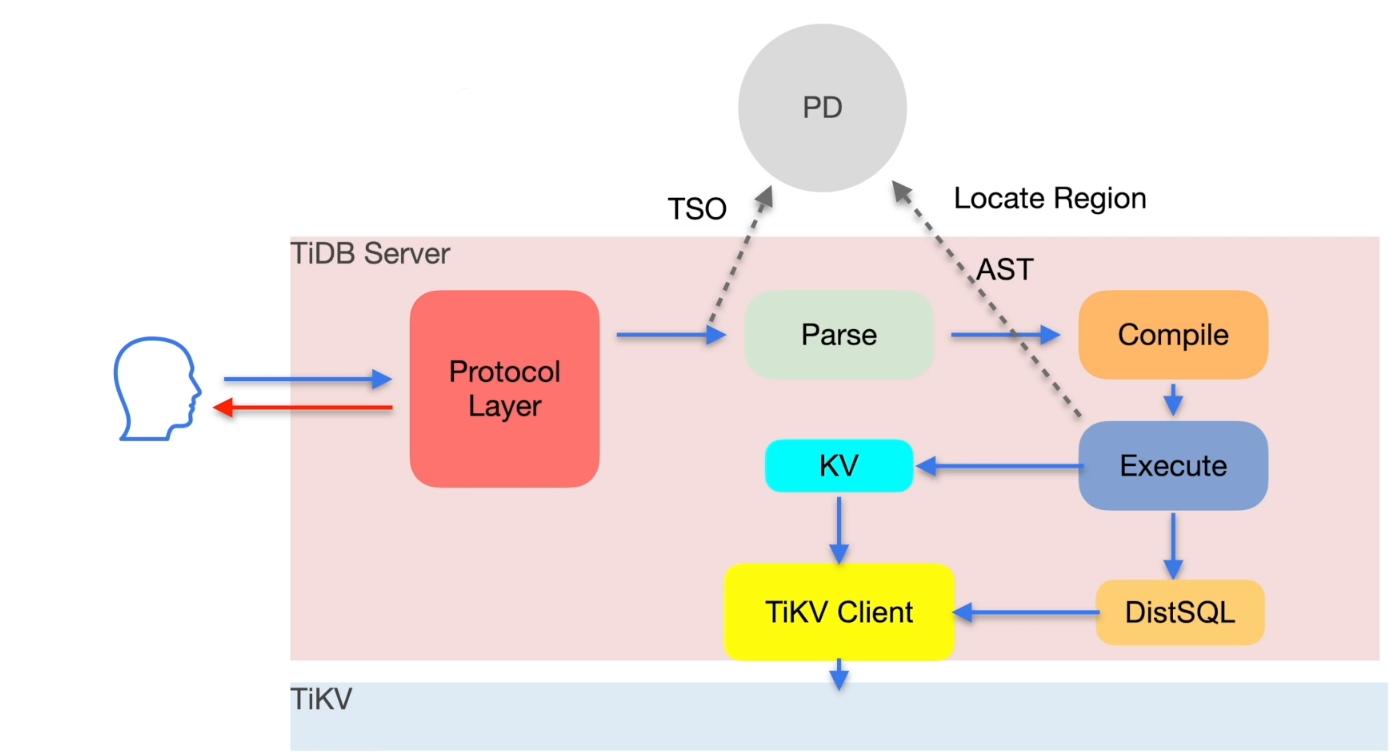
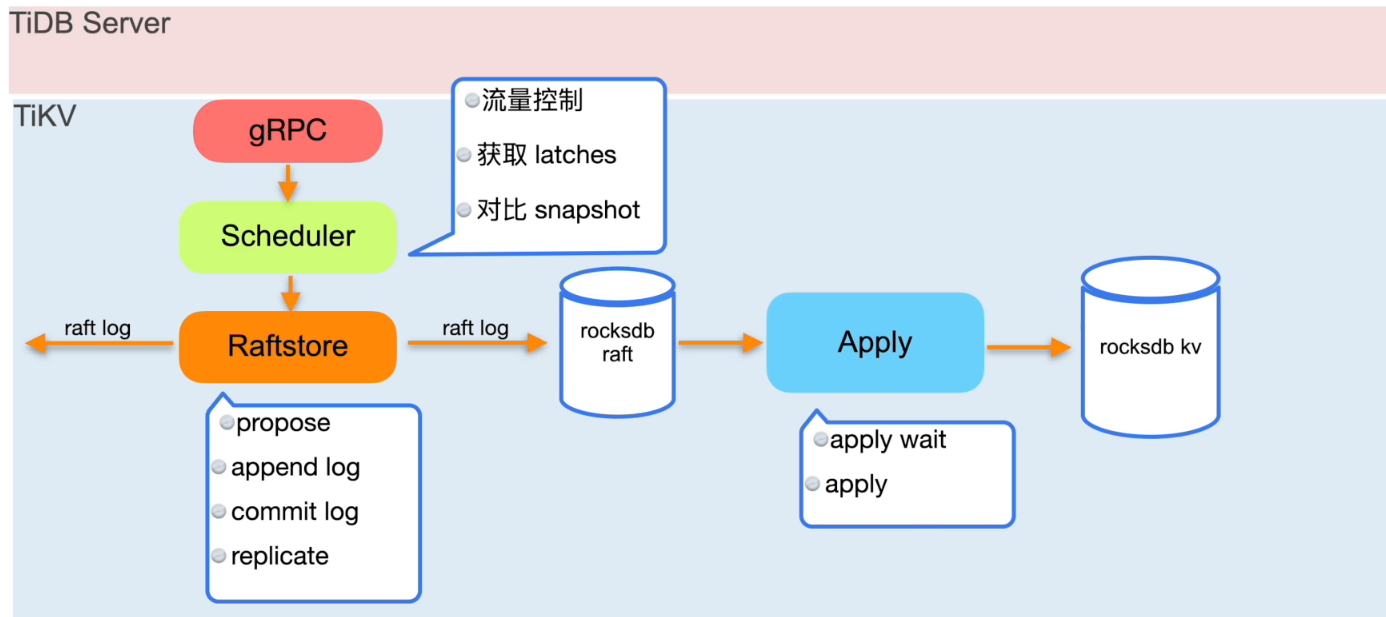
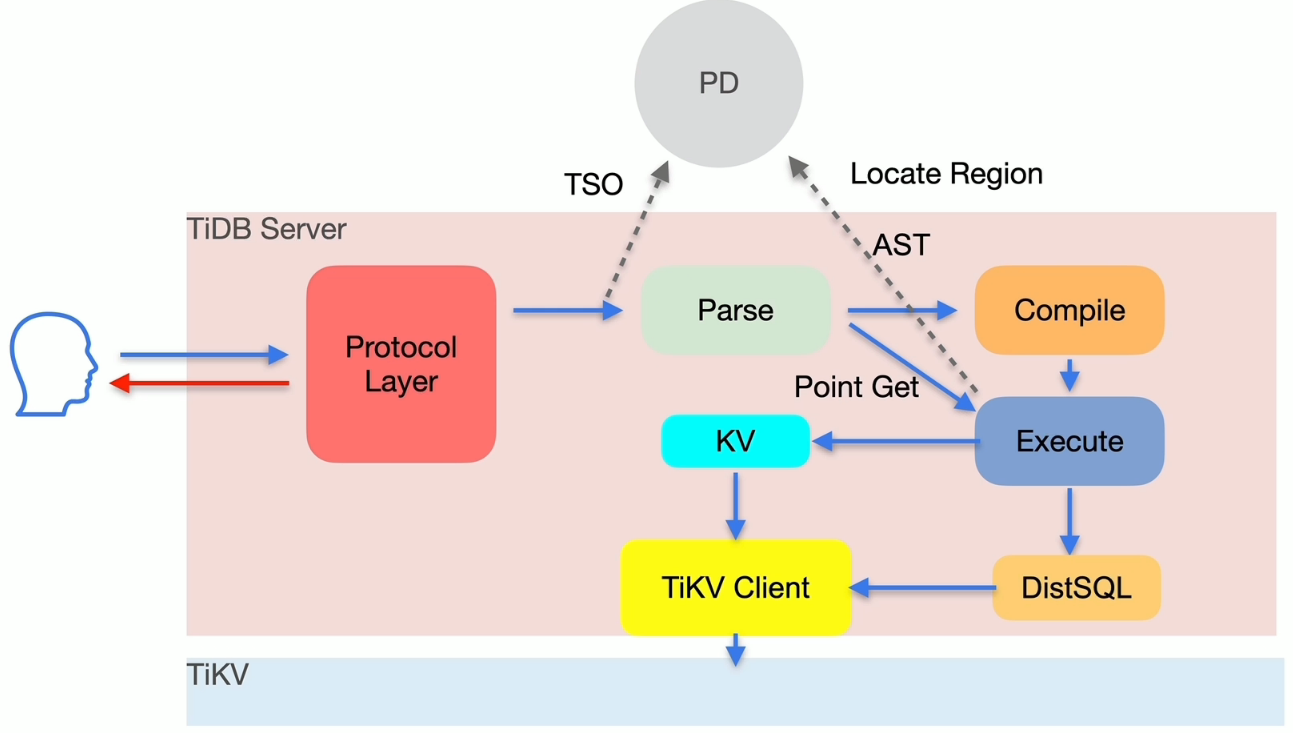
TiDB 写入流程简述
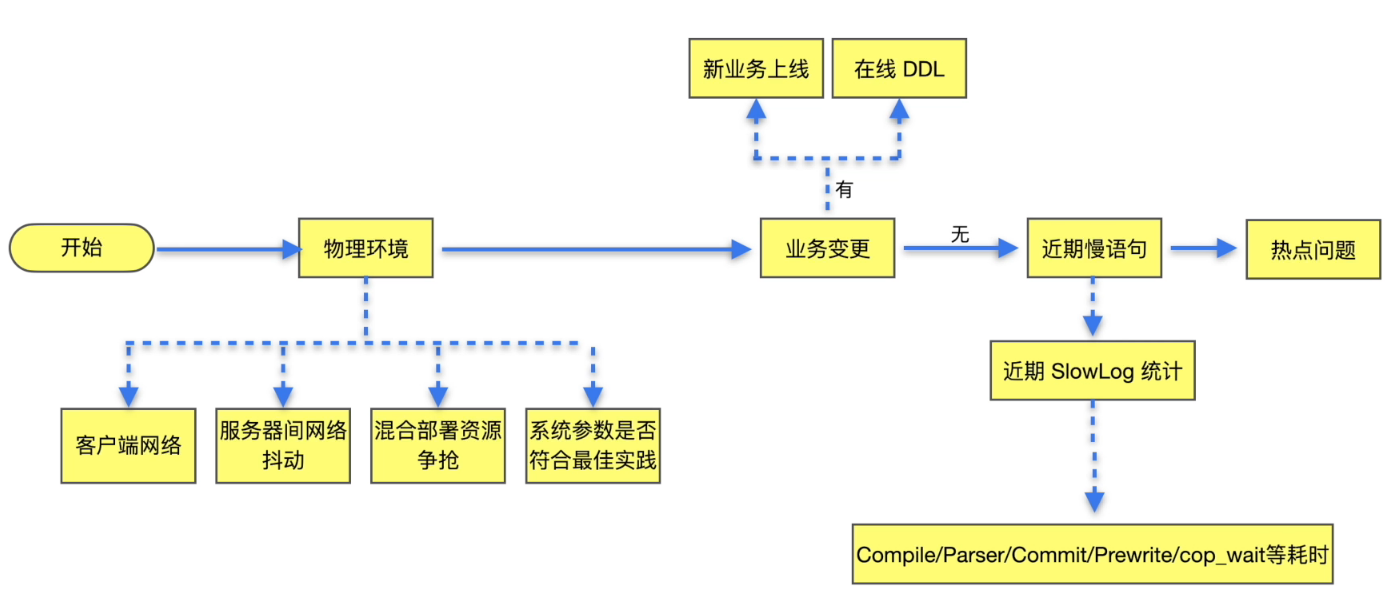
写入慢排查思路
通过现象确定排查方向:
- 典型问题
- 物理环境导致写入慢
- 业务变更
- 慢查询语句
- 写入热点问题
- 复杂问题
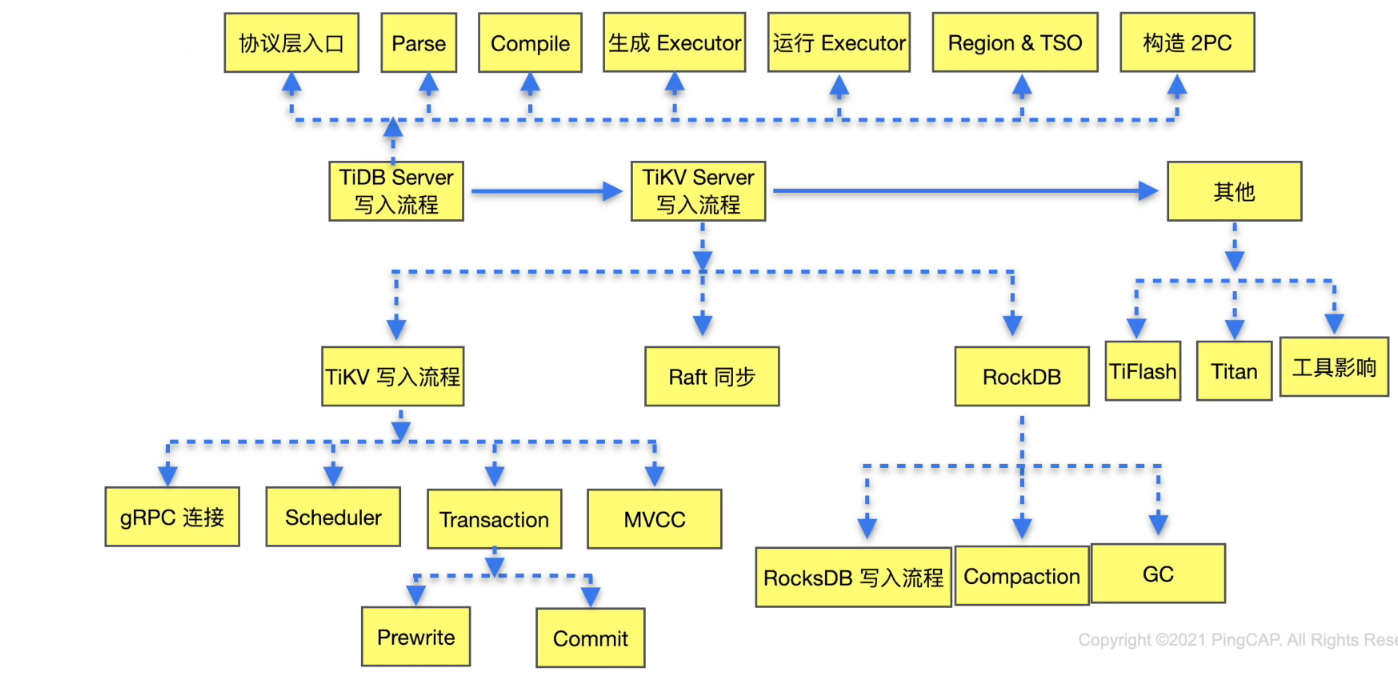
- 对照 TiDB 写入流程进行排查
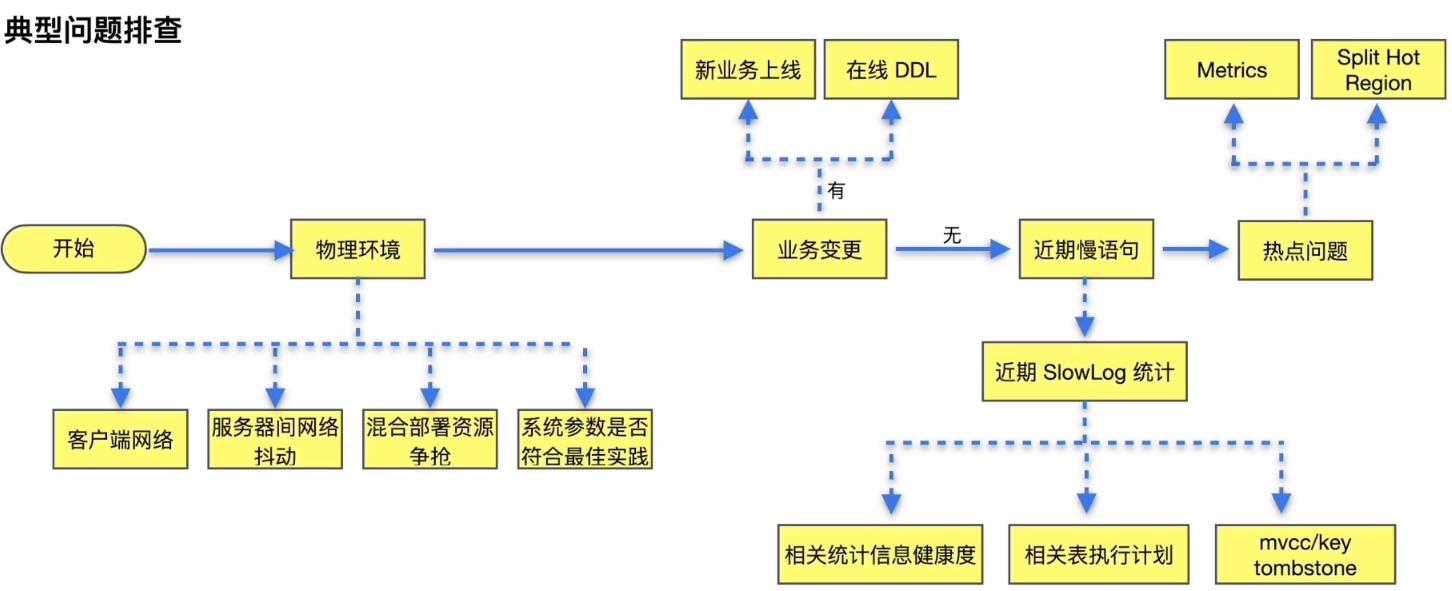
典型问题排查
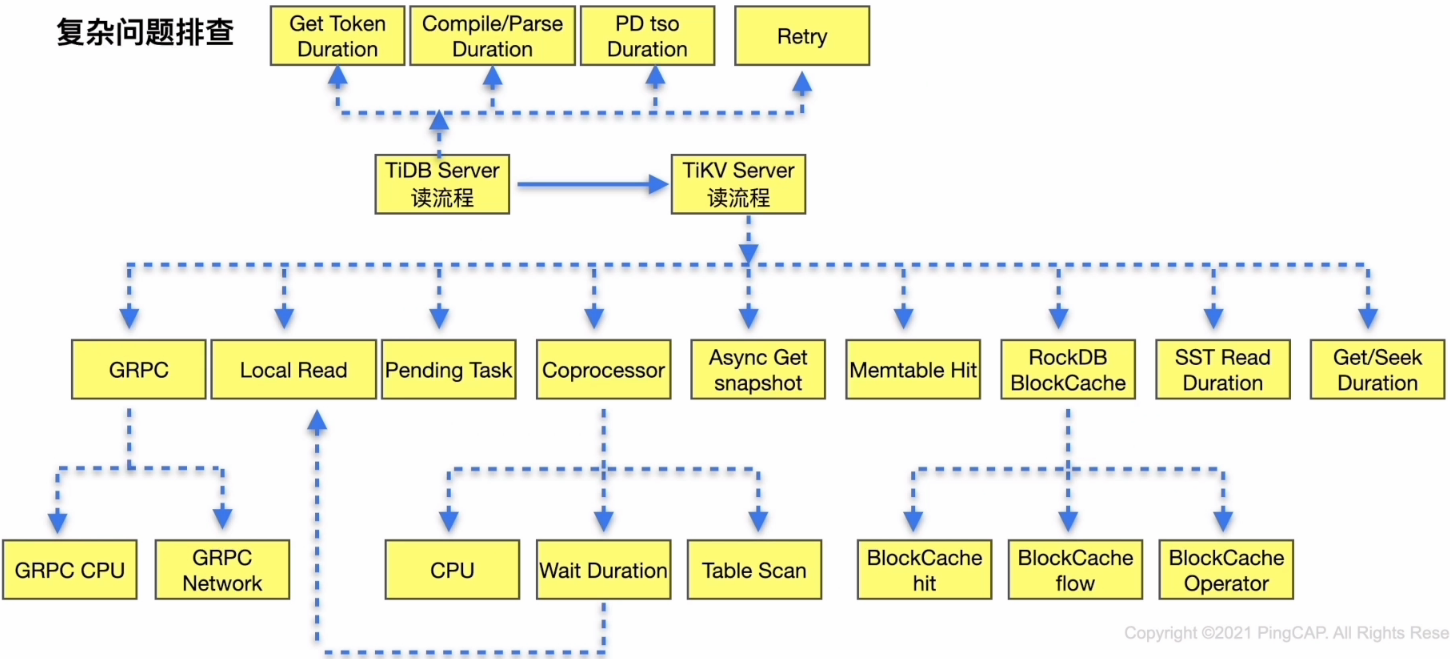
复杂问题排查
案例分析
背景介绍
业务场景描述
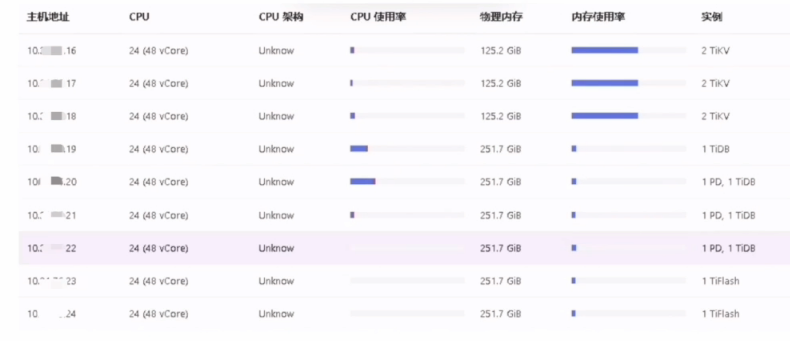
- 集群拓扑: TiDB Server 12个,TiKV 5个
- 问题时间: 10:00 am 之后
集群整体情况
- 业务变更
- 新业务上线: 否
- DDL操作: 否
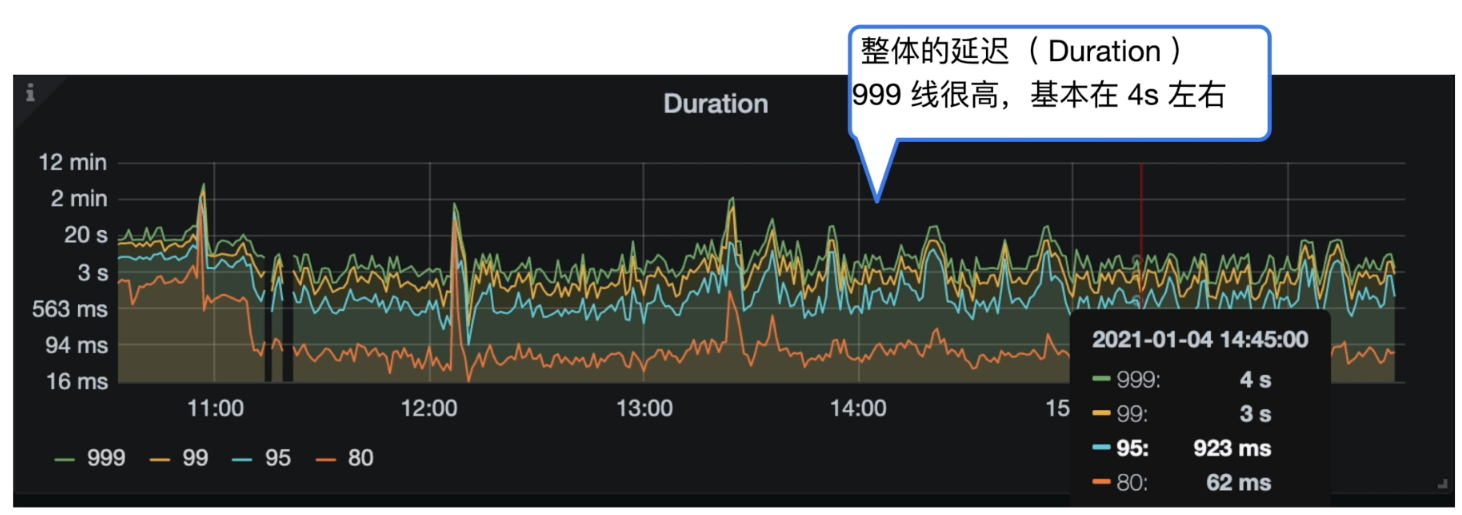
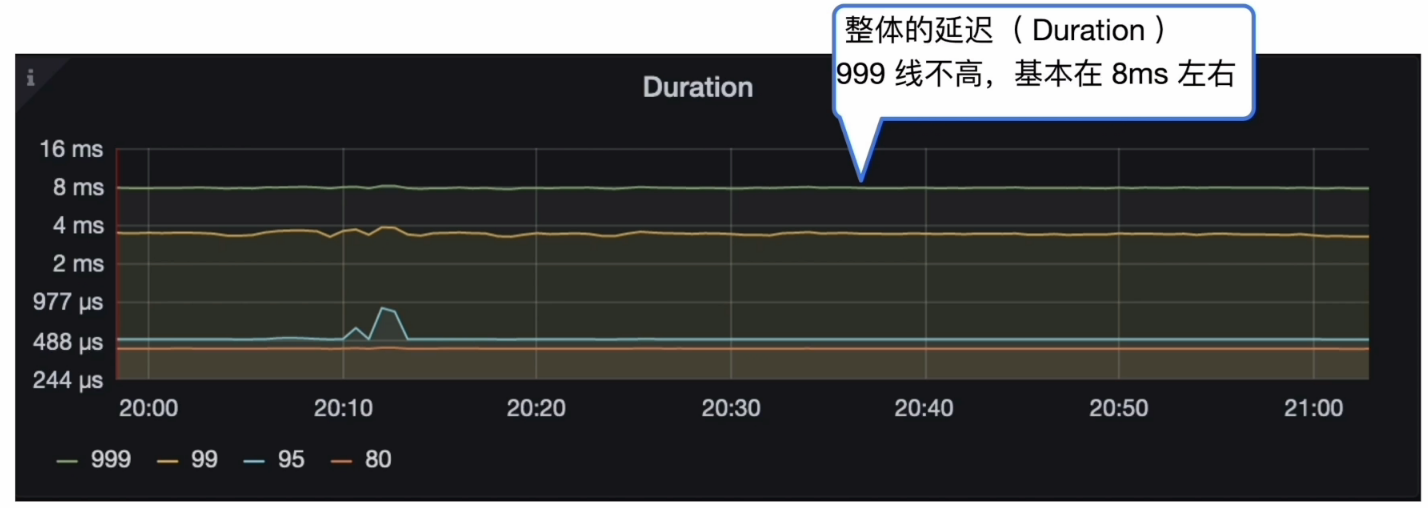
- 集群 Duration
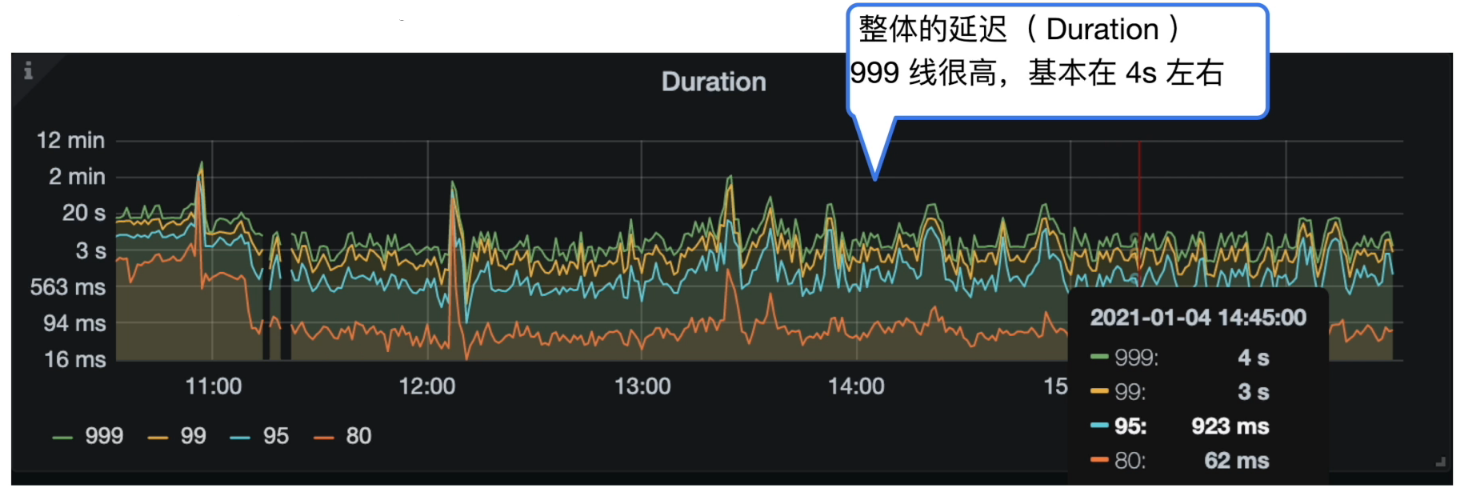
Grafana 监控 TiDB --> Query Summary --> Duration
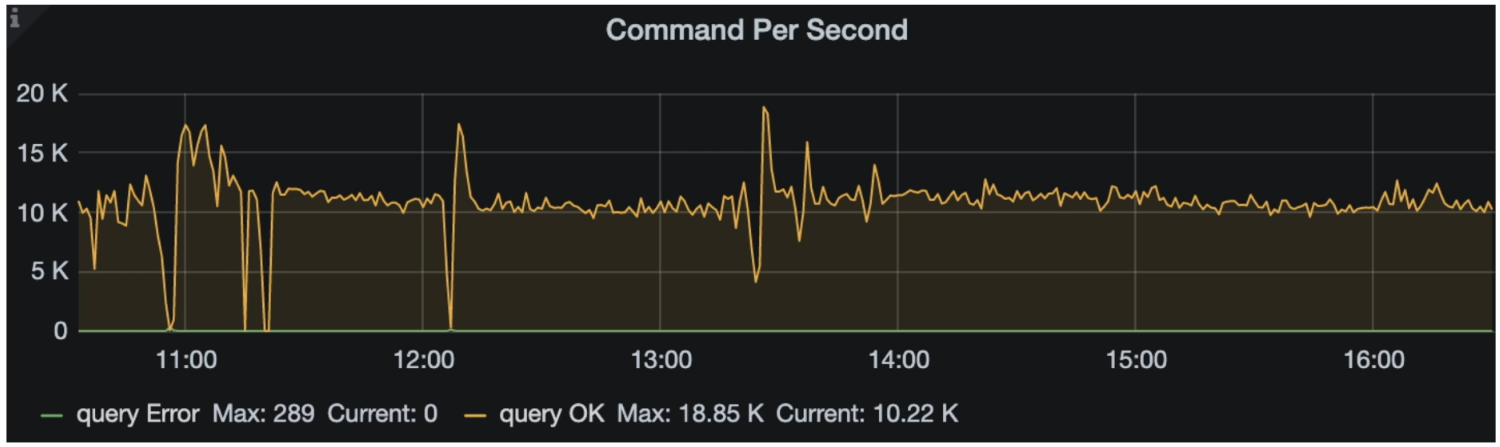
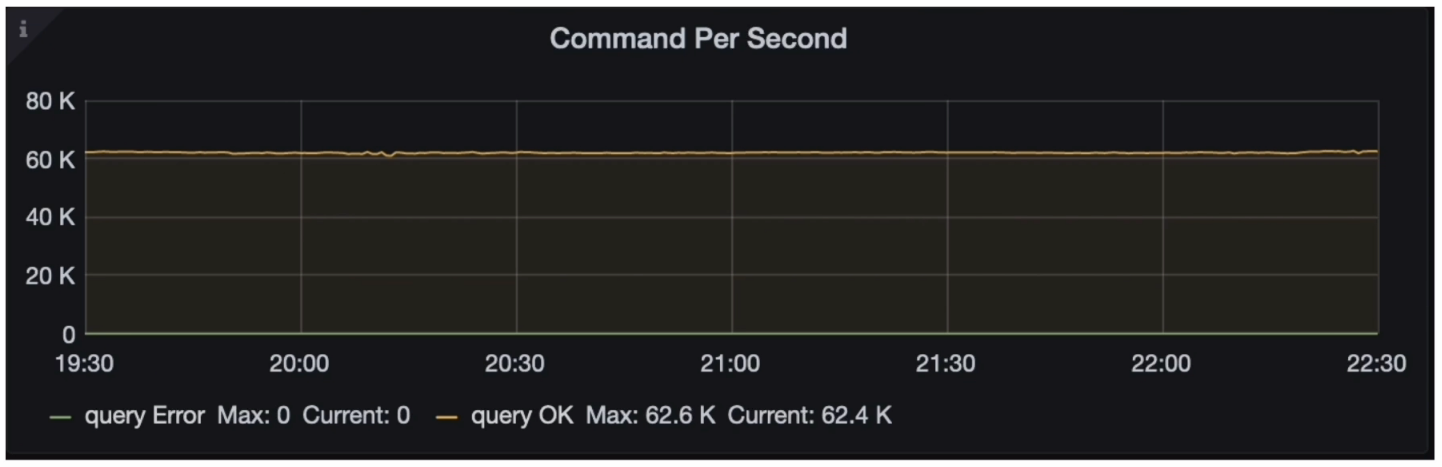
- 集群 CPS & QPS
Grafana 监控 TiDB --> Query Summary --> Command Per Second
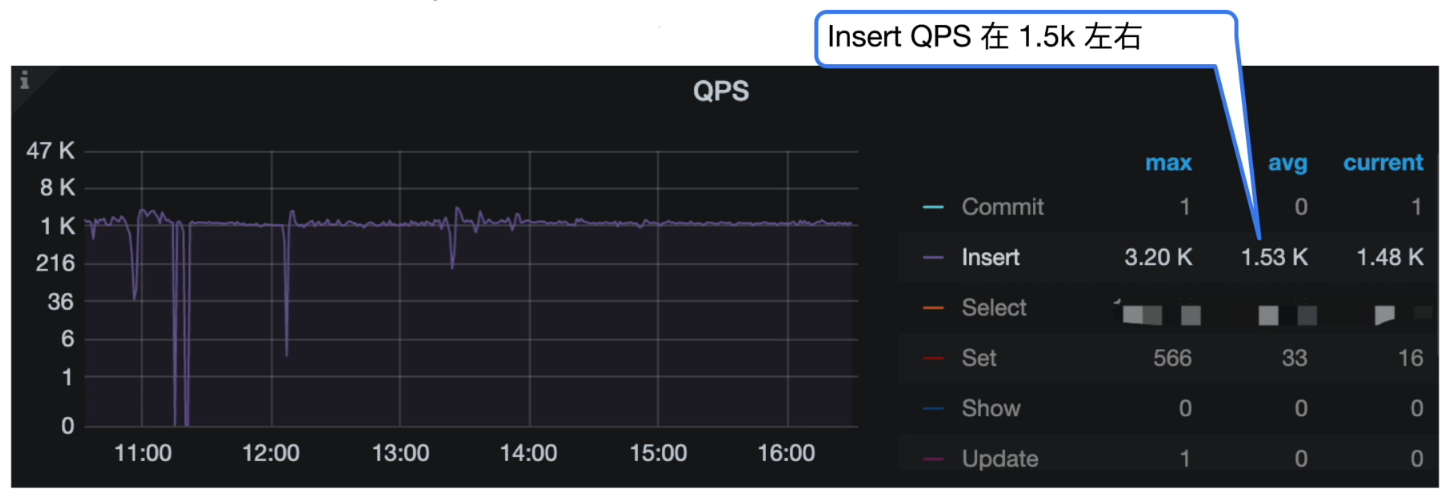
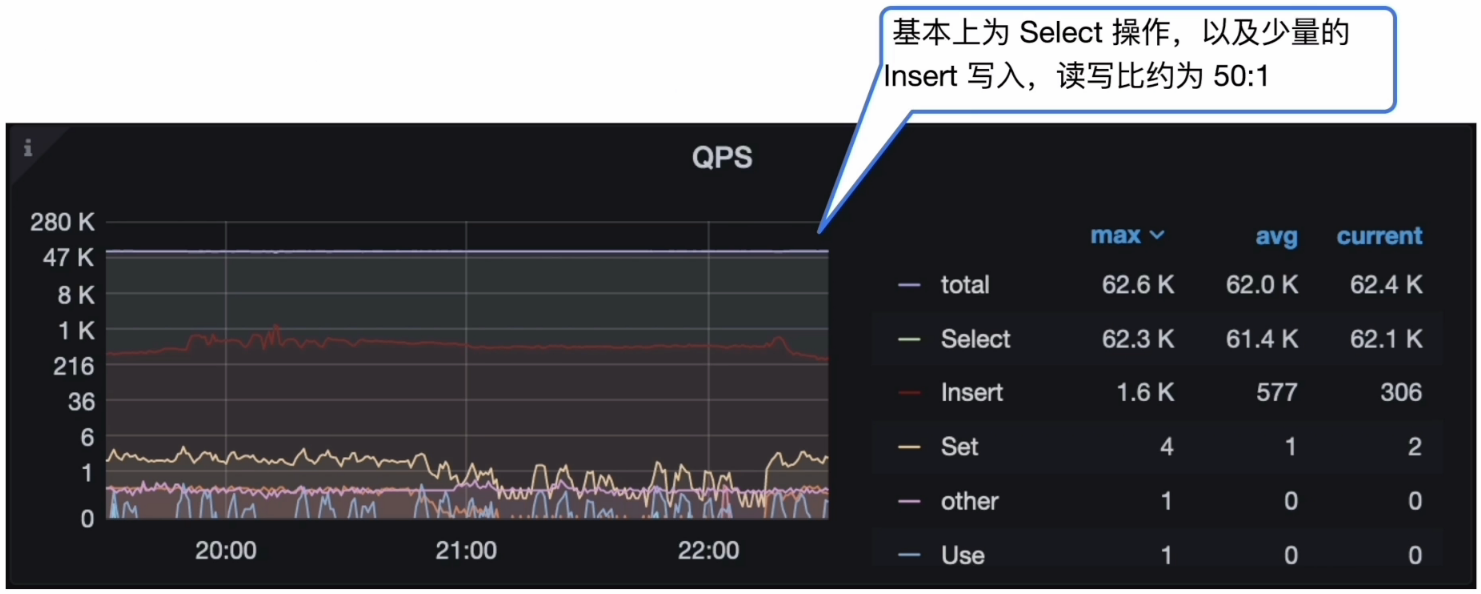
Grafana 监控 TiDB --> Query Summary --> QPS
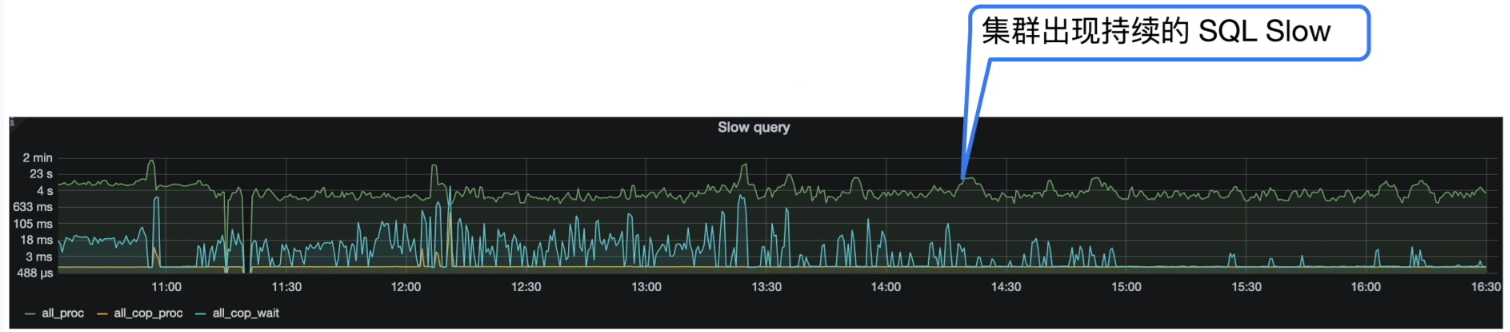
- 慢查询( SQL Slow log )
Grafana 监控 TiDB --> Query Summary --> SQL Slow log
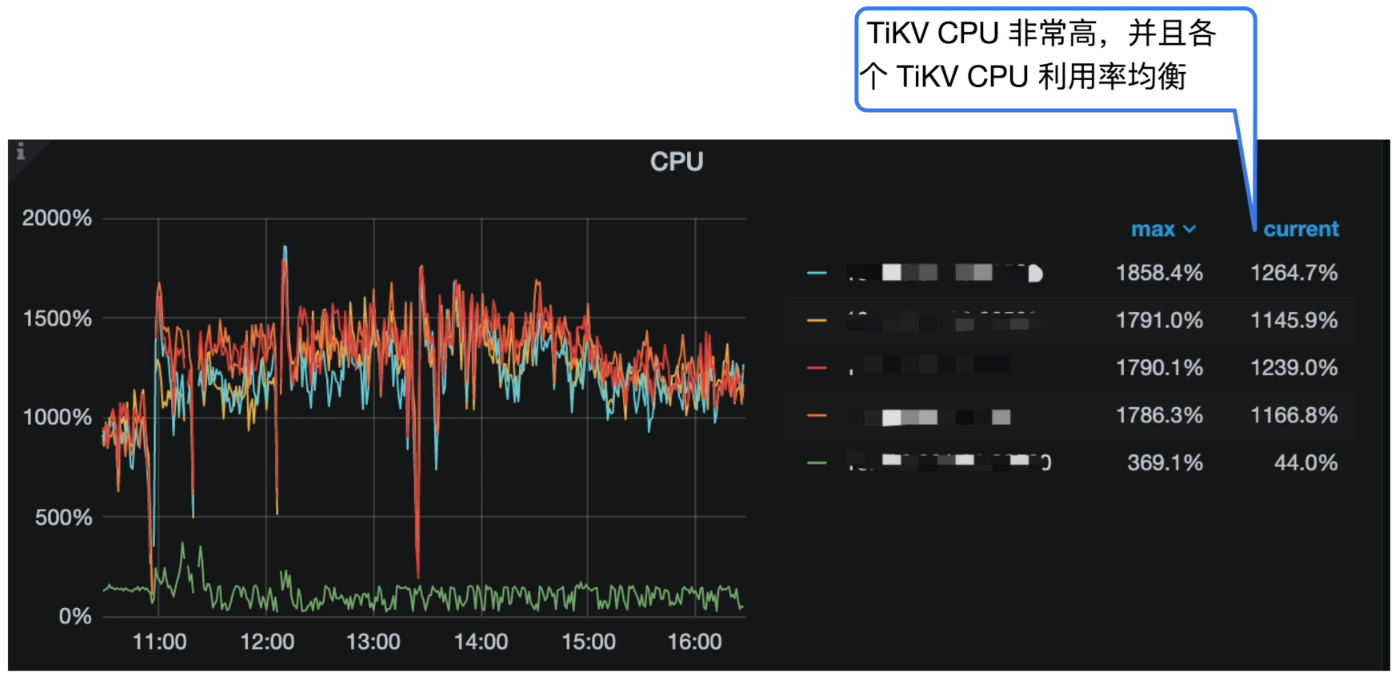
Grafana 监控 TiKV Details --> Cluster --> CPU
分析 SQL Slow Query
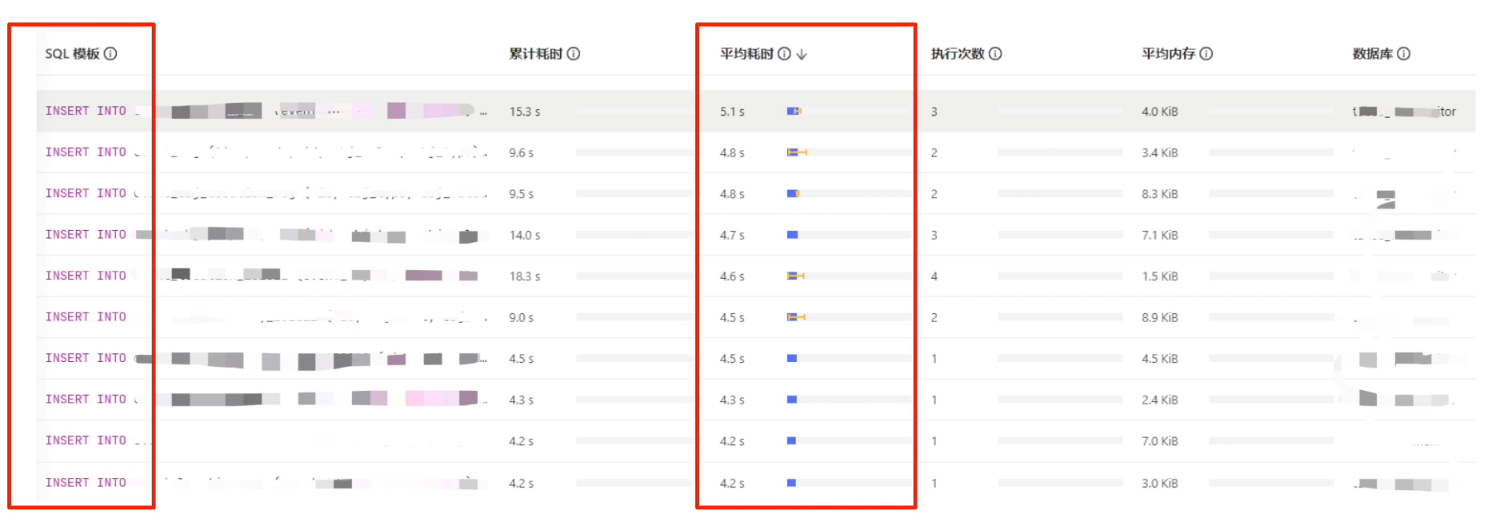
以『TiDB Dashboard慢查询』菜单为例,查看集群慢查询结果:
集群整体情况分析结论
- 分析结论:
- 整体的 Duration 999 线很高,基本在 4s 左右。
- 业务持续写入很慢,TiKV CPU 非常高。
- 各个 TiKV CPU 利用率均衡,可排除写入热点情况。
- Insert QPS 在 1.5k 左右,Slow Query 中看到集中为 insert 语句,平均执行时间在 4s 左右。
- 进一步确认方向:
- TiDB Server 与 TiKV 的耗时
确认 TiDB Server 与 TiKV 耗时
- Grafana 监控 TiDB --> Query Summary --> Duration
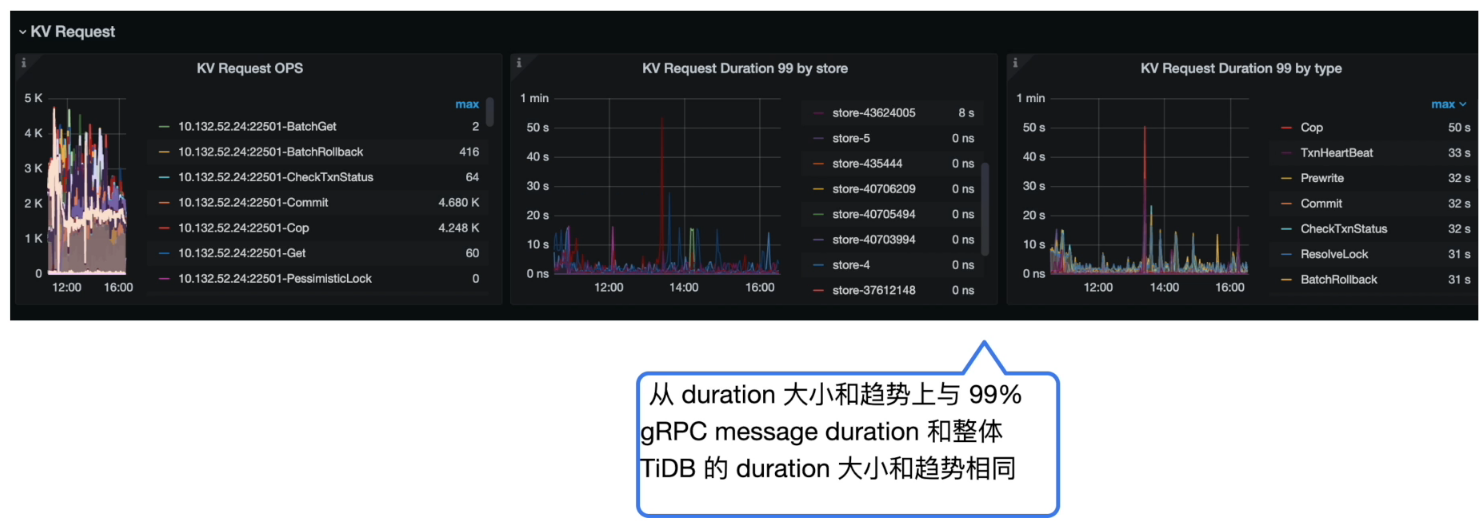
- Grafana 监控 TiDB --> KV Request --> KV Request Duration 99 by store/type
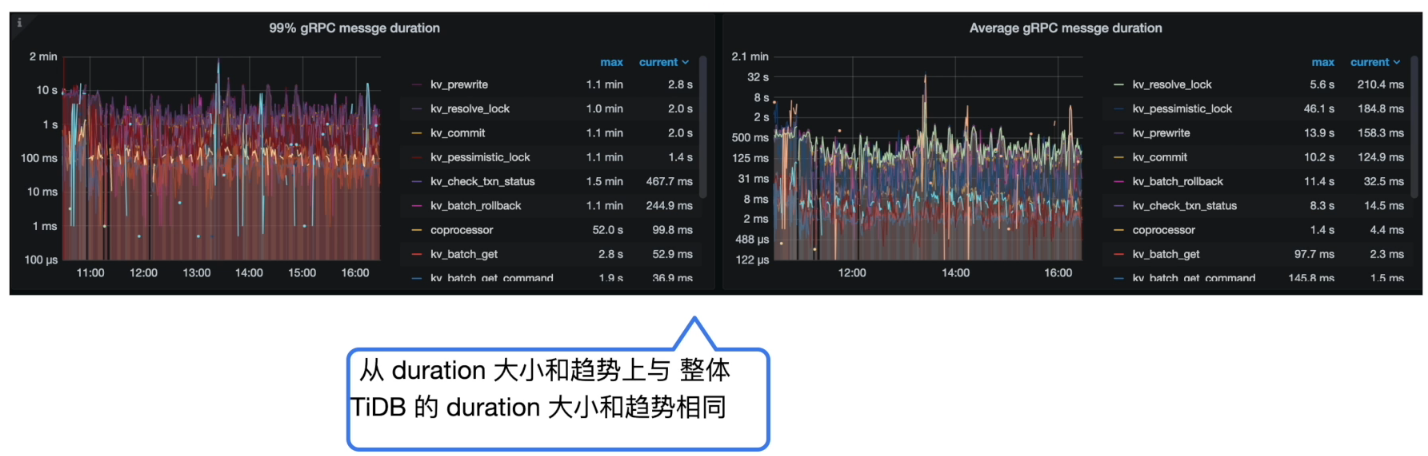
- Grafana 监控 TiKV Details --> gRPC --> 99% gRPC message duration
耗时总结
- 分析结论:
- TiDB Duration 时间和 KV Request 的时间以及 TiKV gRPC message duration 的时间基本对应,基本可以确认慢在 TiKV 侧
- 对比 KV Request Duration 99 by store 与 99% gRPC message duration,可知 TiKV 的耗时出现与网络无关,重点排查TiKV 内部
- 进一步确认方向:
- TiKV 内部处理流程
TiKV具体动作 scheduler
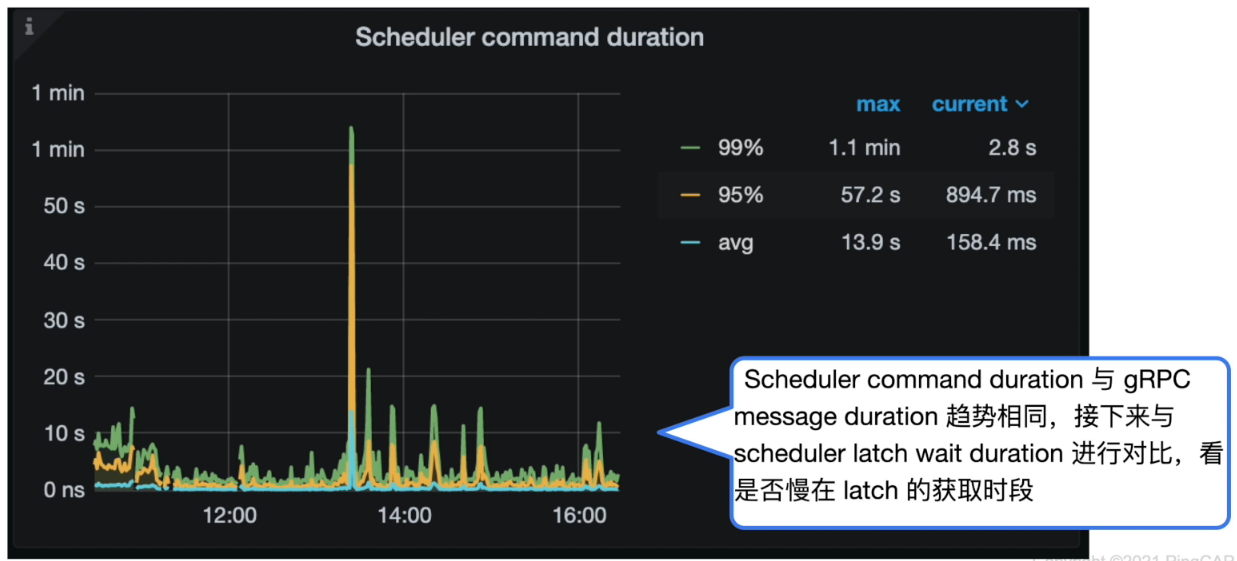
- Grafana 监控 TiKV Details --> Scheduler - prewrite --> Scheduler command duration
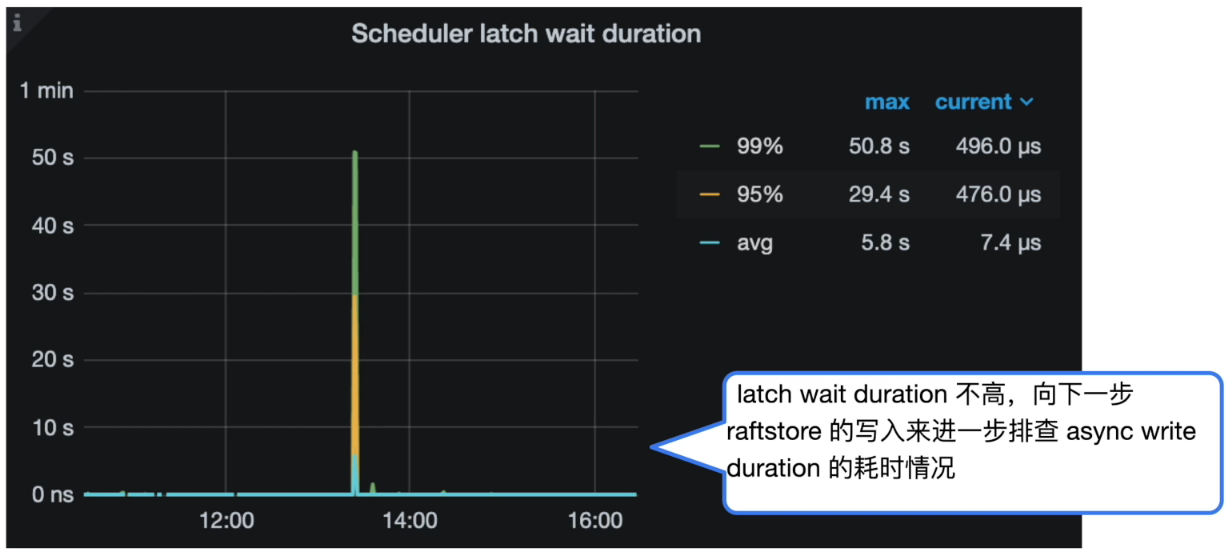
- Grafana 监控 TiKV Details --> Scheduler - prewrite --> Scheduler latch wait duration
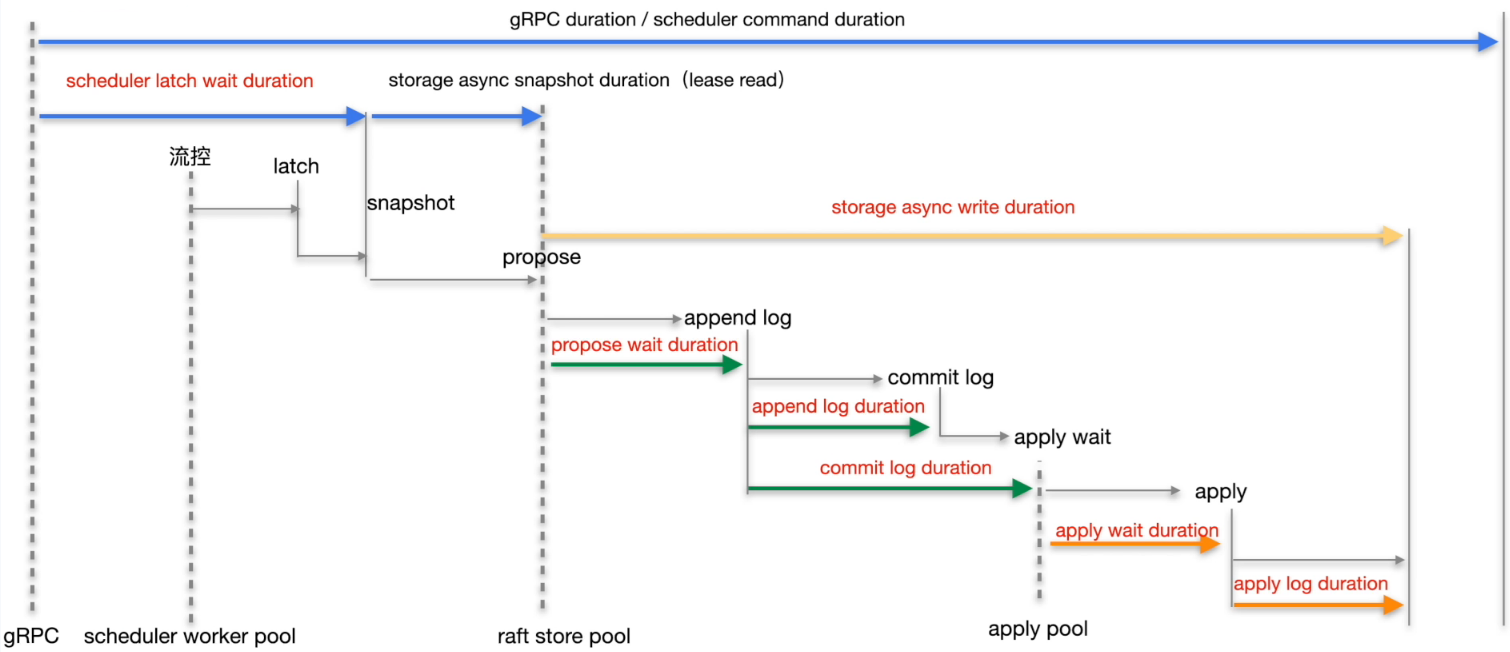
TiKV 具体动作 async write
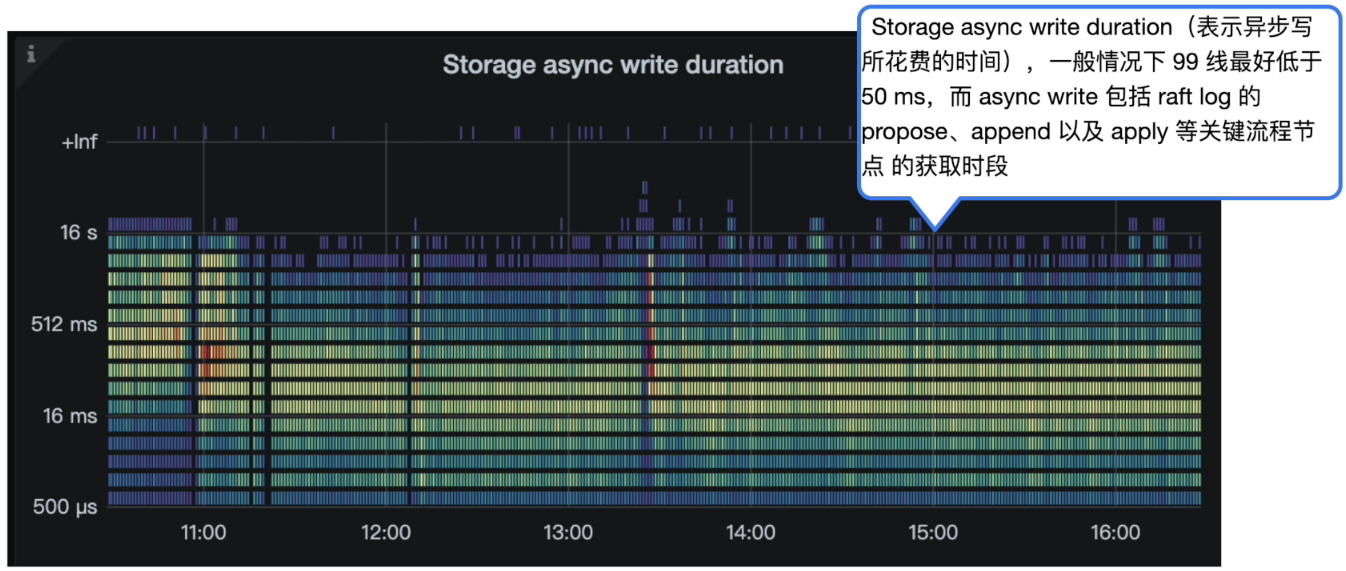
- Grafana 监控 TiKV Details --> Storage -> Storage async write duration
TiKV 具体动作总结
-
分析结论:
- latch wait duration 不高
- Storage async write duration 较高
-
进一步确认方向:
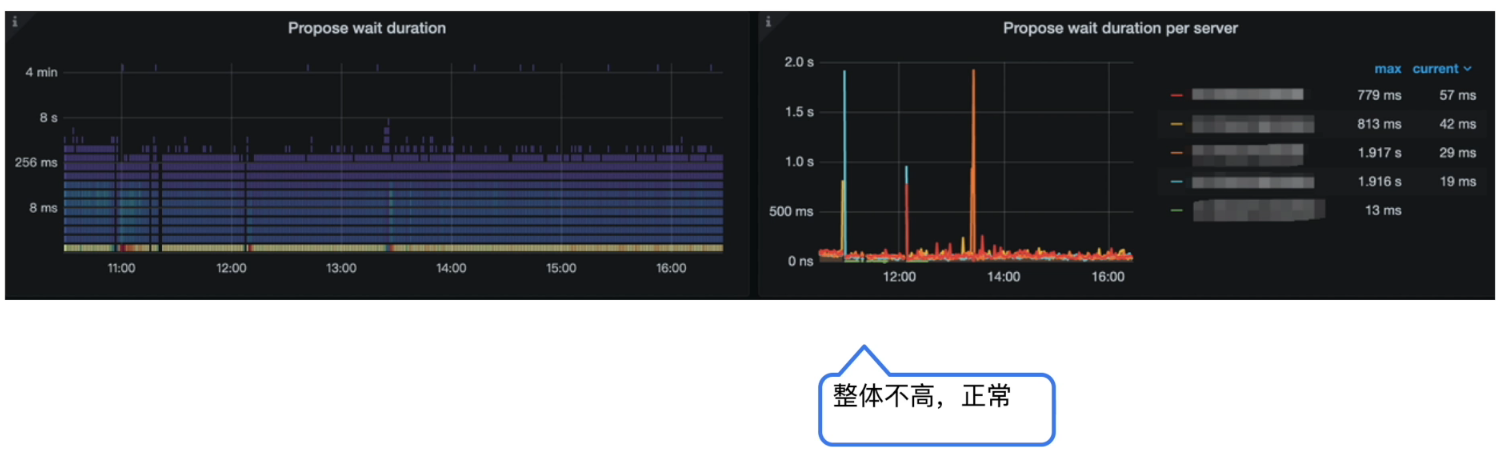
async write 的 duration 的整体耗时是下面5个部分的总和:- Propose wait duration
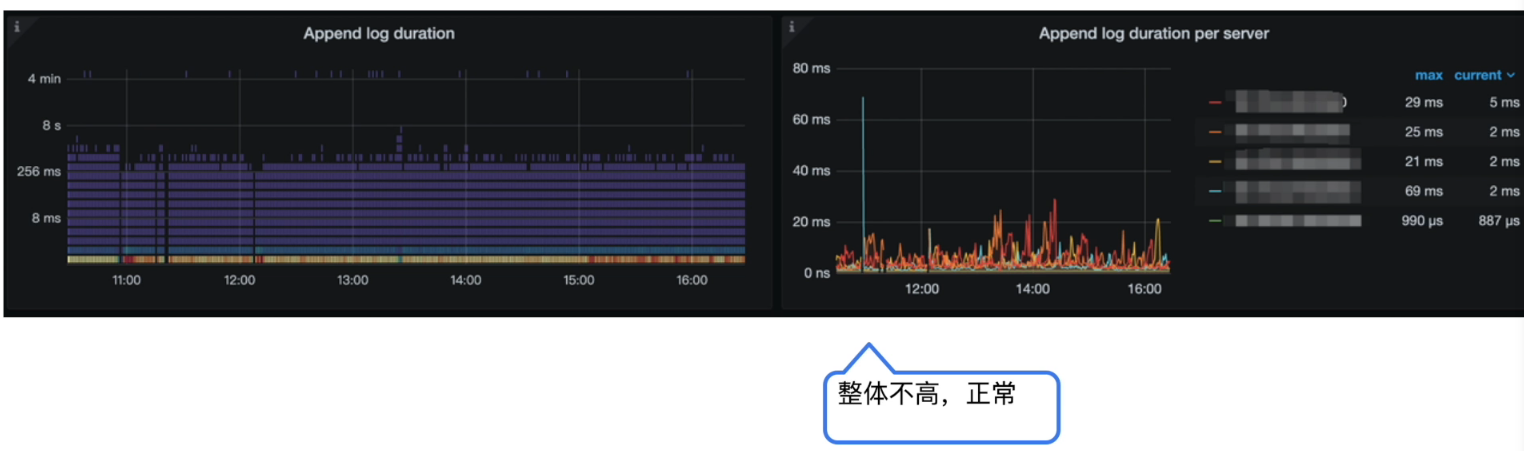
- Append log duration
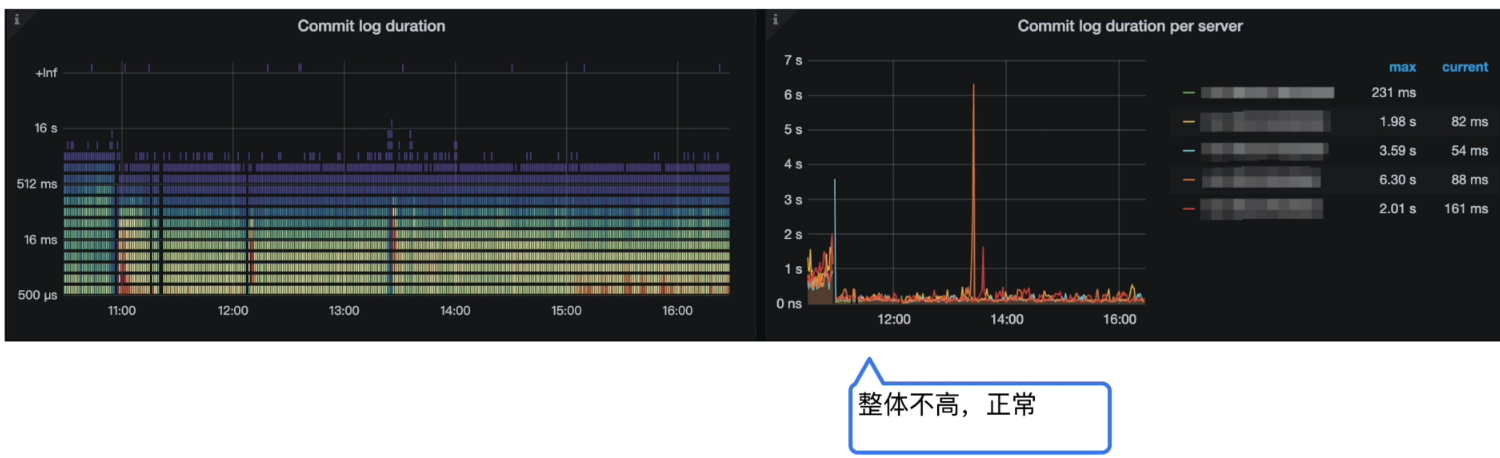
- Commit log duration
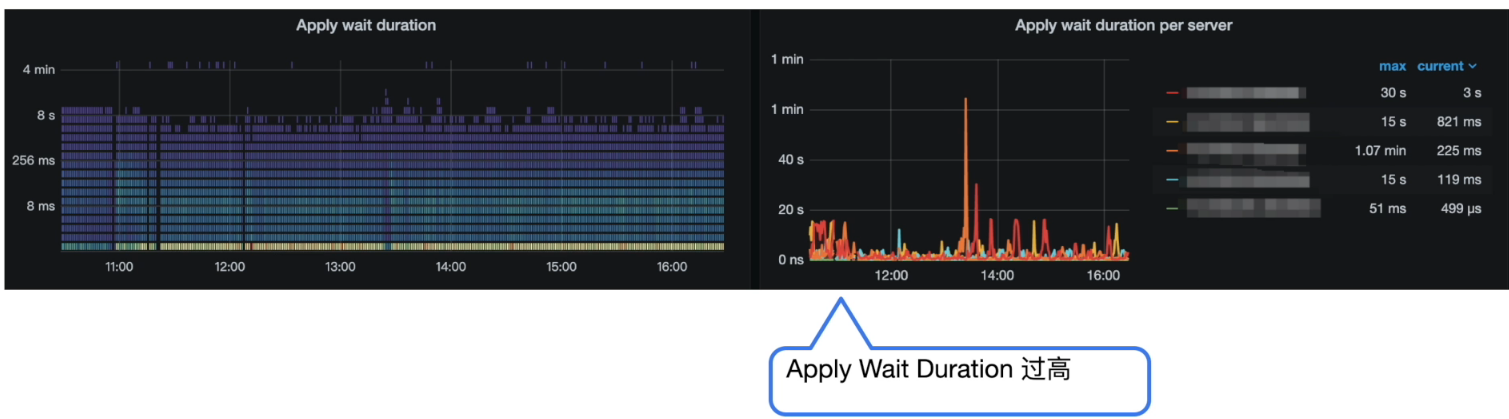
- Apply wait duration
- Apply log duration
-
Grafana 监控 TiKV Details --> Raft Propose --> Propose wait duration per server
-
Grafana 监控 TiKV Details --> Raft I0 --> Append log duration
-
Grafana 监控 TiKV Details --> Raft I0 --> Commit log duration
-
Grafana 监控 TiKV Details --> Raft Propose --> Apply wait duration
-
Grafana 监控 TiKV Details --> Raft I0 --> Apply log duration
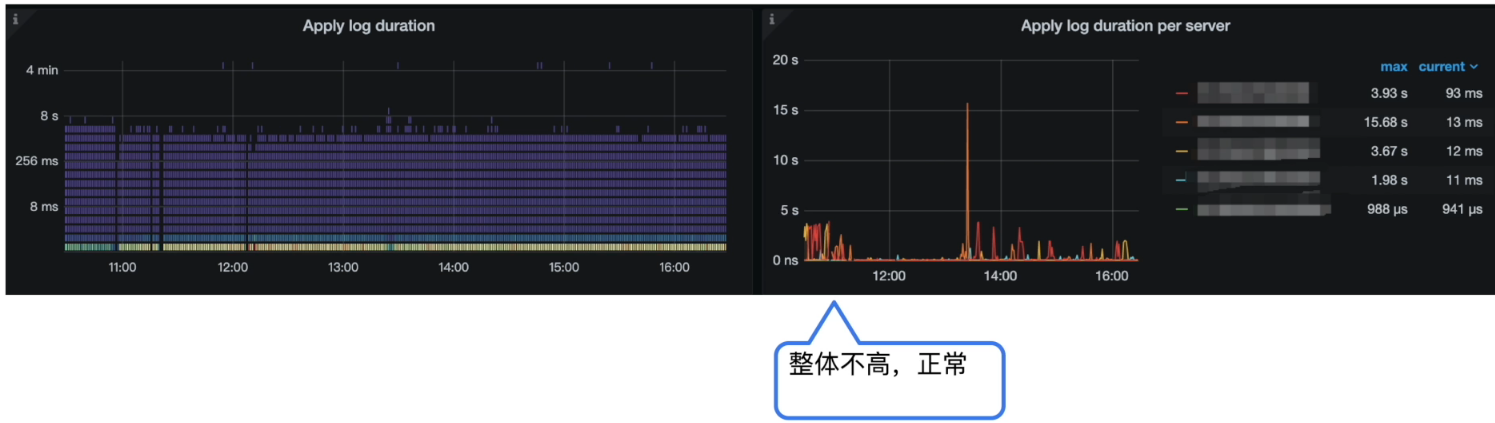
问题定位
分析结论:
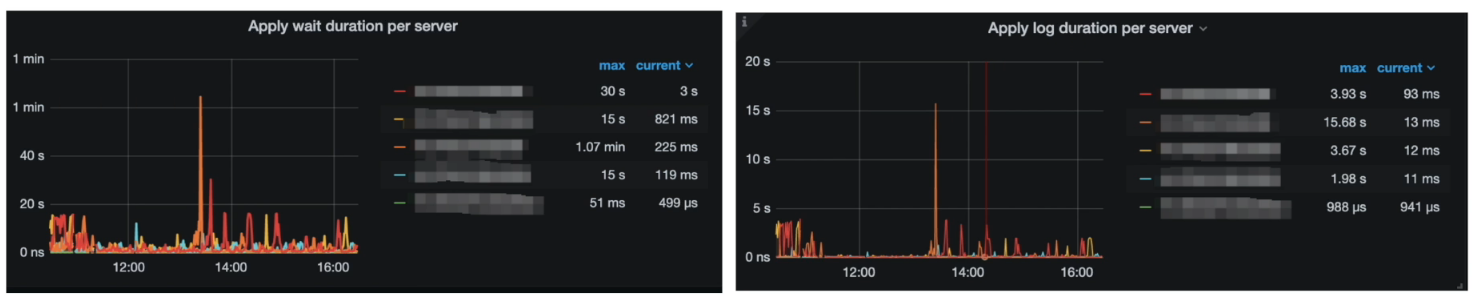
Apply Wait Duration 比 Apply log duration 高出过多,说明在 apply pool 出现了严重的堆积和等待
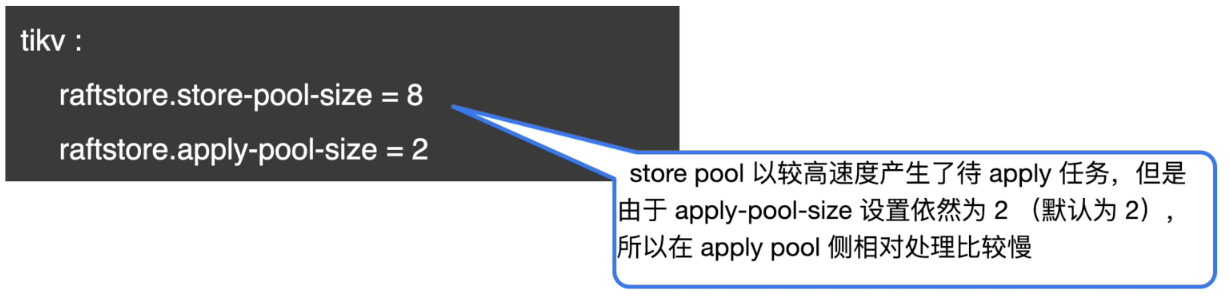
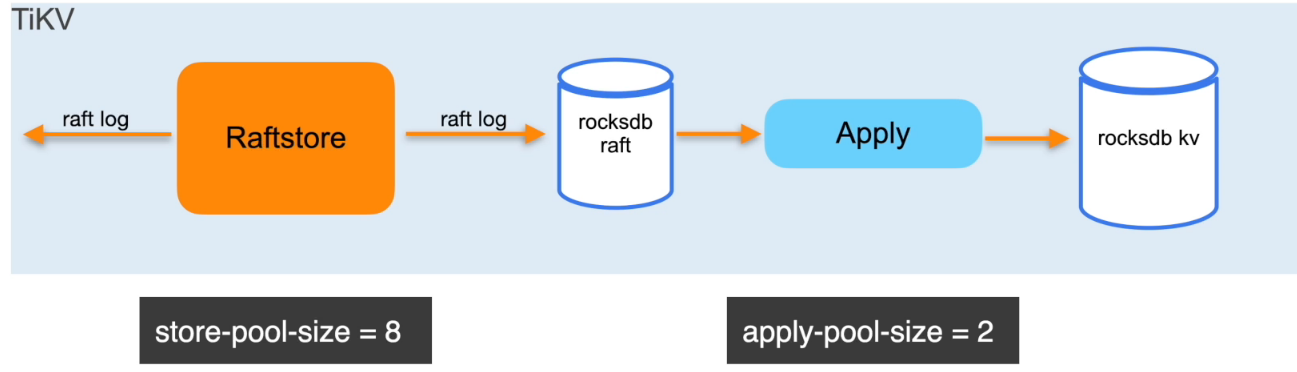
问题解决
解决方案:
- 调整 apply-pool-size 为 8
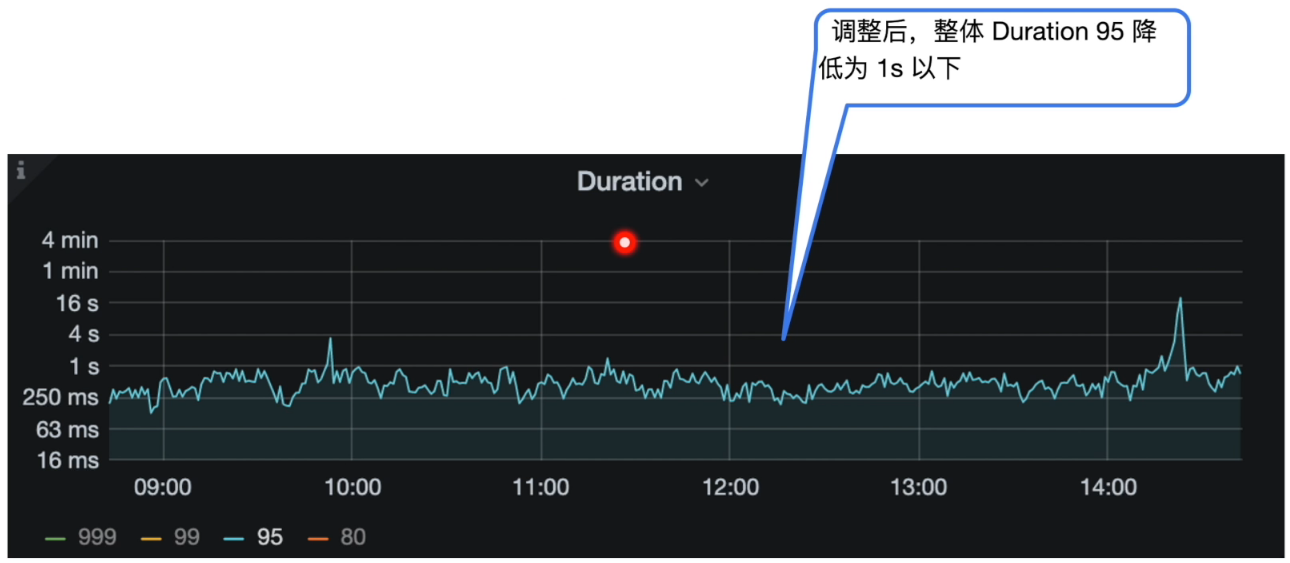
调整后效果:
TiDB 数据库读取慢常见处理方式
数据库响应慢的现象
- 最近也没上线新业务,为什么我的 TiDB 集群延时( Duration )升高了?
- 为什么我的 TiDB 集群,之前很快的语句突然变得非常慢了?
- 为什么我的 TiDB 集群同时出现了大量的慢SQL?
- 想定位问题,但是集群的 Grafana 监控指标这么多,我应该怎么着手处理,优先看哪些监控指标?
- …
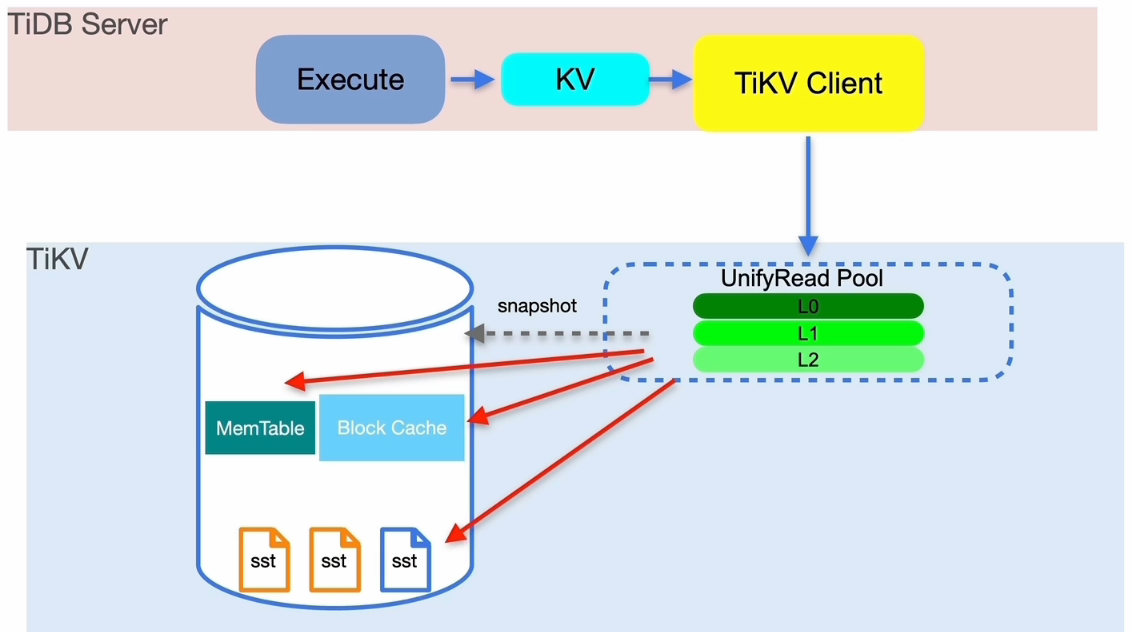
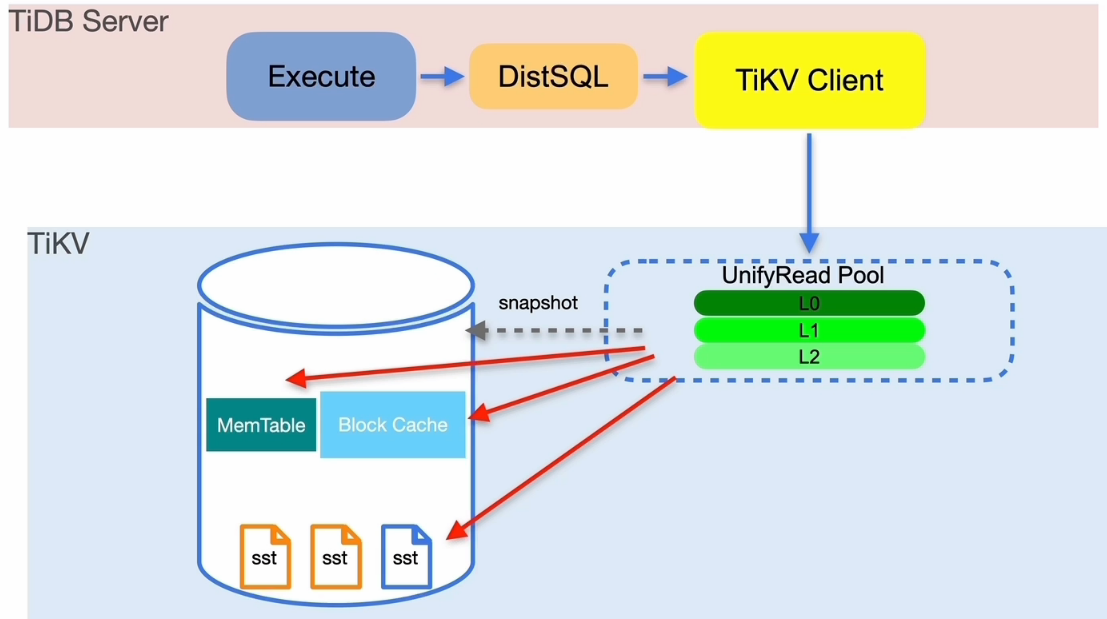
TiDB 读流程简述
读取慢排查思路
通过现象确定排查方向:
- 集群整体响应变慢
- 确认问题组件 TiDB、TiKV 或者 PD
- 某个SQL响应变慢
- Slow Query 定位持续出现的慢查询
- TiDB Dashboard 慢查询定位目标慢 SQL
背景介绍
业务场景描述
- 业务高峰期为︰19:30 ~22:30
- Flink 将计算结果直接写入 TiDB 集群
- 前端 Dashboard 每间隔 1s ~ 5s 会刷新一次数据
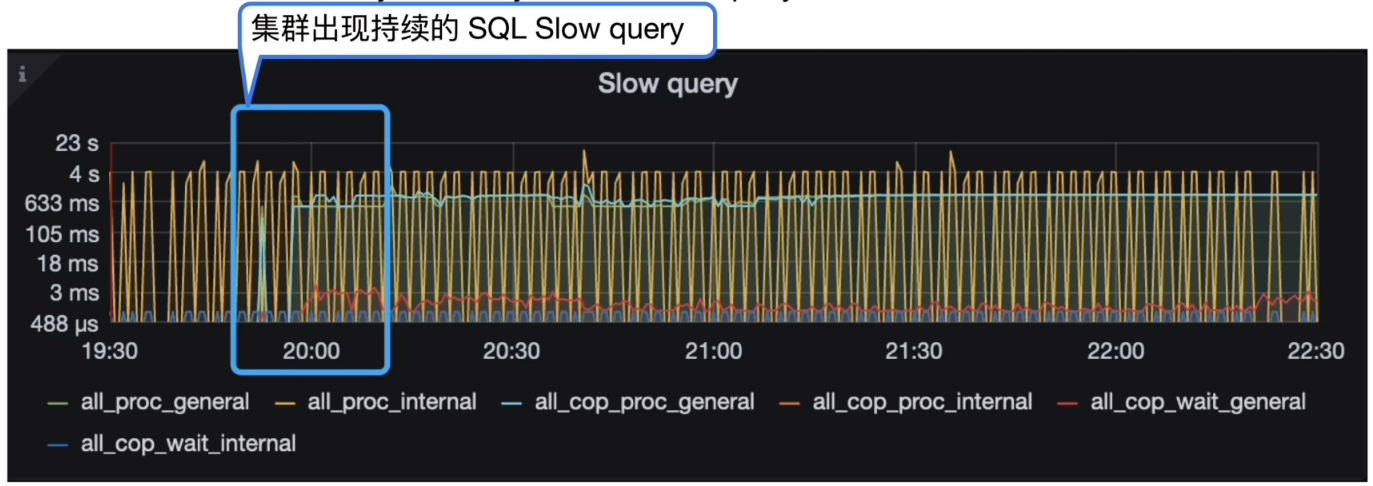
集群整体的延迟( duration ) 没有变化,但是能明显的看到 19:50 左右开始, 集群中的 Slow query 增多,业务侧反馈模块调用时间呈上涨趋势。
集群整体情况
业务变更
- 新业务上线:否
- DDL操作:否
集群 Duration
- Grafana 监控 TiDB --> Query Summary --> Duration
集群 CPS & QPS
- Grafana 监控 TiDB --> Query Summary --> Command Per Second
- Grafana 监控 TiDB --> Query Summary --> QPS
慢查询( SQL Slow log )
- Grafana 监控 TiDB–> Query Summary --> SQL Slow query
从 SQL Slow Query 开始
关心集群中 SQL 的运行情况:
- SQL 执行计划是否出现偏差
- Slow log 中 SQL 各阶段等待时间
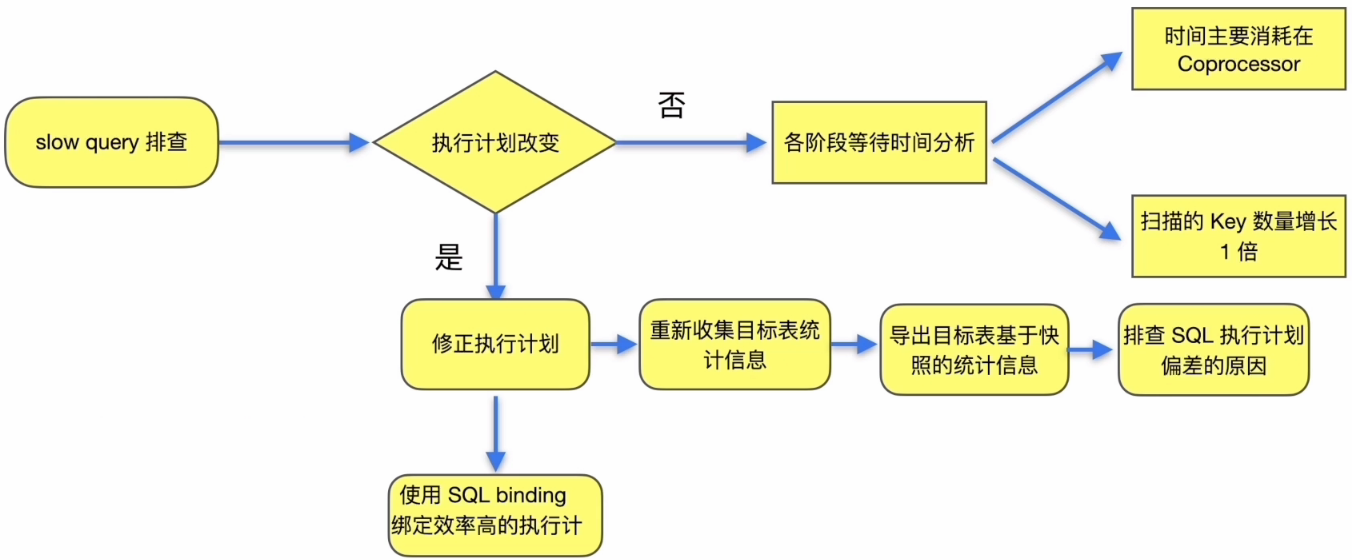
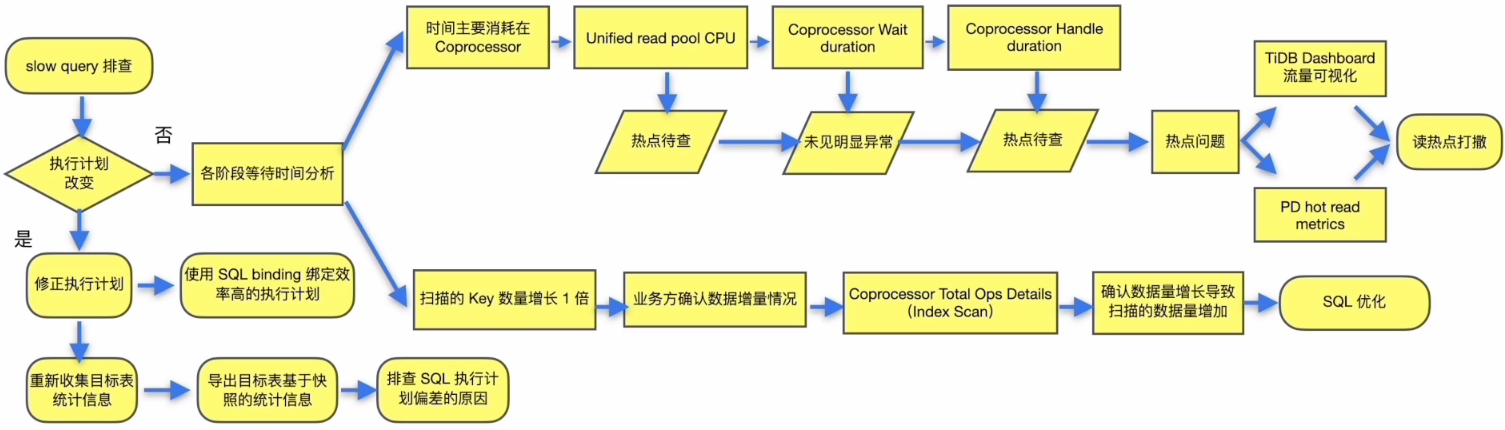
执行计划偏差

如何处理执行计划偏差︰
- 重新收集目标表统计信息
- 参考 statements_summary 中该 SQL 的 plan digest 的查询结果,选择执行效率高的执行计划采用 SQL Binding 进行绑定
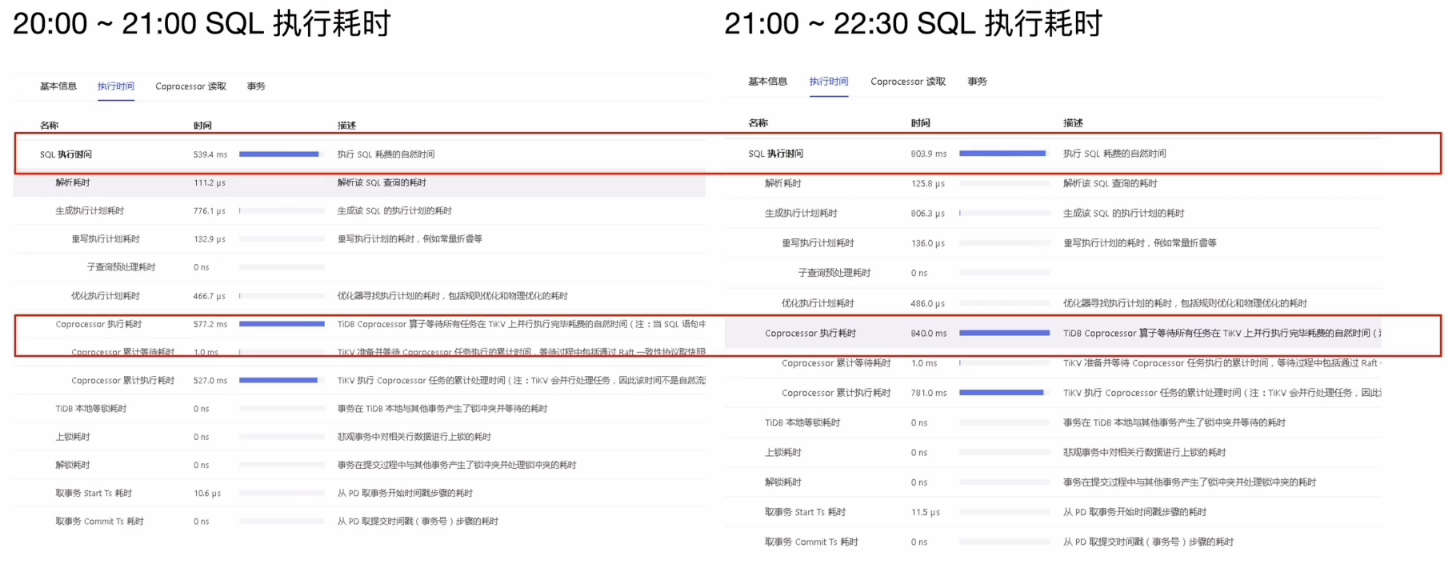
各阶段等待时间对比
业务相关操作调查
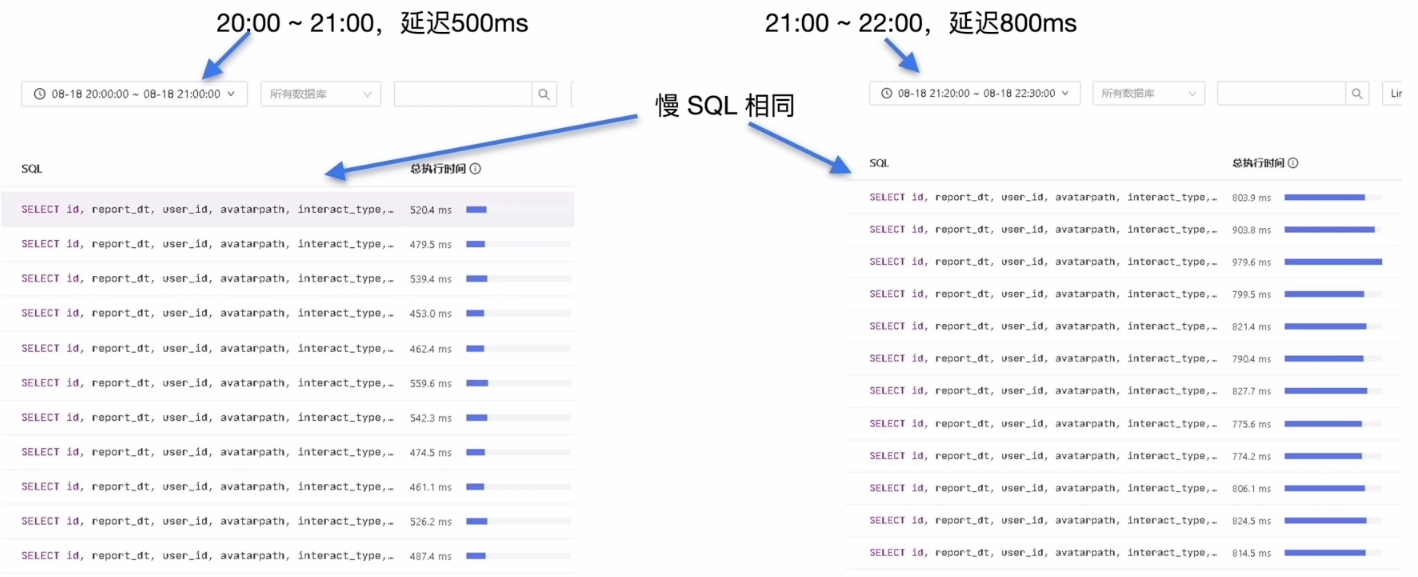
SQL 对应的目标表 report_interact_detail 的数据量不断的增加,表中数据的增量情况待查
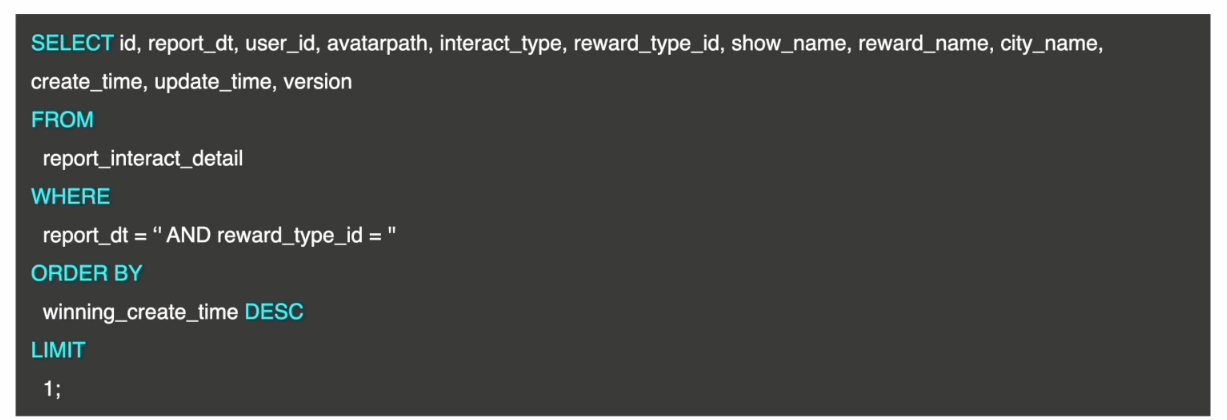
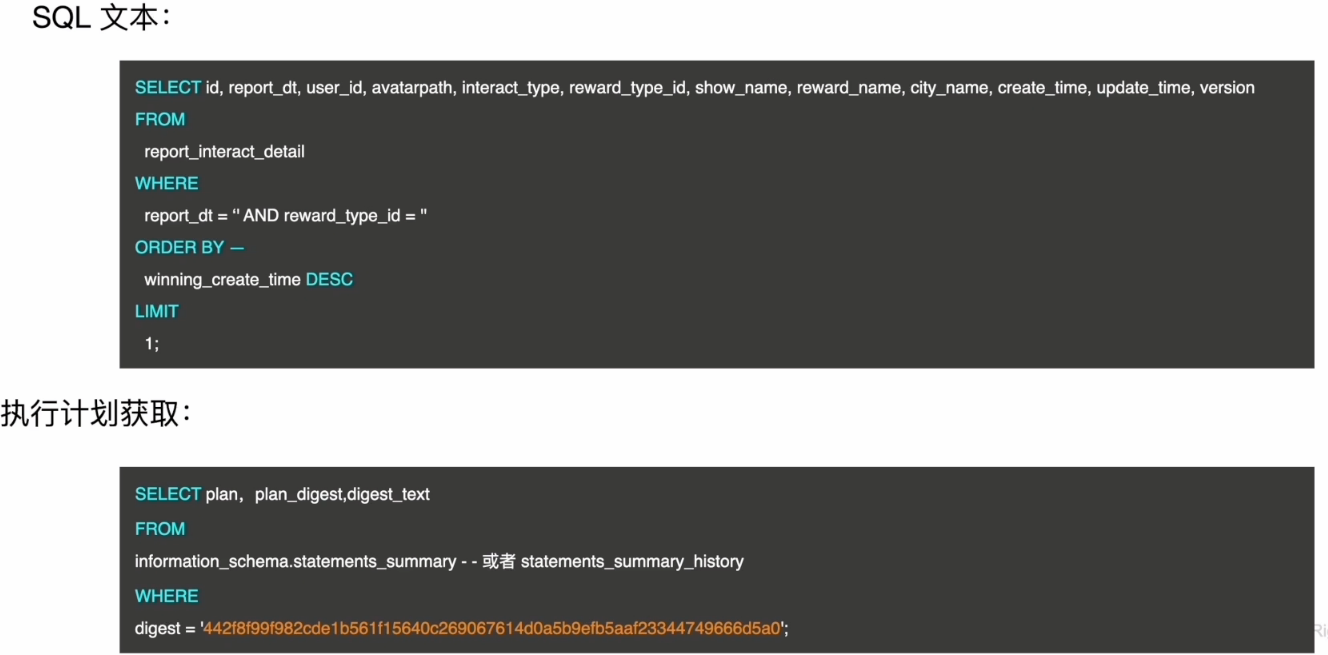
SELECT id, report_dt, user_id, avatarpath, interact_type, reward_type_id, show_name, reward_name, city_name,create_time, update_time, version
FROM
report_interact_detail
WHERE
report_dt = " AND reward_type_id = "
ORDER BY
winning_create_time DESC
LIMIT
1;
复制
SQL 中使用的是 Order by winning_create_time DESC,索引扫描使用 create_time 字段上的单列索引
慢SQL分析结论
- 分析结论:
- SQL 的执行计划未发生改变(没有偏差)
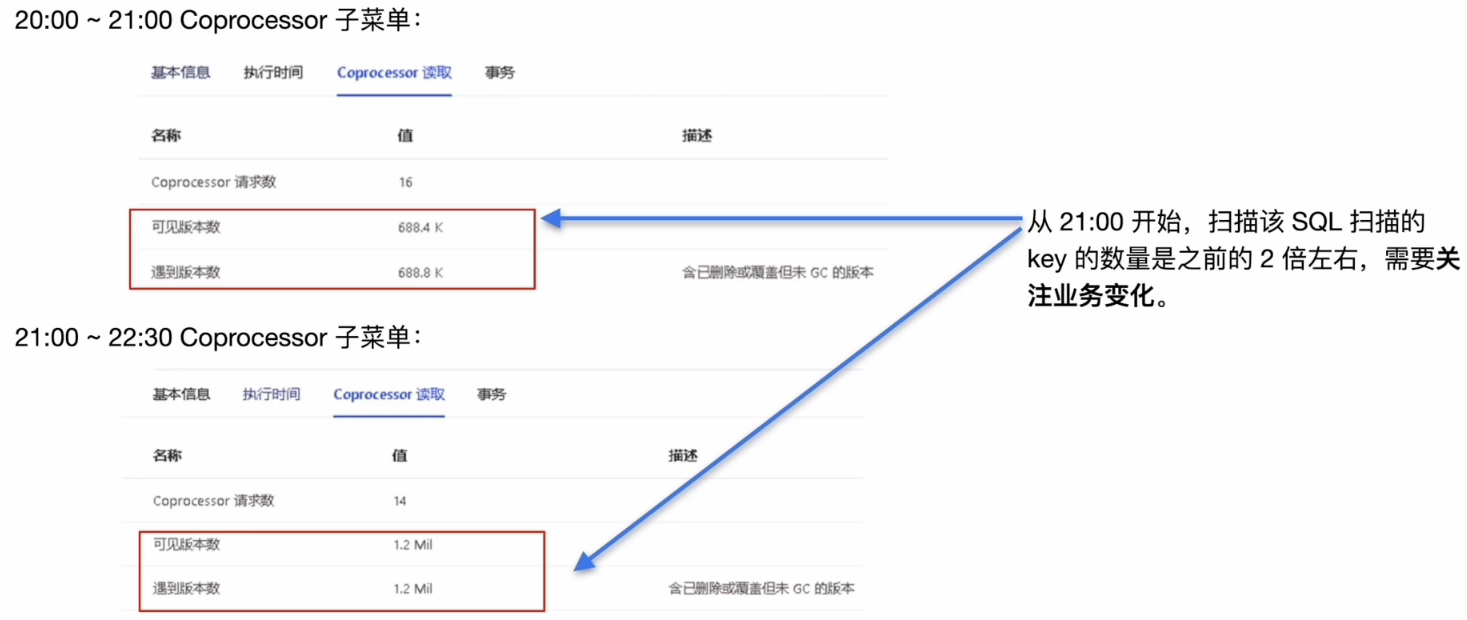
- SQL 的等待耗时主要集中在 TiKV 侧的 coprocessor,扫描了大量的 key
- 进—步确认方向:
- TiKV 侧的 coprocessor 对于 key 的扫描
- 业务方面确认数据增长情况
流程小结
确认TiKV耗时
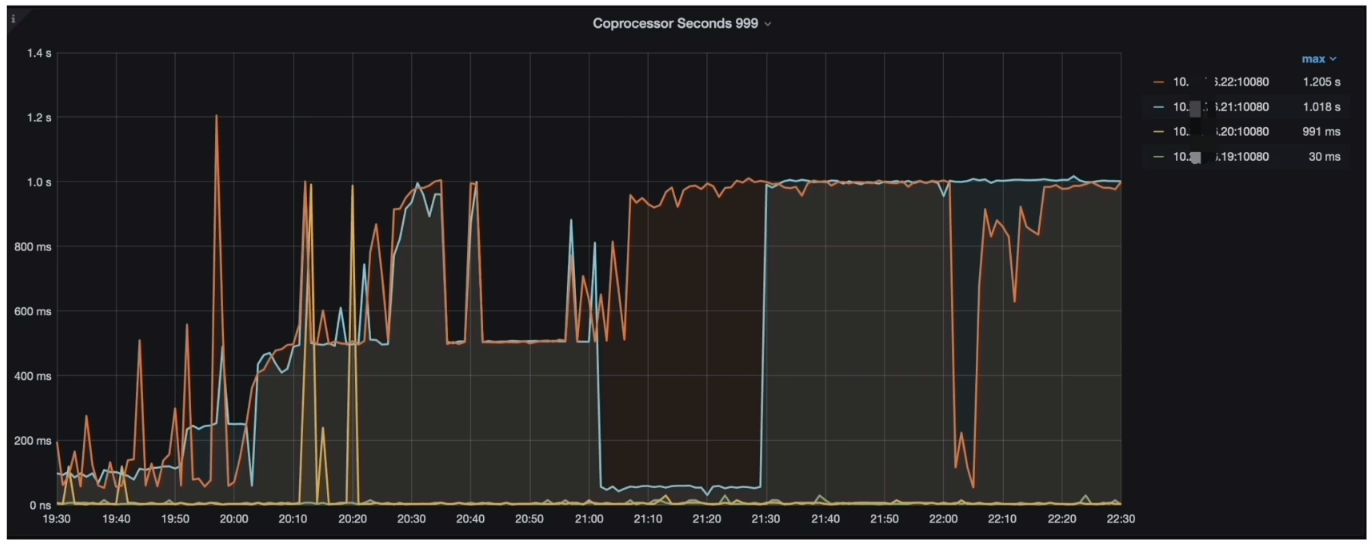
- Grafana --> TiDB --> Distsql --> Coprocessor Seconds 999
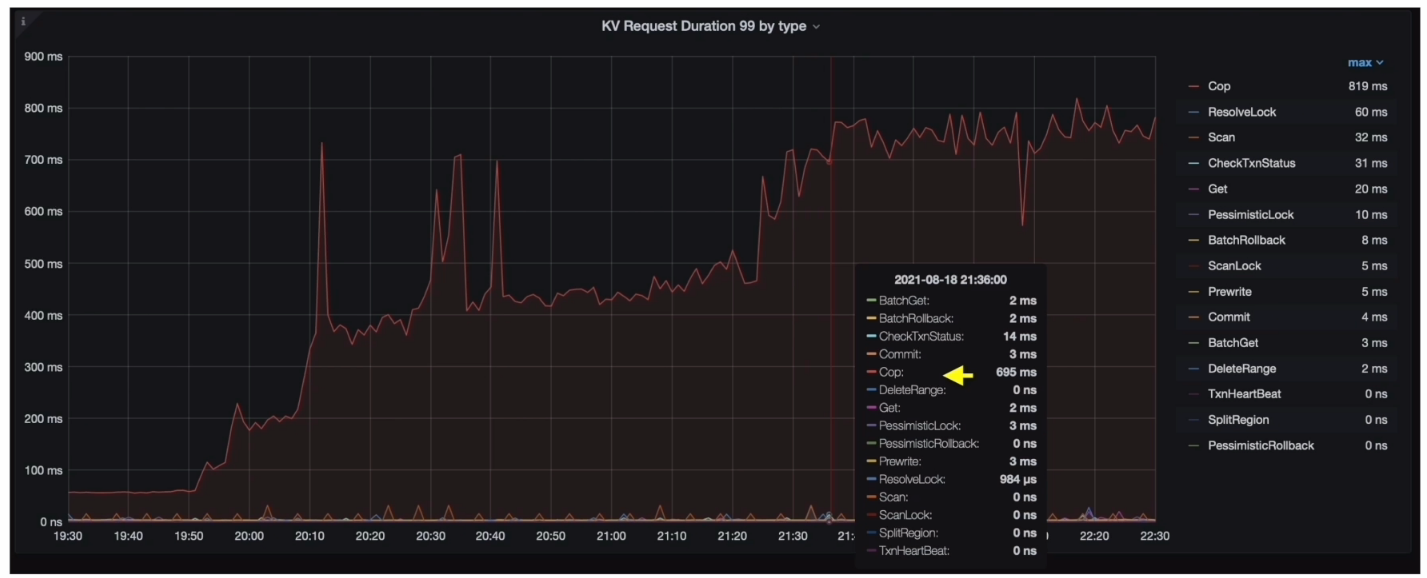
- Grafana --> TiDB --> KV Request --> KV Request Duration 99 by type
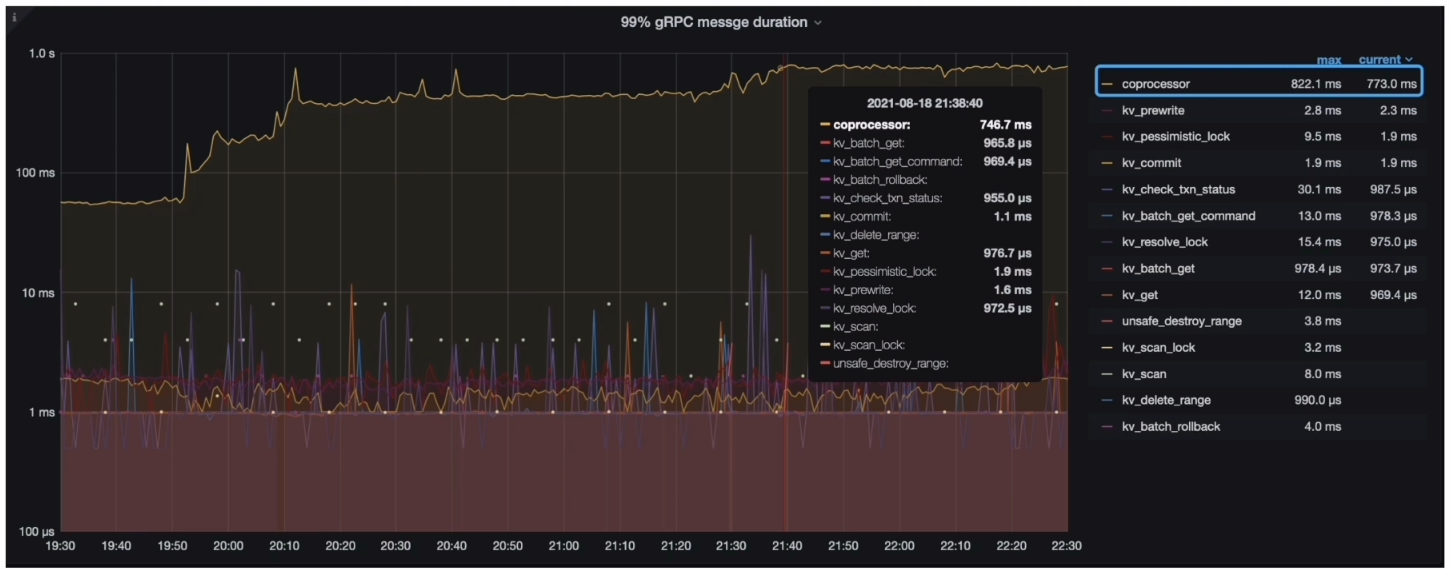
- Grafana --> TiKV-Details --> gRPC --> 99% gRPC messge duration
TiKV耗时分析结论
- 分析结论:
- 耗时较高的位置应该在 TiKV 的 Coprocessor 上
- 进—步确认方向:
- 各个 TiKV 的 Coprocessor
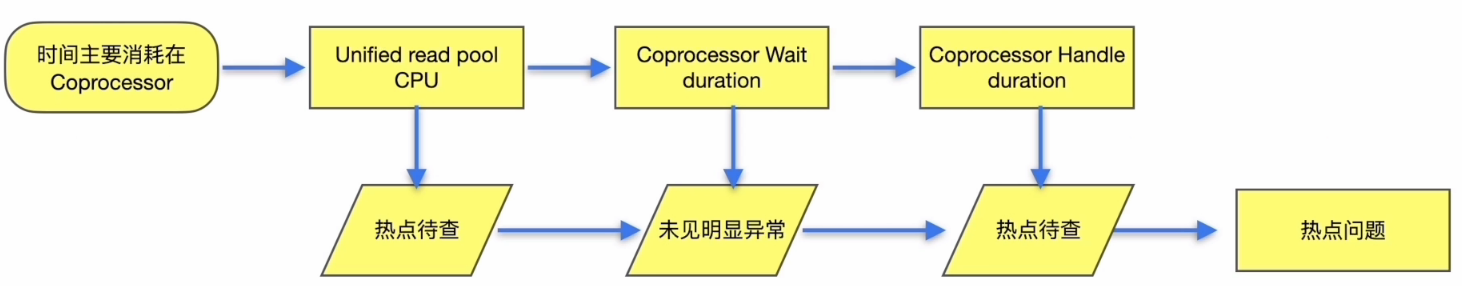
Coprocessor
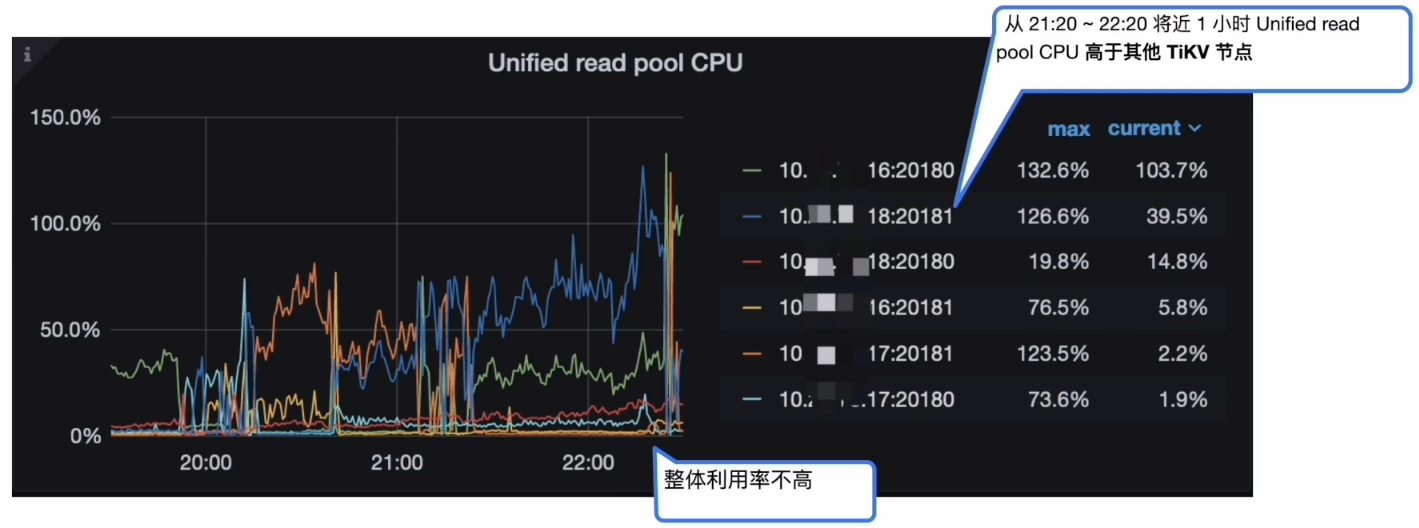
- Grafana --> TiKV-Details --> Thread CPU --> Unified read pool CPU
- Grafana --> TiKV-Details --> Coprocessor Detail --> Wait duration

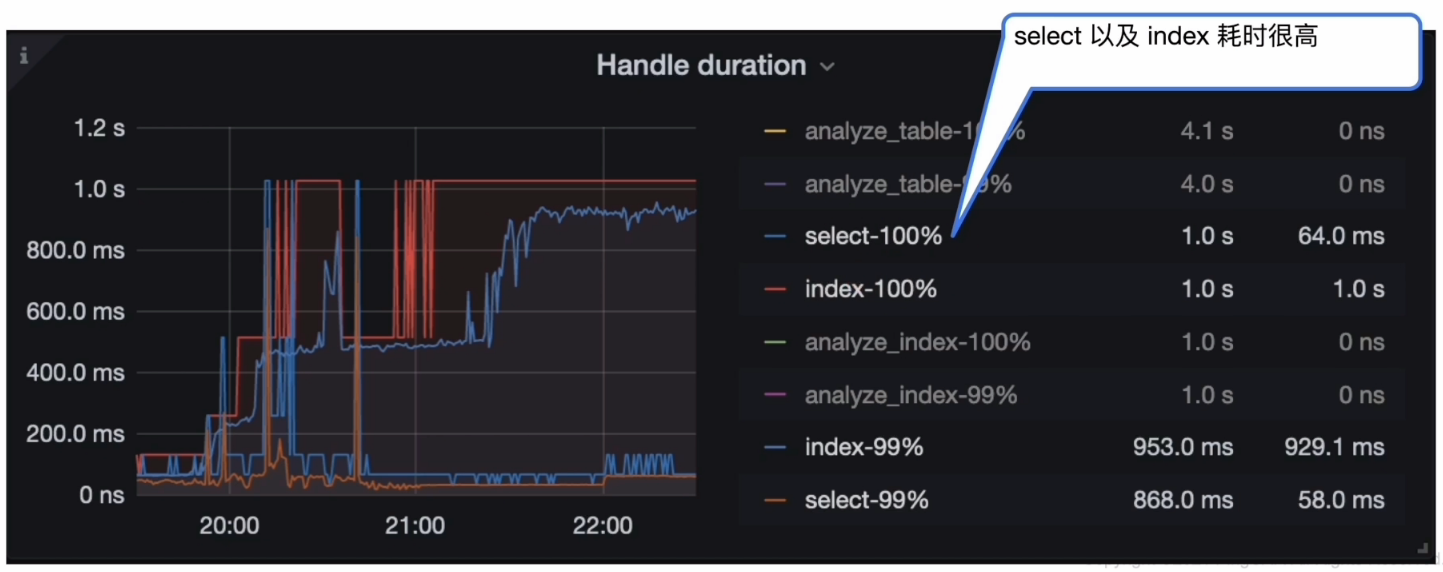
- Grafana --> TiKV-Details --> Coprocessor Detail --> Handle duration
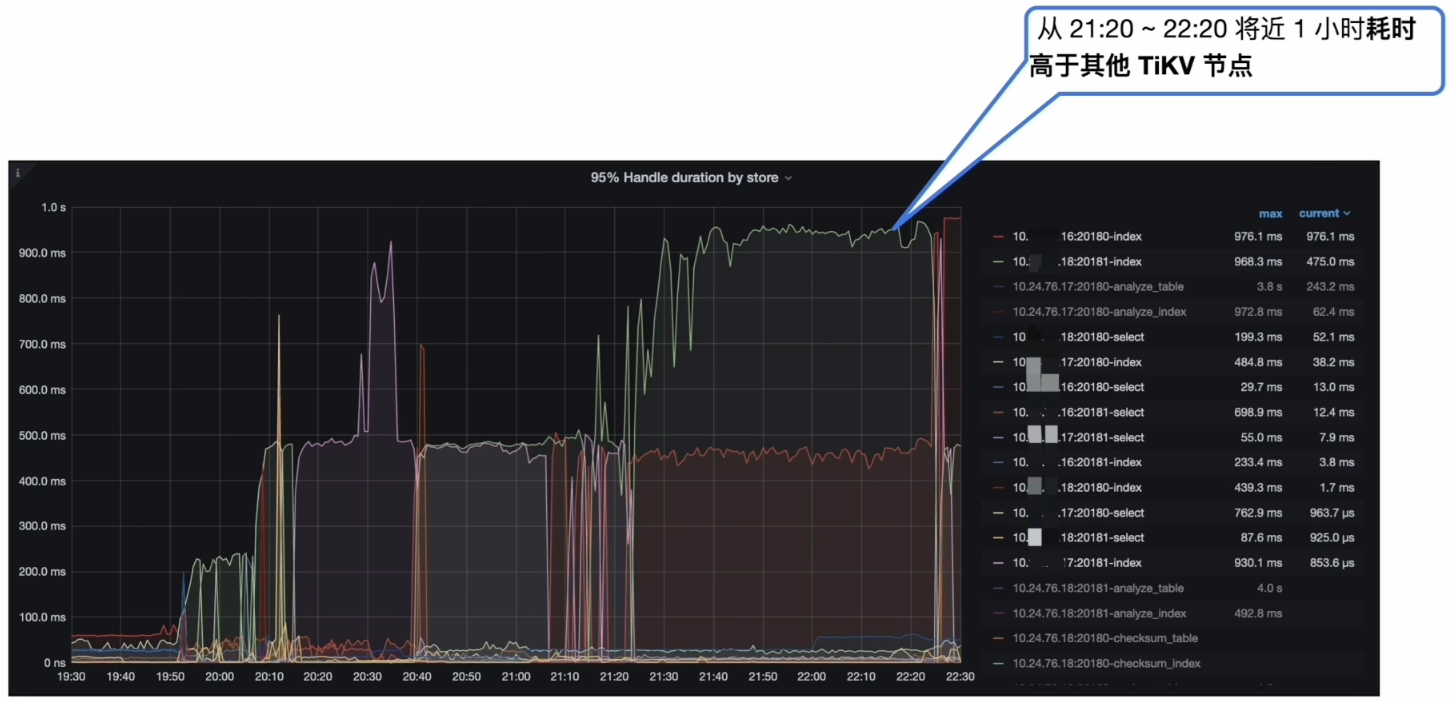
- Grafana --> TiKV-Details --> Coprocessor Detail -->95% Handle duration by store
Coprocessor 分析结论
- 分析结论:
- 某 TiKV 从 21:20~22:20 将近 1 小时 Unified read pool CPU 高于其他 TiKV 节点
- 各个 TiKV 的 Coprocessor Wait duration 不高,获取 Snapshot 和构建 Handler 的时间非常短,不是瓶颈
- 某 TiKV 从 21:20 ~ 22:20 将近1小时 Coprocessor Handle duration 中 select 以及 index 耗时很高
- 进—步确认方向:
- 读热点现象
流程小结
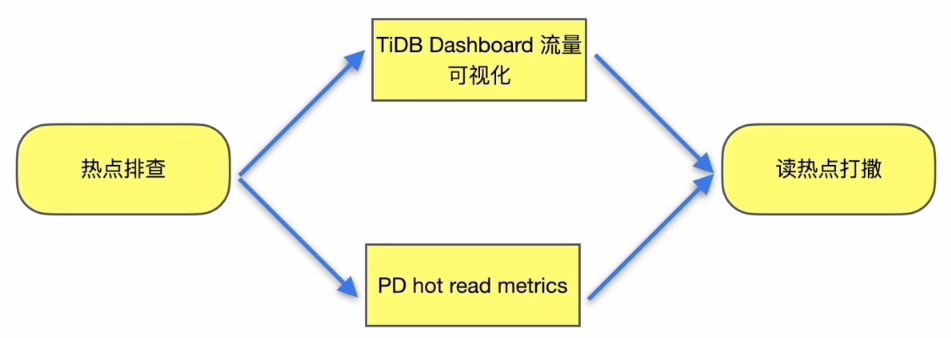
热点排查
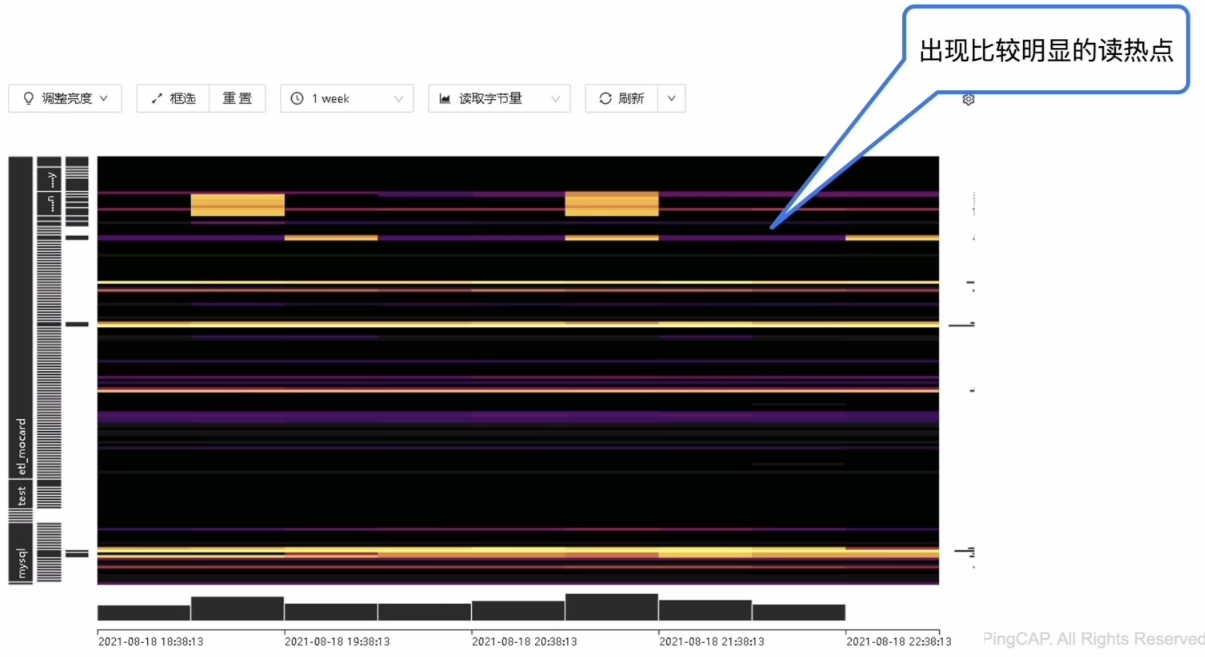
- TiDB Dashboard 流量可视化
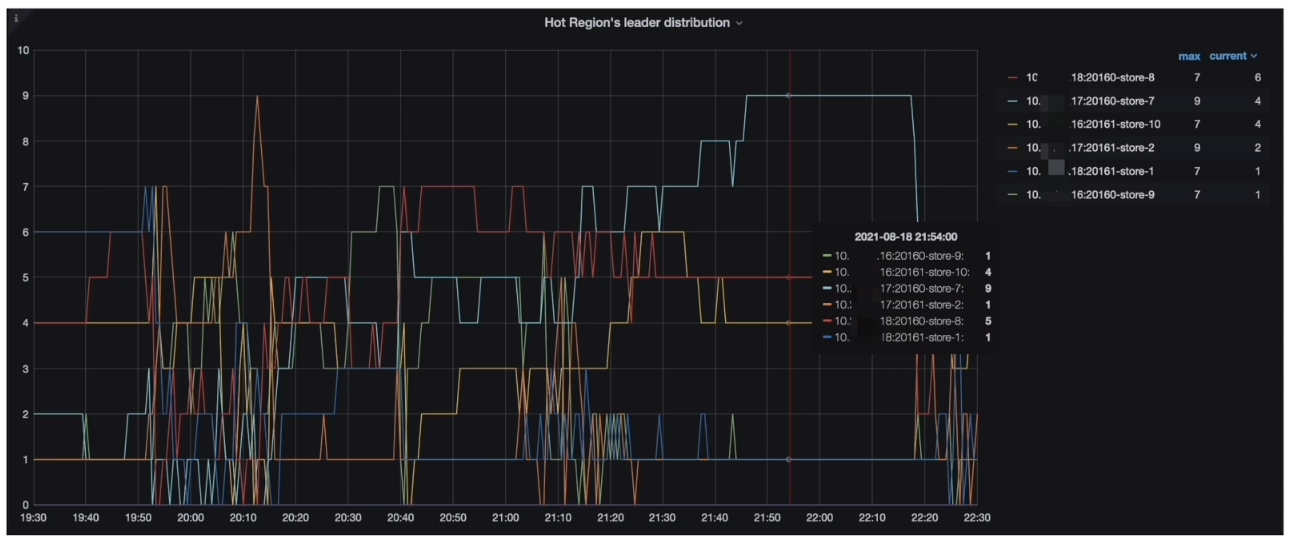
- Grafana --> PD–> Statistics - hot read 监控指标(Hot Region’s leader distribution )
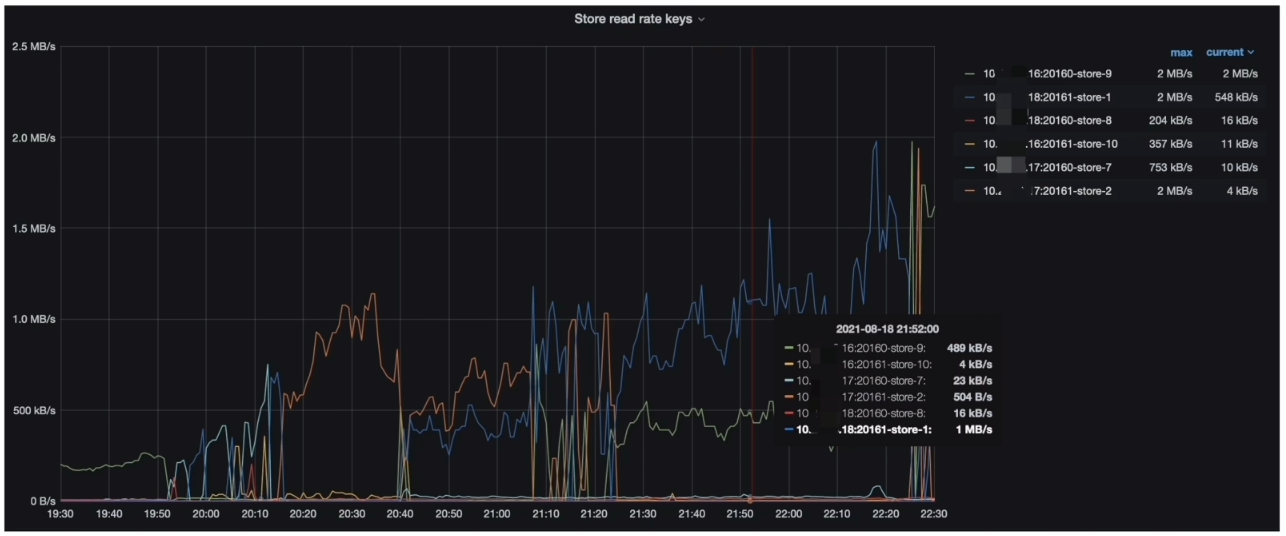
- Grafana --> PD–> Statistics - hot read 监控指标(Store read rate keys )
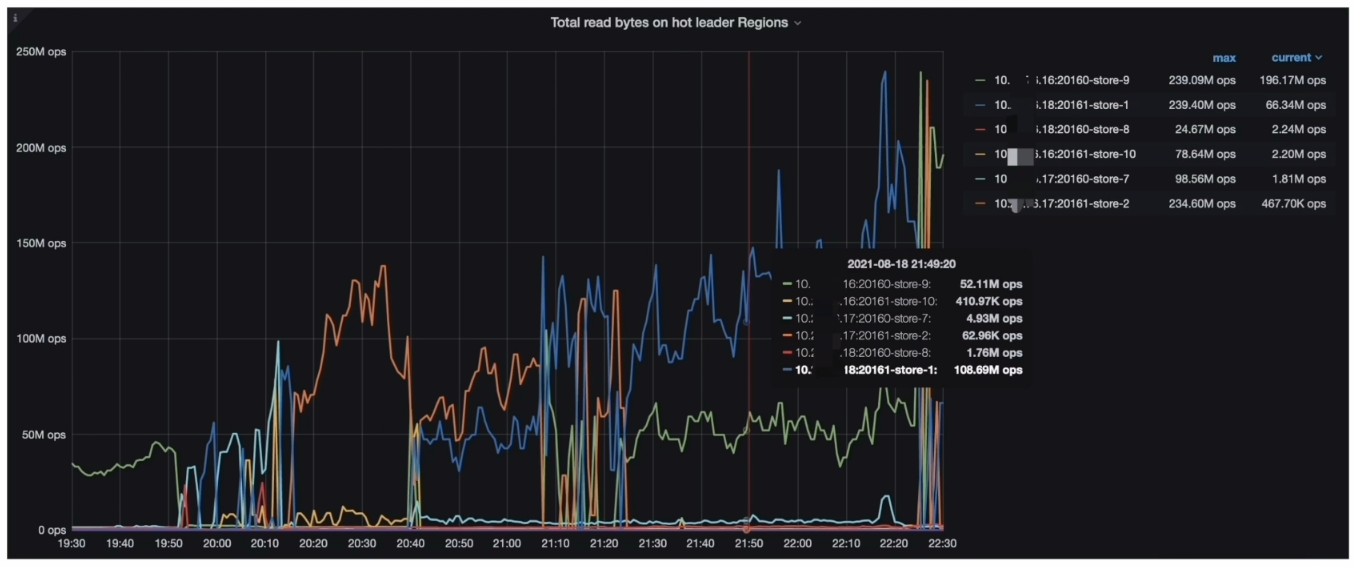
- Grafana --> PD–> Statistics - hot read监控指标(Total read bytes on hot leader Regions )
- Grafana --> PD --> Statistics - hot read 监控指标(( Store read rate bytes )
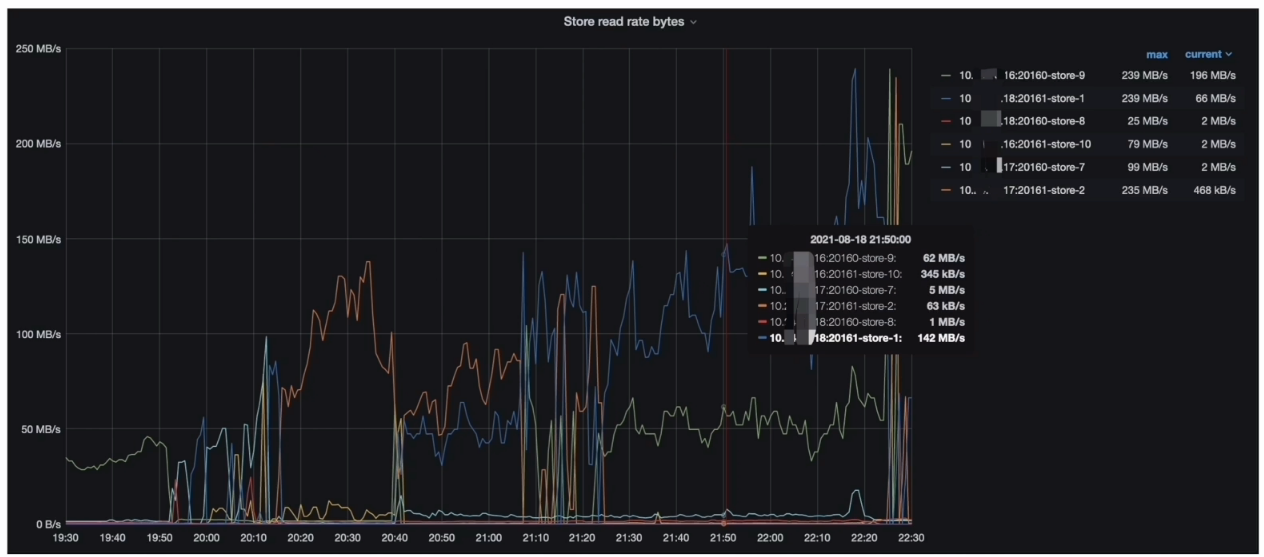
热点排查分析结论
- 分析结论:
- TiDB Dashboard 流量可视化页面读流量部分可以看到比较明显的读热点现象
- PD 监控的 metrics 显示每个 TiKV 会交替出现读热点与 Coprocessor Detail --> 95% Handle duration by store 一致
- 在 gRPC message duration 耗时升高期间,集群有读热点现象
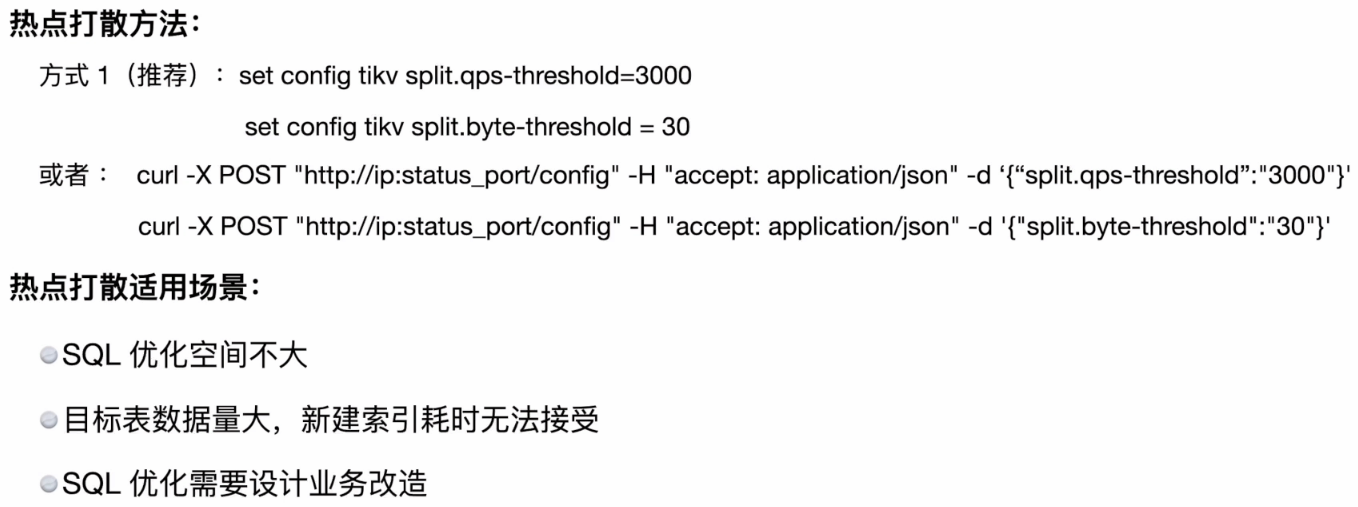
- 解决方案∶
- 打散热点
流程小结
SQL 扫描大量 Key 排查
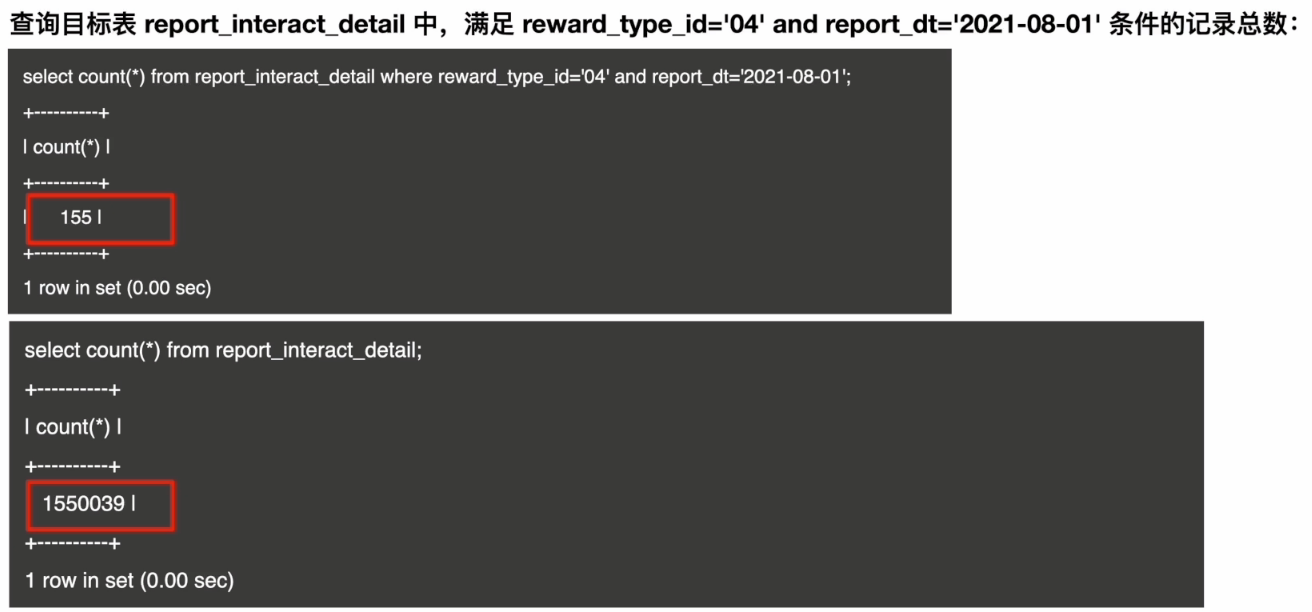
与业务方确认目标表 report_interact_detail 的数据增量情况,业务方反馈,该表的数据写入逻辑为 insert on duplicate,总体趋势是数据会不断追加。
- TiKV-Details --> Coprocessor Detail --> Total Ops Details (Index Scan)
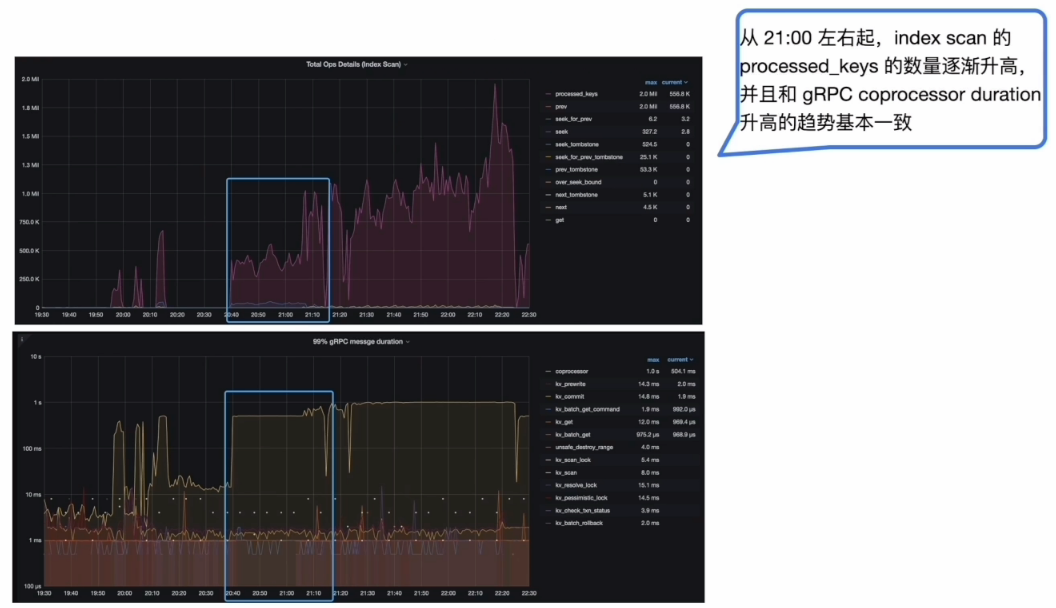
扫描大量 Key 分析结论
- 分析结论:
- Slow query 中 SQL 扫描大量的 key 和目标表数据增量有直接关系
- TiKV-Details 的监控中 gPRC coprocessor duration 和 key 数量呈正相关性
- 解决方案∶
- SQL优化
流程小结

问题原因
- 现象汇总∶
- 19:50~21:00 集群中出现 gRPC coprocessor duration 响应时间升高,并且伴随读热点现象
- 21:00 开始,Coprocessor Total Ops Details (Index Scan) 上涨趋势明显,并且伴随读热点现象
- 根本原因是: SQL 执行过程中扫描大量数据,导致出现热点现象
- report_interact_detail 表的数据量不断增加
- SQL 语句使用的是 Order by winning_create_time DESC,索引扫描使用 create_time 字段上的单列索引,导致 SQL 执行过程中扫描大量的数据,进而出现了读热点现象
排查流程
解决方案