


: https://github.com/prometheus/prometheus是CNCF毕业的项目,是非常流行监控程序,Prometheus属于是典型的有状态应用,而其有包含了一些自身特有的运维管理和配置管理方式。而这些都无法通过Kubernetes原生提供的应用管理概念实现自动化。CoreOS率先引入了Operator的概念,并且首先推出了针对在Kubernetes下运行和管理Etcd的Etcd Operator。并随后推出了Prometheus Operator。用ConfigMap管理Prometheus配置文件。
https://github.com/prometheus-operator/kube-prometheus
而https://github.com/iKubernetes/k8s-prom里面包含了一套完整的配置文件。下面我们开始搭建k8s的监控环境:
1,创建ns
% kubectl apply -f namespace.yamlnamespace/prom created复制
2,创建exporter
% kubectl apply -f node_exporter/daemonset.apps/prometheus-node-exporter createdservice/prometheus-node-exporter created复制
3,启动prometheus
% kubectl apply -f prometheus/configmap/prometheus-config createddeployment.apps/prometheus-server createdWarning: rbac.authorization.k8s.io/v1beta1 ClusterRole is deprecated in v1.17+, unavailable in v1.22+; use rbac.authorization.k8s.io/v1 ClusterRoleclusterrole.rbac.authorization.k8s.io/prometheus createdserviceaccount/prometheus createdWarning: rbac.authorization.k8s.io/v1beta1 ClusterRoleBinding is deprecated in v1.17+, unavailable in v1.22+; use rbac.authorization.k8s.io/v1 ClusterRoleBindingclusterrolebinding.rbac.authorization.k8s.io/prometheus createdservice/prometheus created复制
4,创建k8s的matrix
% kubectl apply -f kube-state-metrics/deployment.apps/kube-state-metrics createdserviceaccount/kube-state-metrics createdclusterrole.rbac.authorization.k8s.io/kube-state-metrics createdclusterrolebinding.rbac.authorization.k8s.io/kube-state-metrics createdservice/kube-state-metrics created复制
访问k8s的资源需要k8s的ssl认证
A,生成serving.key
(umask 077; openssl genrsa -out serving.key 2048)Generating RSA private key, 2048 bit long modulus (2 primes).........................................................+++++..................+++++e is 65537 (0x010001)复制
B,生成serving.csr
%openssl req -new -key serving.key -out serving.csr -subj "/CN=serving"复制
C,生成serving.crt
%openssl x509 -req -in serving.csr -CA ~/Library/Group\ Containers/group.com.docker/pki/apiserver.crt -CAkey ~/Library/Group\ Containers/group.com.docker/pki/apiserver.key -CAcreateserial -out serving.crt -days 3650复制
5,创建secret
% kubectl create secret generic cm-adapter-serving-certs --from-file=serving.crt=./serving.crt --from-file=serving.key -n promsecret/cm-adapter-serving-certs created复制
6,由于k8s的指标并不是直接符合protheus标准需要adapter
$kubectl apply -f k8s-prometheus-adapter复制
7,安装完prometheus后安装grafana
% kubectl apply -f grafana.yamldeployment.apps/monitoring-grafana createdservice/monitoring-grafana created复制
对应的yaml文件
apiVersion: apps/v1kind: Deploymentmetadata:name: monitoring-grafananamespace: prom #修改名称空间spec:replicas: 1selector:matchLabels:task: monitoringk8s-app: grafanatemplate:metadata:labels:task: monitoringk8s-app: grafanaspec:containers:- name: grafanaimage: angelnu/heapster-grafana:v5.0.4ports:- containerPort: 3000protocol: TCPvolumeMounts:- mountPath: etc/ssl/certsname: ca-certificatesreadOnly: true- mountPath: varname: grafana-storageenv: #这里使用的是原先的heapster的grafana的配置文件,需要注释掉这个环境变量#- name: INFLUXDB_HOST# value: monitoring-influxdb- name: GF_SERVER_HTTP_PORTvalue: "3000"# The following env variables are required to make Grafana accessible via# the kubernetes api-server proxy. On production clusters, we recommend# removing these env variables, setup auth for grafana, and expose the grafana# service using a LoadBalancer or a public IP.- name: GF_AUTH_BASIC_ENABLEDvalue: "false"- name: GF_AUTH_ANONYMOUS_ENABLEDvalue: "true"- name: GF_AUTH_ANONYMOUS_ORG_ROLEvalue: Admin- name: GF_SERVER_ROOT_URL# If you're only using the API Server proxy, set this value instead:# value: api/v1/namespaces/kube-system/services/monitoring-grafana/proxyvalue: /volumes:- name: ca-certificateshostPath:path: /etc/ssl/certs- name: grafana-storageemptyDir: {}---apiVersion: v1kind: Servicemetadata:labels:# For use as a Cluster add-on (https://github.com/kubernetes/kubernetes/tree/master/cluster/addons)# If you are NOT using this as an addon, you should comment out this line.kubernetes.io/cluster-service: 'true'kubernetes.io/name: monitoring-grafananame: monitoring-grafananamespace: promspec:# In a production setup, we recommend accessing Grafana through an external Loadbalancer# or through a public IP.# type: LoadBalancer# You could also use NodePort to expose the service at a randomly-generated porttype: NodePortports:- port: 80targetPort: 3000selector:k8s-app: grafana复制
至此我们的基本环境搭建起来了
% kubectl -n prom get svc monitoring-grafanaNAME TYPE CLUSTER-IP EXTERNAL-IP PORT(S) AGEmonitoring-grafana NodePort 10.105.98.11 <none> 80:32649/TCP 8h复制
看下grafana界面
http://127.0.0.1:32649/?orgId=1复制
看下prometheus界面
% kubectl get svc -n promNAME TYPE CLUSTER-IP EXTERNAL-IP PORT(S) AGEcustom-metrics-apiserver ClusterIP 10.96.172.58 <none> 443/TCP 8hkube-state-metrics ClusterIP 10.109.86.171 <none> 8080/TCP 17hmonitoring-grafana NodePort 10.105.98.11 <none> 80:32649/TCP 17hprometheus NodePort 10.103.148.186 <none> 9090:30090/TCP 17hprometheus-node-exporter ClusterIP None <none> 9100/TCP 17h复制
http://127.0.0.1:30090/graph复制
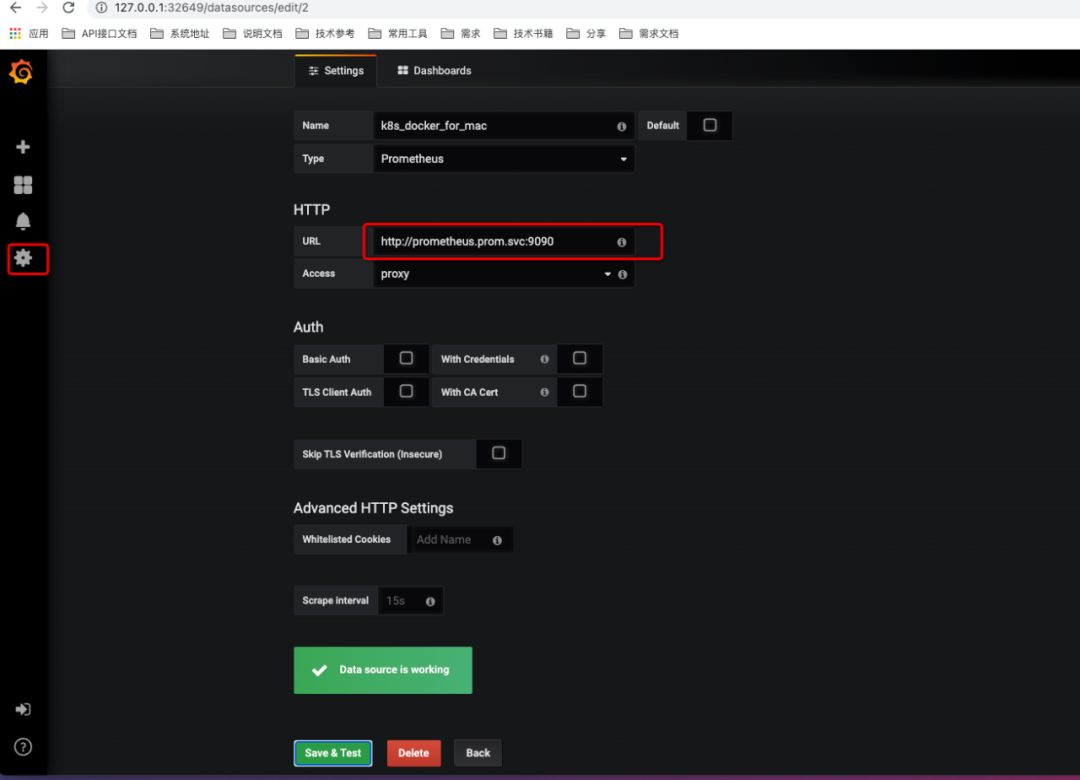
配置相关环境:
1,配置protheus的数据源:
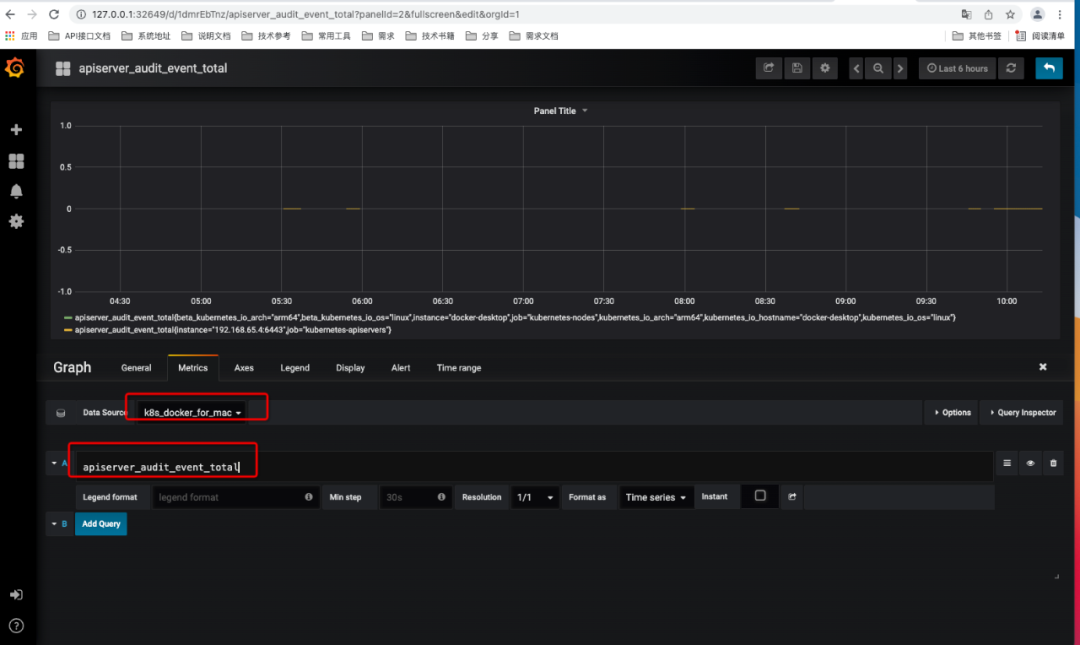
2,在grafana里面查看数据


文章转载自golang算法架构leetcode技术php,如果涉嫌侵权,请发送邮件至:contact@modb.pro进行举报,并提供相关证据,一经查实,墨天轮将立刻删除相关内容。
评论
相关阅读
数据库国产化替代深化:DBA的机遇与挑战
代晓磊
1323次阅读
2025-04-27 16:53:22
2025年4月国产数据库中标情况一览:4个千万元级项目,GaussDB与OceanBase大放异彩!
通讯员
802次阅读
2025-04-30 15:24:06
【活动】分享你的压箱底干货文档,三篇解锁进阶奖励!
墨天轮编辑部
540次阅读
2025-04-17 17:02:24
一页概览:Oracle GoldenGate
甲骨文云技术
505次阅读
2025-04-30 12:17:56
GoldenDB数据库v7.2焕新发布,助力全行业数据库平滑替代
GoldenDB分布式数据库
482次阅读
2025-04-30 12:17:50
优炫数据库成功入围新疆维吾尔自治区行政事业单位数据库2025年框架协议采购!
优炫软件
369次阅读
2025-04-18 10:01:22
给准备学习国产数据库的朋友几点建议
白鳝的洞穴
355次阅读
2025-05-07 10:06:14
XCOPS广州站:从开源自研之争到AI驱动的下一代数据库架构探索
韩锋频道
320次阅读
2025-04-29 10:35:54
MySQL 30 周年庆!MySQL 8.4 认证免费考!这次是认真的。。。
数据库运维之道
302次阅读
2025-04-28 11:01:25
国产数据库图谱又上新|82篇精选内容全览达梦数据库
墨天轮编辑部
289次阅读
2025-04-23 12:04:21
