


Tidb-正确的修改TiDB Prometheus的监控阈值
如果因为某些原因,你想修改TiDB Prometheus的某项监控阈值,应为它有时候实在太能报警了,那么应该好好的避避坑。
我就是因为之前已经修改完的一个阈值,最近在一次变更后开始频繁的告警,莫名其妙的恢复原样了。
1.确认需要修改的文件
- 确认是否有配置了rule_dir
tidb部署时,如果monitoring_servers位置了rule_dir参数,那么每次在集群进行 deploy/scale-out/scale-in/reload 操作时, TiUP 将读取rule_dir 指定的本机路径下的自定义rule,scp的方式替换conf目录中默认配置规则。
这是一个大坑,应该要避免:
tiup 命令查看集群配置: [tidb@mytidb ~]$ tiup cluster edit-config lcpool ...... ... monitoring_servers: - host: 10.10.10.11 ssh_port: 22 port: 9690 deploy_dir: /data/tidb/monitor/tidb-deploy/prometheus-9690 data_dir: /data/tidb/monitor/tidb-data/prometheus-9690 log_dir: /data/tidb/monitor/tidb-deploy/prometheus-9690/log external_alertmanagers: [] arch: amd64 os: linux rule_dir: /data/tidb/monitor/tidb-deploy/prometheus-9690/conf-0610 - host: 10.10.10.12 ssh_port: 22 port: 9690 deploy_dir: /data/tidb/monitor/tidb-deploy/prometheus-9690 data_dir: /data/tidb/monitor/tidb-data/prometheus-9690 log_dir: /data/tidb/monitor/tidb-deploy/prometheus-9690/log external_alertmanagers: [] arch: amd64 os: linux rule_dir: /data/tidb/monitor/tidb-deploy/prometheus-9690/conf-0610 - host: 10.10.10.13 ssh_port: 22 port: 9690 deploy_dir: /data/tidb/monitor/tidb-deploy/prometheus-9690 data_dir: /data/tidb/monitor/tidb-data/prometheus-9690 log_dir: /data/tidb/monitor/tidb-deploy/prometheus-9690/log external_alertmanagers: [] arch: amd64 os: linux rule_dir: /data/tidb/monitor/tidb-deploy/prometheus-9690/conf-0610 ...... ...复制
可以看到我们这个集群配置了3个prometheus监控,而且使用了“rule_dir: /data/tidb/monitor/tidb-deploy/prometheus-9690/conf-0610” 参数配置,也就是说如果我们每次执行 tiup cluster deploy/scale-out/scale-in/reload 命令时,tidb会将这个目录里面的配置文件scp到/data/tidb/monitor/tidb-deploy/prometheus-9690/conf 目录中,进行替换。如果在变更时我们仅仅修改了conf目录中的配置文件,那么就会在不久将来的某次变更中,发现莫名其妙的恢复到了历史的监控阈值。
如果还是不直观大家可以看我的目录结构:
/data/tidb/monitor/tidb-deploy/prometheus-9690/conf-0610 rule_dir 配置的目录指向 /data/tidb/monitor/tidb-deploy/prometheus-9690/conf prometheus真正运行时使用的配置文件目录复制
rule_dir配置的目录,只需要你执行tiup命令的那个节点具有即可,不需要每个节点都具有,因为它是通过scp的方式分发到每个节点的。复制
- 修改conf目录配置
定位我确实配置了rule_dir参数后,那么在修改某些告警指标时,最保险的把办法就是把三个节点的conf目录中配置文件以及执行tiup节点的conf-0610目录中的配置文件均做修改
三个节点执行: cd /data/tidb/monitor/tidb-deploy/prometheus-9690/conf/ cp tikv.rules.yml tikv.rules.yml.bak vim tikv.rules.yml --修改前: - alert: TiKV_scheduler_latch_wait_duration_seconds expr: histogram_quantile(0.99, sum(rate(tikv_scheduler_latch_wait_duration_seconds_bucket[1m])) by (le, instance, type)) > 1 expr: histogram_quantile(0.99, sum(rate(tikv_scheduler_latch_wait_duration_seconds_bucket[1m])) by (le, instance, type)) > 1 summary: TiKV scheduler latch wait duration seconds more than 1s --修改后: - alert: TiKV_scheduler_latch_wait_duration_seconds expr: histogram_quantile(1, sum(rate(tikv_scheduler_latch_wait_duration_seconds_bucket[1m])) by (le, instance, type)) > 0.4 expr: histogram_quantile(1, sum(rate(tikv_scheduler_latch_wait_duration_seconds_bucket[1m])) by (le, instance, type)) > 0.4 summary: TiKV scheduler latch wait duration seconds more than 0.4s tiup所在节点执行: cd /data/tidb/monitor/tidb-deploy/prometheus-9690/conf-0610/ cp tikv.rules.yml tikv.rules.yml.bak vim tikv.rules.yml --修改前: - alert: TiKV_scheduler_latch_wait_duration_seconds expr: histogram_quantile(0.99, sum(rate(tikv_scheduler_latch_wait_duration_seconds_bucket[1m])) by (le, instance, type)) > 1 expr: histogram_quantile(0.99, sum(rate(tikv_scheduler_latch_wait_duration_seconds_bucket[1m])) by (le, instance, type)) > 1 summary: TiKV scheduler latch wait duration seconds more than 1s --修改后: - alert: TiKV_scheduler_latch_wait_duration_seconds expr: histogram_quantile(1, sum(rate(tikv_scheduler_latch_wait_duration_seconds_bucket[1m])) by (le, instance, type)) > 0.4 expr: histogram_quantile(1, sum(rate(tikv_scheduler_latch_wait_duration_seconds_bucket[1m])) by (le, instance, type)) > 0.4 summary: TiKV scheduler latch wait duration seconds more than 0.4s复制
2.修改后重启进程
修改完后每个节点执行,并不需要restart 服务 sudo systemctl daemon-reload && systemctl reload prometheus-9690.service复制
重启完可以登录promethues接口查看修改配置
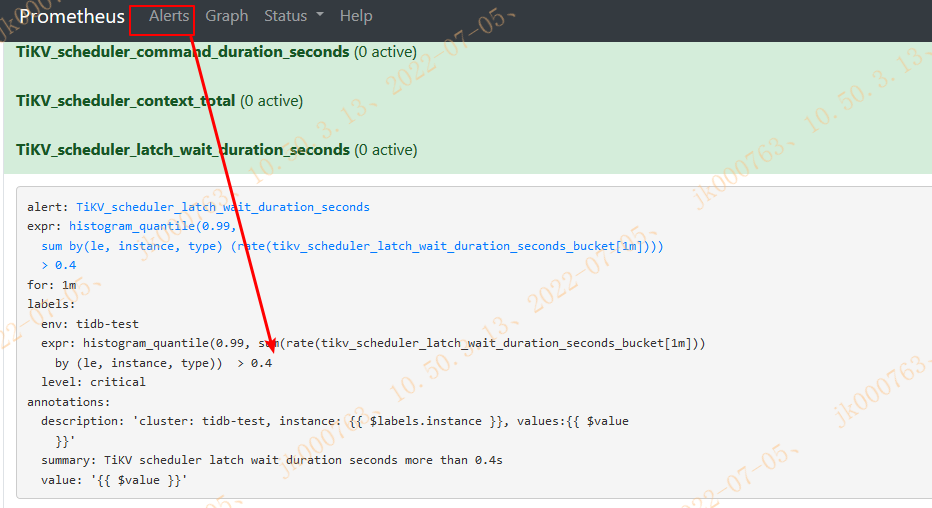
修改成功后如上图。
这里还有一个坑,如果没有配置rule_dir会怎么办呢?
我另外做了一个测试:
如果没有配置rule_dir,tidb会从/tidb/monitor/tidb-deploy/prometheus-9090/bin/prometheus目录下copy文件到/tidb/monitor/tidb-deploy/prometheus-9090/conf。做其他变更前一定要做好prometheus-9090/conf目录备份,要不会替换回去了,之前的变更都被覆盖了。
我执行了一个命令: tiup cluster reload tidb-test -R tikv tiup日志输出: 2022-07-05T15:22:36.287+0800 INFO CheckPoint {"host": "10.10.10.11", "port": 22, "user": "tidb", "sudo": false, "cmd": "mkdir -p /tidb/monitor/tidb-deploy/prometheus-9090/conf && find /tidb/monitor/tidb-deploy/prometheus-9090/conf -type f -name \"*.rules.yml\" -delete && find /tidb/monitor/tidb-deploy/prometheus-9090/bin/prometheus -maxdepth 1 -type f -name \"*.rules.yml\" -exec cp {} /tidb/monitor/tidb-deploy/prometheus-9090/conf/ \\; && find /tidb/monitor/tidb-deploy/prometheus-9090/conf -maxdepth 1 -type f -name \"*.rules.yml\" -exec sed -i -e \"s/ENV_LABELS_ENV/tidb-mytidb/g\" {} \\;", "stdout": "", "stderr": "", "__hash__": "68edc581eb12860f150abf89b72c26497d056578", "__func__": "github.com/pingcap/tiup/pkg/cluster/executor.(*CheckPointExecutor).Execute", "hit": false}复制
可以看到日志被替换了,此时由于prometheus没有重启,所以不会立即生效。那么就会等待你下次的操作,触发它生效。所以我觉得还不如配置rule_dir,那只需修改这个参数指定路径下的文件,并保证这个文件是最新的就行
3.官方对自定义 Prometheus 配置的描述
目前,TiUP 支持自定义 Prometheus 的 rule 配置和 scrape 配置。
- 自定义 Prometheus rule
- 将自定义的 rule 配置文件放到 TiUP 所在机器的某个目录下。
- 在 TiDB 集群的拓扑配置 topology.yaml 文件中,将自定义规则文件目录 rule_dir 设置为实际 rule 配置文件的目录。
以下为 topology.yaml 文件中的 monitoring_servers 配置示例:
# # Server configs are used to specify the configuration of Prometheus Server.
monitoring_servers:
  # # The ip address of the Monitoring Server.
  - host: 127.0.0.1
    rule_dir: /home/tidb/prometheus_rule   # prometheus rule dir on TiUP machine
复制
上述配置后,在集群进行 deploy/scale-out/scale-in/reload 操作时, TiUP 将读取本机 /home/tidb/prometheus_rule 路径下的自定义 rule,然后将该配置发送到 Prometheus Server, 替换默认配置规则。


