


监视 PostgreSQL 灵活服务器的连接模式、错误、断开连接、连接向下钻取或其持续时间并不是一个简单的过程。 本博客的目的是指导您如何使用 ARM 模板部署仪表板,该模板将向您展示 Azure Database for PostgreSQL 灵活服务器的连接见解。 我还将解释图表和表格的含义,以及如何解释数据以进行故障排除或监控。

提供的 ARM 模板包含多个 Kusto 查询,这些查询利用 Azure Monitor 日志在服务器日志中搜索与连接相关的信息。在如何部署连接仪表板一章中,您可以在几分钟内完成部署仪表板所需的所有步骤。在部署实际的仪表板之前,请确保您首先配置了仪表板所需的先决条件一章中描述的要求。
部署仪表板后,为了更好地理解如何解释图表,请遵循如何使用仪表板和了解其指标一章
在上一章中,您可以看到仪表板后台使用的所有 Kusto 查询。如果您想进一步自定义它或根据您的用例进行调整,可以直接在 Azure Monitor 日志中使用查询。
仪表板所需的先决条件
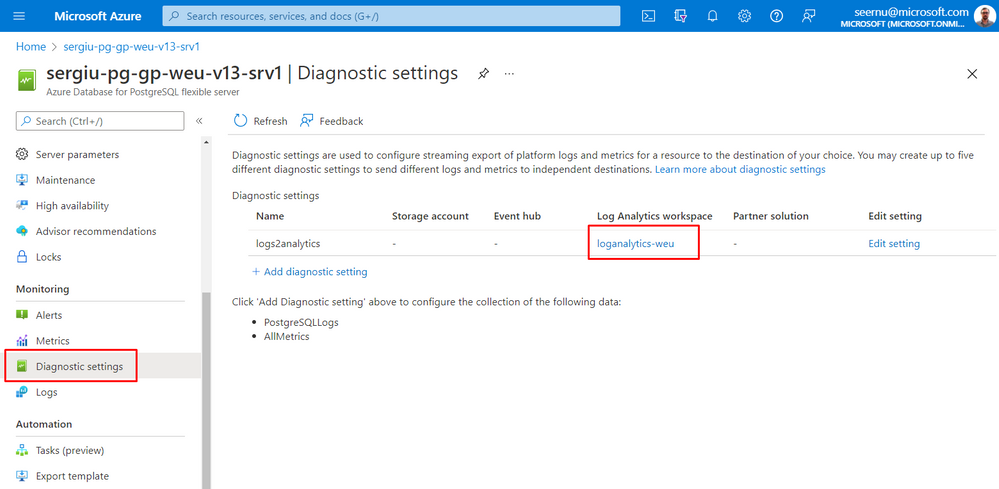
- 在仪表板后台运行的 Kusto 查询依赖于 Azure Monitor 日志,因此您需要从 PostgreSQL 刀片配置诊断设置,以将 PostgreSQL 服务器日志发送到 Azure Log Analytics 工作区。有关更多详细信息,请参阅如何在 Azure Database for PostgreSQL 灵活服务器中设置 Azure Monitor 诊断设置。配置诊断设置后,您应该会看到类似的图片,如下所示:
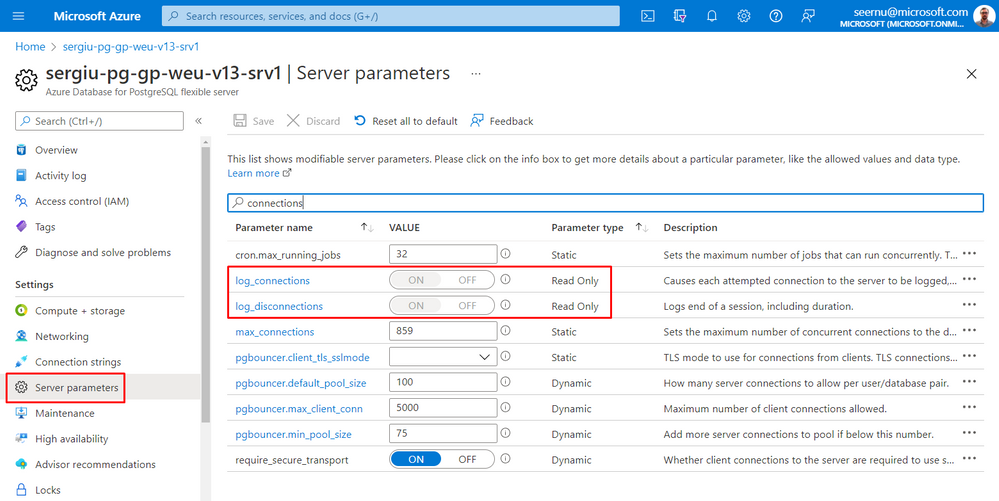
- 要在服务器日志中发出与连接和断开相关的相应消息,参数 log_connections 和 log_disconnections 必须设置为 ON。 默认情况下,这些参数应该已经具有这些值并且是只读的。
如何部署连接仪表板
为了为 PostgreSQL 灵活服务器部署连接仪表板,请使用以下基于 PostgreSQL 版本的 ARM 模板之一:
- ConnectivityDashboardPostgresqlFlexibleServerTemplate.json 用于 PostgreSQL 版本大于 11
- ConnectivityDashboardPostgreSQLv11FlexibleServerTemplate.json 仅适用于 PostgreSQL 版本 11
如果您直接跳到本章,请确保您在部署仪表板之前已遵循上一章仪表板所需的先决条件中描述的先决条件。
按照以下步骤部署仪表板:
-
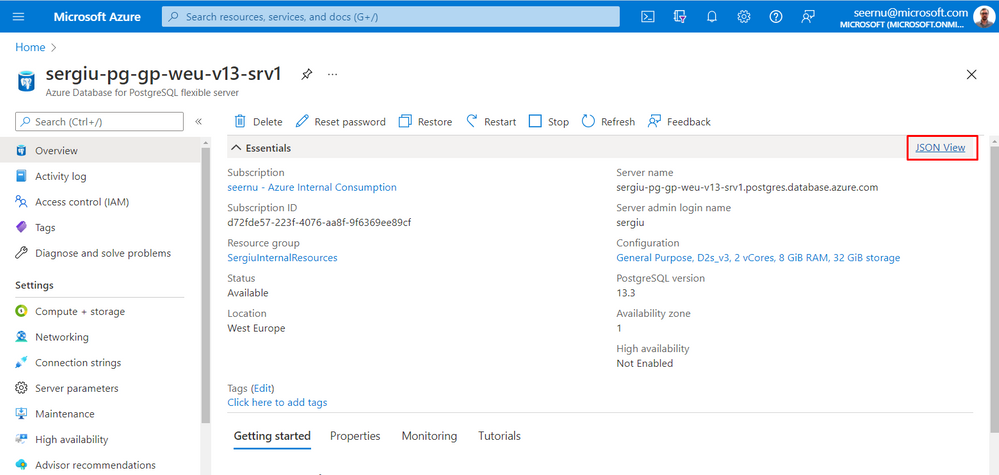
获取要为其创建仪表板的 Azure Database for PostgreSQL 灵活服务器的资源 URI。
a.从 Azure 门户中的 PostgreSQL 服务器刀片单击 JSON 视图。
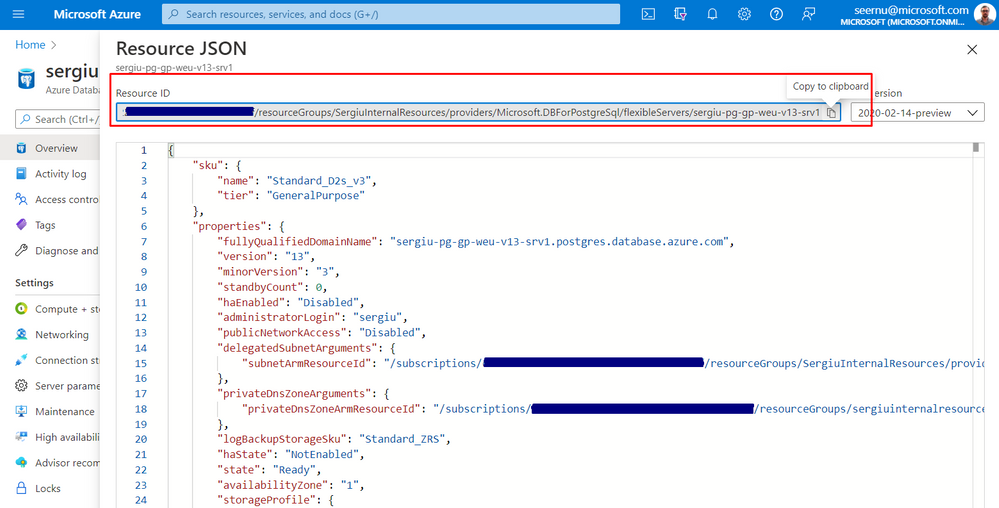
b.复制资源 ID,如下所示
-
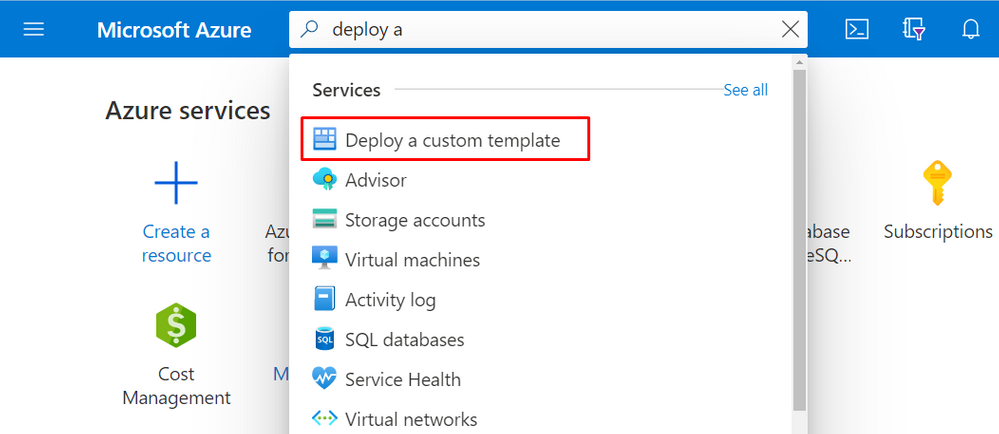
从 Azure 门户搜索并单击“部署自定义模板”
-
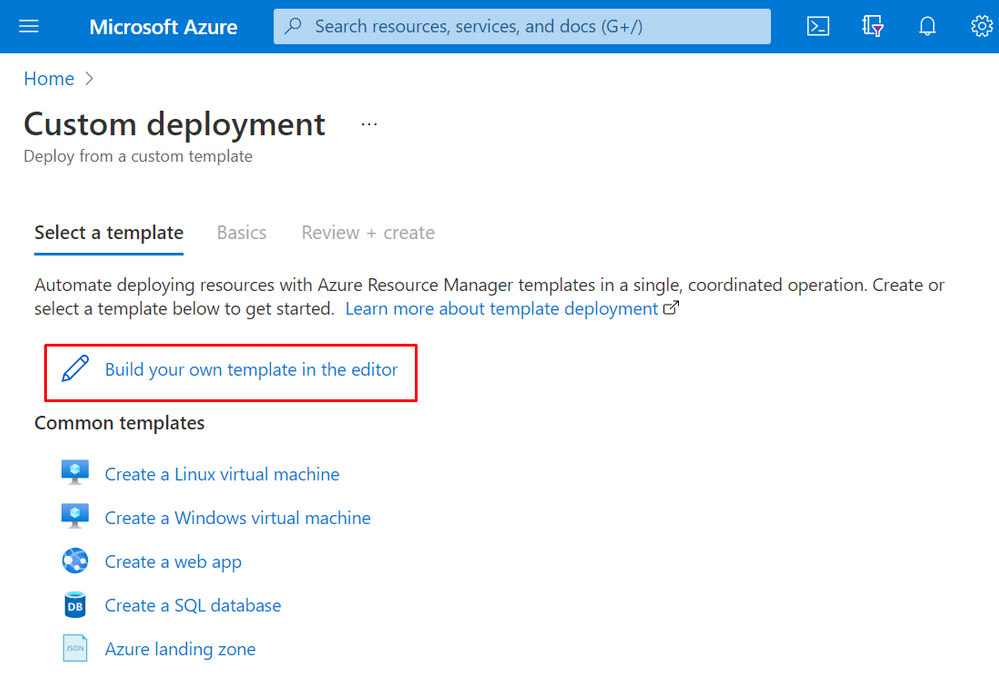
点击“在编辑器中构建您自己的模板”
-
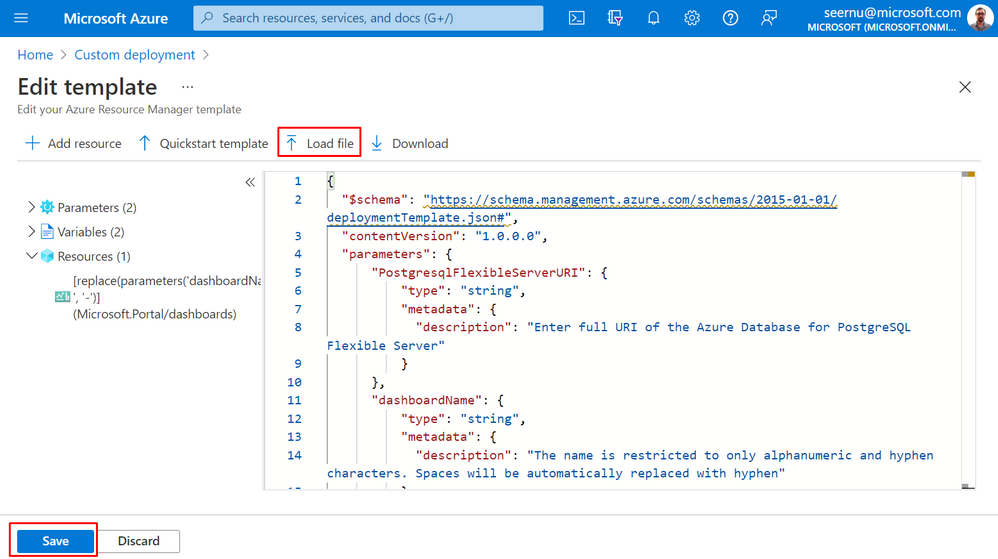
根据 PostgreSQL 版本使用适当的 ARM 模板。 如果您下载了 ARM 模板,请单击“加载文件”并上传。 或者,您可以将 ARM 模板内容复制并粘贴到输入文本区域字段中。 然后按屏幕左下角的“保存”按钮。
-
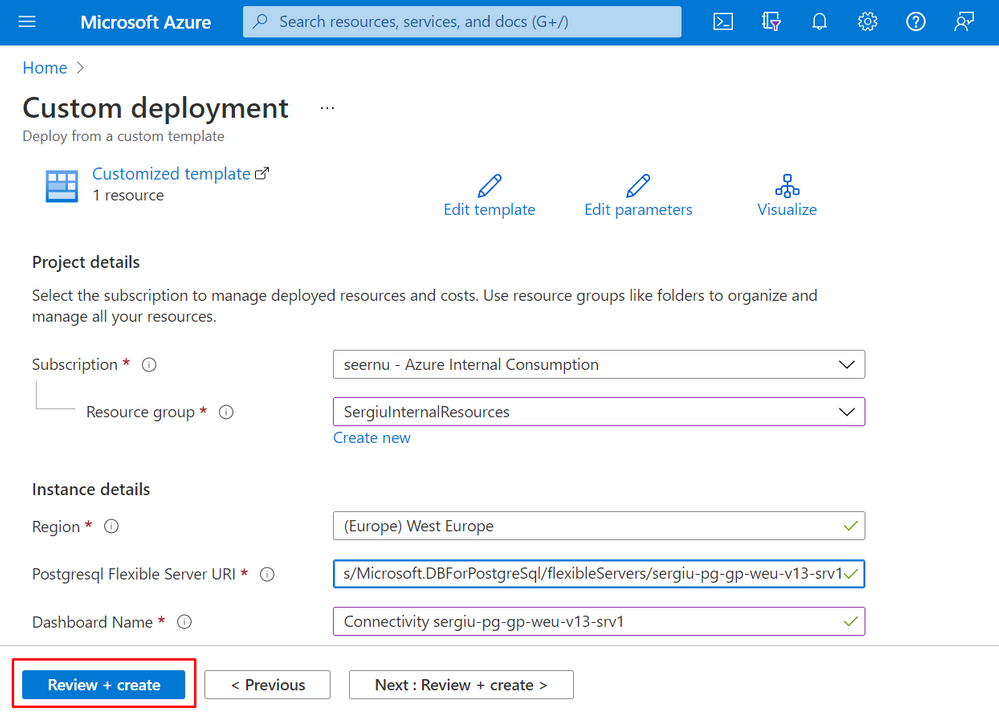
如下所示填写必填字段。 然后按“查看+创建”按钮。
a.选择将在其中部署仪表板的资源组
b.使用在本教程的步骤 1 中检索到的资源 ID 提供“Postgresql 灵活服务器 URI”。
c.输入“仪表板名称”。 请注意,名称仅限于字母数字和连字符。 ARM 模板将自动用连字符替换空格。
-
验证通过后按“创建”按钮。
-
部署完成后按“转到资源”。 从资源中按“转到仪表板”链接以查看新部署的仪表板。
如何使用仪表板并了解其指标
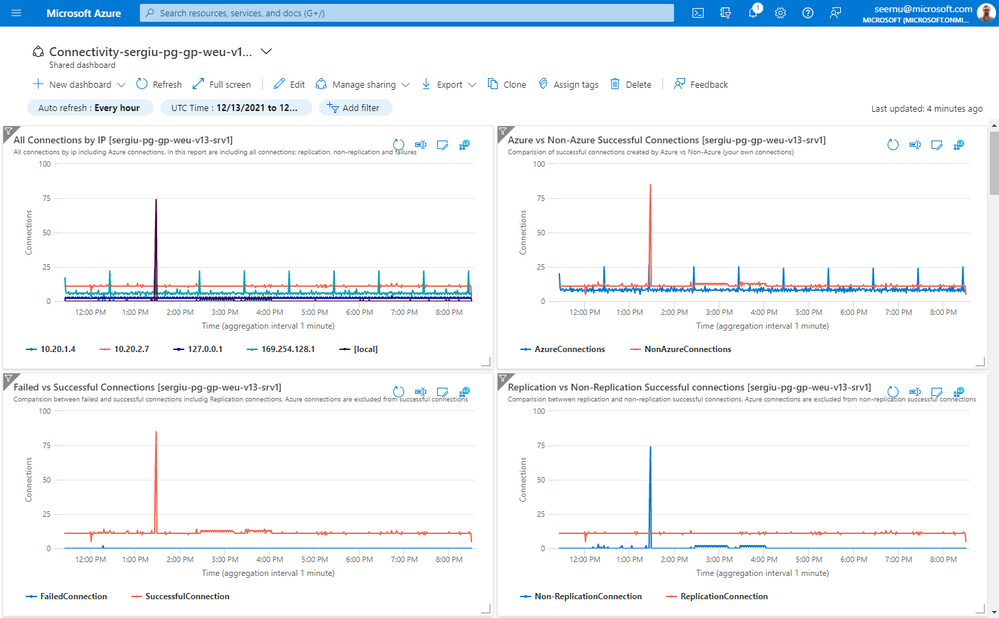
仪表板本身的结构以 3 种主要方式呈现所有见解:
1. 图表中显示的数据
所有图表的数据都汇总在一个自适应聚合上,该聚合基于 Azure UI 中所选时间范围的结果集,如下所示:
a.如果结果时间范围小于或等于 12 小时,则数据汇总为 1 分钟聚合。
b.如果结果时间范围大于 12 小时但小于或等于 24 小时,则数据汇总为 5 分钟聚合。
c.如果结果时间范围大于 24 小时但小于或等于 48 小时,则数据汇总为 10 分钟聚合。
d.如果结果时间范围大于 48 小时但小于或等于 7 天,则数据汇总为 30 分钟聚合。
e.对于任何产生的时间范围大于 7 天,数据将汇总为 1 小时聚合。
2. 数据汇总
在 Azure UI 中选择的整个时间范围内,所有连接汇总表都会汇总。
3. 连接洞察列表
列表将在 Azure UI 中选择的整个时间范围内按降序显示所有相应的数据,其中包括 IP、事件的确切时间、PID 和相应的用户、数据库/应用程序名称或错误消息。
因为仪表板在每个小部件标题中包含多个图表,所以会自动显示服务器的名称,以防您同时使用多个仪表板来监控多个服务器的连接。
了解图表。
- 按 IP 向下钻取连接
在“按 IP 的所有连接”图表中,按 IP 显示所有连接,包括 Azure 内部连接。此图表有助于了解从哪个 IP 建立到您的 PostgreSQL 灵活服务器的连接。
- 成功的 Azure 连接与非 Azure 连接之间的比较
由于 Azure Database for PostgreSQL 灵活服务器是一项托管服务,因此 Azure 连接到您的服务器以进行监视和管理。要区分 Azure 创建的成功连接和您自己的连接,此图表非常有用。
- 失败和成功连接之间的比较
此图表有助于了解连接模式,特别是识别失败的连接时间。成功的连接将排除 azure 连接,因此它将是您自己连接的准确图片。此外,成功的连接包括常规连接和复制连接。尽管如此,在启用 HA 的情况下,热备用的复制连接也包括在内,但可能被视为天蓝色连接。
- 复制与非复制连接
该图表表示成功的复制连接和常规连接之间的比较。 Azure 连接不包括在内,因此该图表仅代表您的连接。如果启用了 HA,则以类似的方式从热备用复制连接也包括在内。
- 按用户或数据库向下钻取的成功连接
这 2 个图表将按用户或数据库表示您自己的常规连接的摘要,有助于了解连接模式,尤其是哪些用户创建了大多数连接或哪些数据库最常使用。在这些图表中,您身边的复制连接和 Azure 连接被排除在外。
- 按用户或应用程序名称向下钻取的成功复制连接
这 2 个图表将按用户或 application_name 表示复制连接的摘要,并且有助于根据创建这些连接的用户或 application_name 了解复制连接的模式。您还可以了解创建这些复制连接时的数量和时间模式。
- 连接生命周期明细
此图表将指示连接的持续时间模式。提供的数据取自断开连接的时刻,并按持续时间分为 3 类,如下所示:
- 短期连接是在不到 1 分钟的时间内断开的连接。
- 正常连接是生命周期在 1 分钟到 20 分钟之间的连接。
- 长寿命连接是寿命超过 20 分钟的连接。
此图表对于了解您的连接的生命周期非常有用,为了获得更好的性能,我们建议避免短期连接。 Azure 断开连接被排除在外,但它将包括所有常规连接和复制连接。另一个必须考虑的重要事项是连接失败也会发出断开连接消息,因此包含在图表中,并且由于此类连接的持续时间为几秒钟,连接失败将被报告为短暂连接。
- 以 IP 为单位的平均连接持续时间(以秒为单位)
如果使用之前的图表“连接生命周期明细”,您可以了解持续时间模式,使用此图表您可以深入了解基于 IP 的连接的平均持续时间(以秒为单位)。平均持续时间是根据 Azure UI 中所选时间范围的结果集在自适应聚合上计算的。因此,出于故障排除的目的,建议选择一个较窄的时间范围,最好少于 12 小时,以获得 1 分钟聚合的平均值。图表的聚合时间在本章开头进行了说明。如果持续时间为 0(零),则表示在该特定时间没有与相应 IP 断开连接。该图表本身主要用于查看来自哪个 IP 的平均持续时间较小或检测连接持续时间的下降,这可能表明存在一些问题。
- SQL 错误代码的连接错误
图表根据 SQL 错误码表示连接失败的汇总,您可以了解连接失败的原因和数量。错误码可能意义不大,这是可以理解的,但是如果将此图表与连接失败摘要表结合使用,则在该表中您可以看到与SQL错误码对应的实际错误消息。
- IP 连接错误
该图表表示基于 IP 的连接失败摘要,将帮助您了解连接失败源自哪个 IP。
了解汇总表。
- 按 IP 列出的新连接摘要
它将代表在 Azure UI 的选定时间范围内在您的 PostgreSQL 灵活服务器上创建的所有连接(包括 Azure 连接)的摘要。呈现的数据按 IP 分组,并将报告由 Counter 表示的连接总数以及时间范围内的第一个和最后一个连接。
- Azure 成功连接摘要
出于透明原因,您可以使用此表查看 Azure 创建的所有成功连接。呈现的数据按 IP、用户和数据库分组,并将报告由 Count 表示的连接总数以及时间范围内的第一个和最后一个连接。
- 成功连接总结
此表将表示在选定时间范围内从 Azure UI 创建的所有成功连接的摘要。不包括复制和 Azure 成功连接。数据按 IP、用户和数据库分组,因此您可以了解每对(IP、用户、数据库)在时间范围内由 Count 表示的连接总数。
- 复制连接摘要
此表将仅表示在 Azure UI 的选定时间范围内创建的复制连接的摘要。数据按 IP 和 application_name 分组,您可以使用摘要来了解时间范围内由 Count 表示的复制连接总数。
- 断线总结
该表将表示所选时间范围内与 Azure UI 的所有断开连接的摘要。摘要包括成功和失败连接的断开连接,但不包括 Azure 断开连接。成功的连接包括两种类型:复制和常规连接。数据按 IP、用户和数据库分组。因此,对于每对(IP、用户和数据库),报告的断开连接总数由 Count 表示,遇到的最小持续时间(以秒为单位)由 minDurationSec 表示,遇到的最大持续时间(以秒为单位)由 maxDurationSec 表示,平均连接持续时间(以秒为单位)表示通过 AvgDurationSec 表示 FirstDisconnection 和 LastDisconnection 之间的时间窗口。
- 所有失败登录的摘要
这里的数据按IP、错误信息和SqlErrorCode分组,其中Count代表时间范围内的失败总数。此表中提供的 SqlErrorCode 可用于将错误消息与表示 SQL 错误代码的连接失败的图表进行映射。
了解清单表。
- 所有成功的连接
此表将包括所有成功的连接。 Azure 和复制连接被排除在外。数据将呈现每个连接的 IP、用户、数据库、ConnRecvTime、ConnAuthTime、SetupTime 和 PID。 ConnRecvTime 是连接接收时间,ConnAuthTime 是身份验证过程完成并建立连接的时间。 ConnSetupTime 是建立连接所花费的时间量:ConnSetupTime – ConnRecvTime。
- 所有复制连接
此表将包括所有复制连接。数据将显示每个复制连接的 IP、用户、应用程序名称、ConnRecvTime、ConnAuthTime、ConnSetupTime 和 PID。与上表 ConnRecvTime 一样,ConnAuthTime 和 ConnSetupTime 具有相同的含义。
- 所有断开连接
此表将包括所有连接类型的所有断开连接,包括失败,而 Azure 断开连接不包括在内。数据将显示每次断开连接的 IP、用户、数据库、DisconnectTime、持续时间、DurationInSec 和 PID。 DisconnectTime 是相应连接断开的时间。持续时间是记录在服务器日志中的持续时间字符串,而 DurationInSec 是以秒为单位的持续时间字符串的转换,以便更好地理解。
- 所有登录失败
此表将包括所有登录失败。每次登录失败的数据将显示 IP、ErrorMessage、SqlErrorCode、ConnectTime、AuthFailedTime、ConnSetupTime 和 PID。 ErrorMessage 是失败的错误,SqlErrorCode 是相应消息的相应 PostgreSQL 错误代码。 ConnecTime 是接收到连接的时间,而 AuthFailedTime 是认证失败并返回错误的时间。 ConnSetupTime 分别是从建立连接到失败所用的时间,换句话说:AuthFailedTime – ConnSetupTime。
对 PostgreSQL 版本的限制。
PostgreSQL v11 不会在服务器日志中发出用于复制连接的 application_name。出于这个原因,专门为 PostgreSQL v11 提供了一个单独的 ARM 模板,该模板不包括图表“应用程序名称的复制连接”,并且在“复制连接摘要”和“所有复制连接”表中,应用程序名称不包括在内。
仪表板的进一步定制。
仪表板旨在捕获所有连接类型,但是,例如,如果您没有复制连接,则可以编辑仪表板并通过单击小部件右上角的“…”符号删除相应的小部件,然后单击“从仪表板中删除”。以类似的方式,如果您想减少图表或表格的数量,您也可以删除它们。之后,您可以根据自己的喜好或屏幕分辨率重新排列小部件。
注意事项。
在某些极端情况下,相同的连接 PID 可以同时报告为成功和失败的连接。 例如,以下登录失败可能会发生这种情况:
数据库“xxxx”不存在
解释是连接到 PostgreSQL 服务器的用户的身份验证成功完成,并发出了相应的日志消息。 此外,由于已建立连接的数据库不存在,因此发出相应的致命错误并终止连接。 然而,在这种情况下,成功发出连接不是问题,因为主要目的是检测失败的原因并采取适当的措施。
仪表板中使用的 Kusto 查询语言 (KQL)
在本节中,您将找到在后台使用的所有 Kusto 查询。 正如已经对图表解释的那样,将使用基于 Azure UI 中所选时间范围的结果集的自适应聚合。 这是使用以下代码完成的:
let TimeRange = endtime - starttime;
let Intervals = iff(
    TimeRange <= 12h, 1m,
        iff(TimeRange <= 24h, 5m,
            iff(TimeRange <= 48h, 10m,
                iff(TimeRange <= 7d, 30m,1h)
            )
        )
);
图表数据使用make-series函数显示,其中 step 是上面计算的自适应间隔“Intervals”。 缺失点(在该特定时间间隔内没有记录数据)将填充零值。 由于 make-series 函数需要开始和结束时间,因此始终在每个 Kusto 查询中计算这些值,以便能够与 UI 中的 Azure 时间范围选择器集成。
由于服务器可以停止,或者有时 Azure UI 中的选定时间间隔可能没有记录,因此开始和结束时间可能为空。 此行为将导致错误,因为 make-series 运行的 bin() 函数不能在空值上运行。 为了克服这个问题,对于这种情况,它将使用一个虚拟的开始和结束时间:
let dummystart=datetime('2000-01-01 00:00');
let dummyend=datetime('2000-01-01 00:01');
…
| extend mintime=iff(isnotempty(xmintime), xmintime, dummystart)
| extend maxtime=iff(isnotempty(xmaxtime), xmaxtime, dummyend)
为了清楚地表明哪个时间间隔用于聚合,它将绘制在每个图表的图例中。 这是使用以下代码完成的:
let IntervalStr=iff (
    Intervals==1m,"1 minute",
        iff (Intervals==5m, "5 minutes",
            iff (Intervals==10m, "10 minutes",
                iff (Intervals==30m, "30 minutes", "1 hour")
            )
        )
);
…
| render timechart with ( xtitle=strcat("Time (aggregation interval ",IntervalStr,")") )
图表:IP 的所有连接
Kusto 查询在服务器日志中搜索类型为“已收到连接”的消息,该消息表示 PostgreSQL 日志中每个连接的条目。 使用正则表达式,从日志条目中提取 IP:IP=extract(@‘host=(.\S+)’, 1, Message)。 它使用 count() 函数来总结来自给定 Ip 的所有连接。 此查询将绘制一个图表,其中包含创建与 PostgreSQL 灵活服务器的连接(包括 Azure 内部连接)的所有 Ips。
//All new connections (including replication and azure internal connections) regardless of failed or successful by Ip
let dummystart=datetime('2000-01-01 00:00');
let dummyend=datetime('2000-01-01 00:01');
let AllConnections=AzureDiagnostics
| where ResourceProvider =="MICROSOFT.DBFORPOSTGRESQL"
| where Category == "PostgreSQLLogs"
| where Message contains "connection received"
| extend RealTime=todatetime(timestamp_s);
let starttime=toscalar(
    AllConnections
    | summarize mintime=min(RealTime)
    | project xmintime=bin(mintime, 1m)
    | extend mintime=iff(isnotempty(xmintime), xmintime, dummystart)
    | project mintime
);
let endtime=toscalar(
    AllConnections
    | summarize xmaxtime=max(RealTime)
    | extend maxtime=iff(isnotempty(xmaxtime), xmaxtime, dummyend)
    | project maxtime
);
let TimeRange = endtime - starttime;
let Intervals = iff(
    TimeRange <= 12h, 1m,
        iff(TimeRange <= 24h, 5m,
            iff(TimeRange <= 48h, 10m,
                iff(TimeRange <= 7d, 30m,1h)
            )
        )
);
let IntervalStr=iff (
    Intervals==1m,"1 minute",
        iff (Intervals==5m, "5 minutes",
            iff (Intervals==10m, "10 minutes",
                iff (Intervals==30m, "30 minutes", "1 hour")
            )
        )
);
AllConnections
| extend IP=extract(@'host=(.\S+)', 1, Message)
| make-series Connections=count() default=0 on RealTime from starttime to endtime step Intervals by IP
| render timechart with ( xtitle=strcat("Time (aggregation interval ",IntervalStr,")") )
图表:Azure 与非 Azure 成功连接
Kusto 查询在服务器日志中搜索“连接授权”类型的消息,表示 PostgreSQL 日志中的成功连接条目。 使用正则表达式从日志条目中提取用户和数据库:extract_all(@‘user=(.+)database=(.\S+)’, Message)。 如果用户是“azuresu”,则连接标记为 Azure 连接,否则标记为非 Azure 连接。 最后使用 count() 函数来总结区间中的所有连接。 此查询将绘制一个图表,比较 Azure 与非 Azure 创建的成功连接(您自己的连接)。
//Successful Azure vs NonAzure Connections
let dummystart=datetime('2000-01-01 00:00');
let dummyend=datetime('2000-01-01 00:01');
let SuccessConn=AzureDiagnostics
| where ResourceProvider =="MICROSOFT.DBFORPOSTGRESQL"
| where Category == "PostgreSQLLogs"
| where Message contains "connection authorized"
| extend RealTime=todatetime(timestamp_s);
let starttime=toscalar(
    SuccessConn
    | summarize mintime=min(RealTime)
    | project xmintime=bin(mintime, 1m)
    | extend mintime=iff(isnotempty(xmintime), xmintime, dummystart)
    | project mintime
);
let endtime=toscalar(
    SuccessConn
    | summarize xmaxtime=max(RealTime)
    | extend maxtime=iff(isnotempty(xmaxtime), xmaxtime, dummyend)
    | project maxtime
);
let TimeRange = endtime - starttime;
let Intervals = iff(
    TimeRange <= 12h, 1m,
        iff(TimeRange <= 24h, 5m,
            iff(TimeRange <= 48h, 10m,
                iff(TimeRange <= 7d, 30m,1h)
            )
        )
);
let IntervalStr=iff (
    Intervals==1m,"1 minute",
        iff (Intervals==5m, "5 minutes",
            iff (Intervals==10m, "10 minutes",
                iff (Intervals==30m, "30 minutes", "1 hour")
            )
        )
);
SuccessConn
| extend allmatches=extract_all(@'user=(.+)database=(.\S+)', Message)
| extend user=trim(@" ",tostring(allmatches[0][0]) )
| extend Connection=iff(user == "azuresu","AzureConnections","NonAzureConnections")
| make-series Connections=count() default=0 on RealTime from starttime to endtime step Intervals by Connection
| render timechart with ( xtitle=strcat("Time (aggregation interval ",IntervalStr,")") )
图表:失败与成功的连接
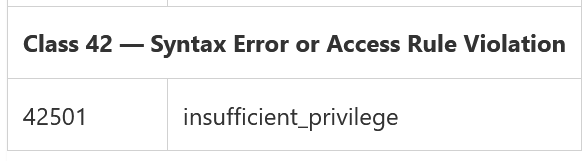
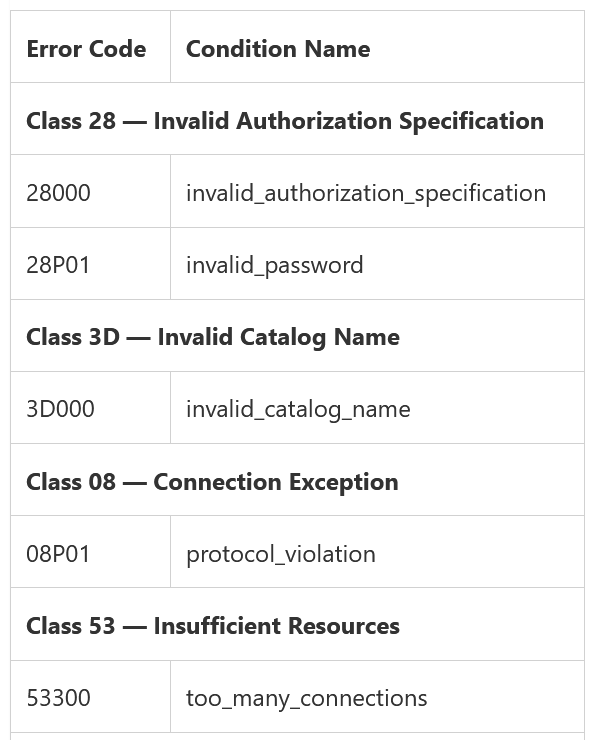
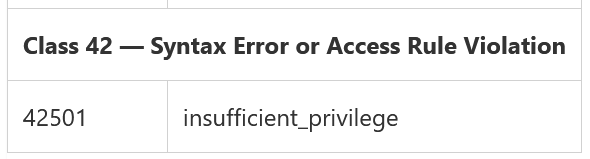
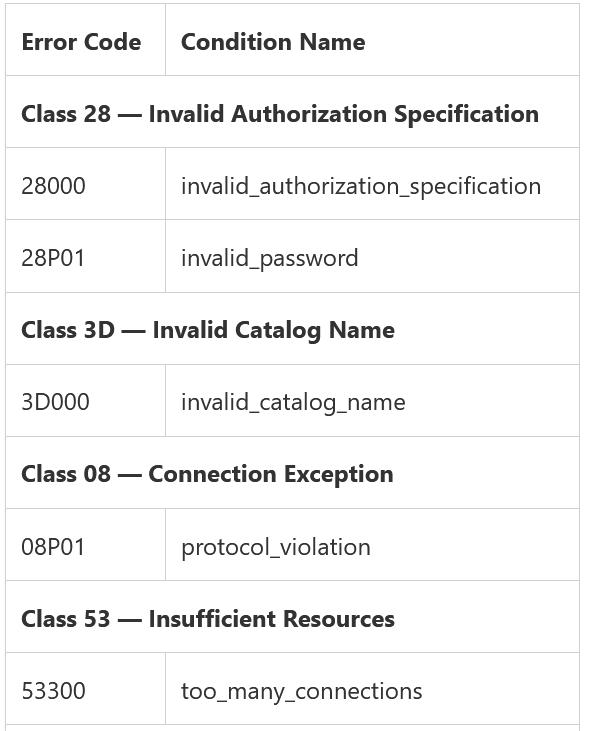
下面的图表是由 2 个查询的联合生成的:一个查询正在搜索成功的连接,而另一个查询正在搜索失败的连接。 成功的登录将包括复制和非复制连接,而由用户“azuresu”表示的 azure 连接被排除在外。 失败的连接将搜索“身份验证失败”消息或具有以下任何 PostgreSQL 错误代码的所有 FATAL 错误:

结果查询将绘制一个图表,该图表是成功连接与基于间隔聚合的失败连接的比较。
//Failed vs Successful Connections [including replication]
let dummystart=datetime('2000-01-01 00:00');
let dummyend=datetime('2000-01-01 00:01');
let MAX_PID_JOIN_SEC=30;
let SuccessConn=AzureDiagnostics
    | where ResourceProvider == 'MICROSOFT.DBFORPOSTGRESQL'
    | where Category == 'PostgreSQLLogs'
    | where Message contains 'connection authorized'
    | extend ConnectTime=todatetime(timestamp_s);
let PreFailedConn=AzureDiagnostics
    | where ResourceProvider == 'MICROSOFT.DBFORPOSTGRESQL'
    | where Category == 'PostgreSQLLogs'
    | where Message contains 'authentication failed' or sqlerrcode_s in ('28000', '28P01', '3D000', '53300', '42501', '08P01')
    | where errorLevel_s =='FATAL'
    | extend AuthFailedTime=todatetime(timestamp_s);
let searchpids=PreFailedConn
    | distinct processId_d;
let FailedConnectionReceived=AzureDiagnostics
    | where ResourceProvider == 'MICROSOFT.DBFORPOSTGRESQL'
    | where Category == 'PostgreSQLLogs'
    | where Message contains 'connection received'
    | where processId_d in (searchpids)
    | extend ConnectTime=todatetime(timestamp_s);
let FailedConn=PreFailedConn
    | join kind=leftouter FailedConnectionReceived on $left.processId_d == $right.processId_d
    | extend deltatime=datetime_diff('second', AuthFailedTime, ConnectTime)
    | where deltatime >= 0 and deltatime < MAX_PID_JOIN_SEC;
let AllConnections=SuccessConn
    | union FailedConn;
let starttime=toscalar(
    AllConnections
    | summarize mintime=min(ConnectTime)
    | project xmintime=bin(mintime, 1m)
    | extend mintime=iff(isnotempty(xmintime), xmintime, dummystart)
    | project mintime
    );
let endtime=toscalar(
    AllConnections
    | summarize xmaxtime=max(ConnectTime)
    | extend maxtime=iff(isnotempty(xmaxtime), xmaxtime, dummyend)
    | project maxtime
    );
let TimeRange = endtime - starttime;
let Intervals = iff(
    TimeRange <= 12h, 1m,
        iff(TimeRange <= 24h, 5m,
            iff(TimeRange <= 48h, 10m,
                iff(TimeRange <= 7d, 30m,1h)
            )
        )
);
let IntervalStr=iff (
    Intervals==1m,'1 minute',
        iff (Intervals==5m, '5 minutes',
            iff (Intervals==10m, '10 minutes',
                iff (Intervals==30m, '30 minutes', '1 hour')
            )
        )
);
AllConnections
| extend allmatches=extract_all(@'user=(.+)database=(.\S+)', Message)
| extend user=trim(@' ', tostring(allmatches[0][0]))
| where user != 'azuresu'
| extend Connection=iff(Message contains 'connection authorized', 'SuccessfulConnection', 'FailedConnection')
| make-series Connections=count() default=0 on ConnectTime from starttime to endtime step Intervals by Connection
| render timechart with (xtitle=strcat('Time (aggregation interval ', IntervalStr, ')'))
图表:复制与非复制成功连接
Kusto 查询最初搜索所有消息类型“已授权的连接”,表示 PostgreSQL 日志中的成功连接条目。 之后,如果消息与指示复制连接的“复制连接授权”匹配,则相应的连接被标记为复制连接,否则标记为非复制连接。 用户“azuresu”表示的 Azure 连接不包括在内。 生成的图表将是基于间隔聚合的复制与非复制连接的比较。
// Replication vs Non-Replication connections
let dummystart=datetime('2000-01-01 00:00');
let dummyend=datetime('2000-01-01 00:01');
let AllConnections=AzureDiagnostics
| where ResourceProvider =="MICROSOFT.DBFORPOSTGRESQL"
| where Category == "PostgreSQLLogs"
| where Message contains "connection authorized"
| extend RealTime=todatetime(timestamp_s);
let starttime=toscalar(
    AllConnections
    | summarize mintime=min(RealTime)
    | project xmintime=bin(mintime, 1m)
    | extend mintime=iff(isnotempty(xmintime), xmintime, dummystart)
    | project mintime
);
let endtime=toscalar(
    AllConnections
    | summarize xmaxtime=max(RealTime)
    | extend maxtime=iff(isnotempty(xmaxtime), xmaxtime, dummyend)
    | project maxtime
);
let TimeRange = endtime - starttime;
let Intervals = iff(
    TimeRange <= 12h, 1m,
        iff(TimeRange <= 24h, 5m,
            iff(TimeRange <= 48h, 10m,
                iff(TimeRange <= 7d, 30m,1h)
            )
        )
);
let IntervalStr=iff (
    Intervals==1m,"1 minute",
        iff (Intervals==5m, "5 minutes",
            iff (Intervals==10m, "10 minutes",
                iff (Intervals==30m, "30 minutes", "1 hour")
            )
        )
);
AllConnections
| extend allmatches=extract_all(@'user=(.+)database=(.\S+)', Message)
| extend user=trim(@" ",tostring(allmatches[0][0]) )
| where user != 'azuresu' // exclude azure connections from successful connections.
| extend Connection=iff(Message contains "replication connection authorized","ReplicationConnection","Non-ReplicationConnection")
| make-series Connections=count() default=0 on RealTime from starttime to endtime step Intervals by Connection
| render timechart with ( xtitle=strcat("Time (aggregation interval ",IntervalStr,")") )
图表:数据库成功的非复制连接
Kusto 查询搜索类型为“连接授权”的消息,该消息表示成功连接的条目并排除“复制连接授权”消息,因此它将仅包括成功的非复制连接。 随后使用正则表达式检索建立连接的用户和数据库 extract_all(@‘user=(.+)database=(.\S+)’, Message)。 排除用户“azuresu”表示的所有连接。 生成的图表将代表数据库根据 Interval 聚合的成功连接计数器。
// Successful Non-replication connections by database
let dummystart=datetime('2000-01-01 00:00');
let dummyend=datetime('2000-01-01 00:01');
let SuccessConnNonReplication=AzureDiagnostics
| where ResourceProvider =="MICROSOFT.DBFORPOSTGRESQL"
| where Category == "PostgreSQLLogs"
| where Message contains "connection authorized"
| where Message !contains "replication connection authorized"
| extend RealTime=todatetime(timestamp_s);
let starttime=toscalar(
    SuccessConnNonReplication
    | summarize mintime=min(RealTime)
    | project xmintime=bin(mintime, 1m)
    | extend mintime=iff(isnotempty(xmintime), xmintime, dummystart)
    | project mintime
);
let endtime=toscalar(
    SuccessConnNonReplication
    | summarize xmaxtime=max(RealTime)
    | extend maxtime=iff(isnotempty(xmaxtime), xmaxtime, dummyend)
    | project maxtime
);
let TimeRange = endtime - starttime;
let Intervals = iff(
    TimeRange <= 12h, 1m,
        iff(TimeRange <= 24h, 5m,
            iff(TimeRange <= 48h, 10m,
                iff(TimeRange <= 7d, 30m,1h)
            )
        )
);
let IntervalStr=iff (
    Intervals==1m,"1 minute",
        iff (Intervals==5m, "5 minutes",
            iff (Intervals==10m, "10 minutes",
                iff (Intervals==30m, "30 minutes", "1 hour")
            )
        )
);
SuccessConnNonReplication
| extend allmatches=extract_all(@'user=(.+)database=(.\S+)', Message)
| extend user=trim(@" ",tostring(allmatches[0][0]) )
| extend database=tostring(allmatches[0][1])
| where user != 'azuresu' // exclude azure connections
| make-series Connections=count() default=0 on RealTime from starttime to endtime step Intervals by database
| render timechart with ( xtitle=strcat("Time (aggregation interval ",IntervalStr,")") )
图表:用户成功的非复制连接
Kusto 查询搜索类型为“连接授权”的消息,该消息表示成功连接的条目并排除“复制连接授权”消息,因此它将仅包括成功的非复制连接。 随后使用正则表达式检索建立连接的用户和数据库 extract_all(@‘user=(.+)database=(.\S+)’, Message)。 排除用户“azuresu”表示的所有连接。 生成的图表将代表用户根据间隔聚合的成功连接计数器。
// Successful Non-replication connections by user
let dummystart=datetime('2000-01-01 00:00');
let dummyend=datetime('2000-01-01 00:01');
let SuccessConnNonReplication=AzureDiagnostics
| where ResourceProvider =="MICROSOFT.DBFORPOSTGRESQL"
| where Category == "PostgreSQLLogs"
| where Message contains "connection authorized"
| where Message !contains "replication connection authorized"
| extend RealTime=todatetime(timestamp_s);
let starttime=toscalar(
    SuccessConnNonReplication
    | summarize mintime=min(RealTime)
    | project xmintime=bin(mintime, 1m)
    | extend mintime=iff(isnotempty(xmintime), xmintime, dummystart)
    | project mintime
);
let endtime=toscalar(
    SuccessConnNonReplication
    | summarize xmaxtime=max(RealTime)
    | extend maxtime=iff(isnotempty(xmaxtime), xmaxtime, dummyend)
    | project maxtime
);
let TimeRange = endtime - starttime;
let Intervals = iff(
    TimeRange <= 12h, 1m,
        iff(TimeRange <= 24h, 5m,
            iff(TimeRange <= 48h, 10m,
                iff(TimeRange <= 7d, 30m,1h)
            )
        )
);
let IntervalStr=iff (
    Intervals==1m,"1 minute",
        iff (Intervals==5m, "5 minutes",
            iff (Intervals==10m, "10 minutes",
                iff (Intervals==30m, "30 minutes", "1 hour")
            )
        )
);
SuccessConnNonReplication
| extend allmatches=extract_all(@'user=(.+)database=(.\S+)', Message)
| extend user=trim(@" ",tostring(allmatches[0][0]) )
| extend database=tostring(allmatches[0][1])
| where user != 'azuresu' // exclude azure connections
| make-series Connections=count() default=0 on RealTime from starttime to endtime step Intervals by user
| render timechart with ( xtitle=strcat("Time (aggregation interval ",IntervalStr,")") )
图表:用户的复制连接
Kusto 查询搜索类型为“已授权的复制连接”的消息,该消息表示复制连接的条目。 随后使用正则表达式检索复制连接的用户和应用程序名称 extract_all(@‘user=(.+)application_name=(.\S+)’, Message)。 生成的图表将代表用户根据 Interval 聚合的复制连接计数器。
// Replication Connections by user
let dummystart=datetime('2000-01-01 00:00');
let dummyend=datetime('2000-01-01 00:01');
let SuccessConn=AzureDiagnostics
| where ResourceProvider =="MICROSOFT.DBFORPOSTGRESQL"
| where Category == "PostgreSQLLogs"
| where Message contains "connection authorized"
| extend RealTime=todatetime(timestamp_s);
let starttime=toscalar(
    SuccessConn
    | summarize mintime=min(RealTime)
    | project xmintime=bin(mintime, 1m)
    | extend mintime=iff(isnotempty(xmintime), xmintime, dummystart)
    | project mintime
);
let endtime=toscalar(
    SuccessConn
    | summarize xmaxtime=max(RealTime)
    | extend maxtime=iff(isnotempty(xmaxtime), xmaxtime, dummyend)
    | project maxtime
);
let TimeRange = endtime - starttime;
let Intervals = iff(
    TimeRange <= 12h, 1m,
        iff(TimeRange <= 24h, 5m,
            iff(TimeRange <= 48h, 10m,
                iff(TimeRange <= 7d, 30m,1h)
            )
        )
);
let IntervalStr=iff (
    Intervals==1m,"1 minute",
        iff (Intervals==5m, "5 minutes",
            iff (Intervals==10m, "10 minutes",
                iff (Intervals==30m, "30 minutes", "1 hour")
            )
        )
);
SuccessConn
| where Message contains "replication connection authorized"
| extend allmatches=extract_all(@'user=(.+)application_name=(.\S+)', Message)
| extend user=tostring(allmatches[0][0])
| extend application_name=tostring(allmatches[0][1])
| make-series Connections=count() default=0 on RealTime from starttime to endtime step Intervals by user
| render timechart with ( xtitle=strcat("Time (aggregation interval ",IntervalStr,")") )
图表:按 application_name 的复制连接
Kusto 查询搜索类型为“已授权的复制连接”的消息,该消息表示复制连接的条目。 随后使用正则表达式检索复制连接的用户和应用程序名称 extract_all(@‘user=(.+)application_name=(.\S+)’, Message)。 生成的图表将代表 application_name 基于 Interval 聚合的复制连接计数器。
// Replication Connections by application_name
let dummystart=datetime('2000-01-01 00:00');
let dummyend=datetime('2000-01-01 00:01');
let SuccessConn=AzureDiagnostics
| where ResourceProvider =="MICROSOFT.DBFORPOSTGRESQL"
| where Category == "PostgreSQLLogs"
| where Message contains "connection authorized"
| extend RealTime=todatetime(timestamp_s);
let starttime=toscalar(
    SuccessConn
    | summarize mintime=min(RealTime)
    | project xmintime=bin(mintime, 1m)
    | extend mintime=iff(isnotempty(xmintime), xmintime, dummystart)
    | project mintime
);
let endtime=toscalar(
    SuccessConn
    | summarize xmaxtime=max(RealTime)
    | extend maxtime=iff(isnotempty(xmaxtime), xmaxtime, dummyend)
    | project maxtime
);
let TimeRange = endtime - starttime;
let Intervals = iff(
    TimeRange <= 12h, 1m,
        iff(TimeRange <= 24h, 5m,
            iff(TimeRange <= 48h, 10m,
                iff(TimeRange <= 7d, 30m,1h)
            )
        )
);
let IntervalStr=iff (
    Intervals==1m,"1 minute",
        iff (Intervals==5m, "5 minutes",
            iff (Intervals==10m, "10 minutes",
                iff (Intervals==30m, "30 minutes", "1 hour")
            )
        )
);
SuccessConn
| where Message contains "replication connection authorized"
| extend allmatches=extract_all(@'user=(.+)application_name=(.\S+)', Message)
| extend user=tostring(allmatches[0][0])
| extend application_name=tostring(allmatches[0][1])
| make-series Connections=count() default=0 on RealTime from starttime to endtime step Intervals by application_name
| render timechart with ( xtitle=strcat("Time (aggregation interval ",IntervalStr,")") )
### 图表:连接生命周期向下钻取

Kusto 查询在 PostgreSQL 日志中搜索表示断开连接条目的“断开连接”类型的消息。 随后使用正则表达式检索持续时间、用户、数据库和 Ip extract_all(@'session time:(.+)user=(.+)database=(.+)host=(.\S+)', Message)。 最初,持续时间以字符串形式报告,并以秒为单位进行转换。 不包括由用户“azuresu”表示的与 Azure 的断开连接。 如果持续时间小于 60 秒,则在连接上进一步标记为短寿命,如果持续时间在 60 秒和 1200 秒之间,则标记为正常寿命,如果持续时间大于 1200 秒,则标记为长寿命。 生成的图表将表示基于间隔聚合的连接持续时间类型的计数器。
//Connection durations drill-down
let dummystart=datetime('2000-01-01 00:00');
let dummyend=datetime('2000-01-01 00:01');
let Disconnections=AzureDiagnostics
| where ResourceProvider =="MICROSOFT.DBFORPOSTGRESQL"
| where Category == "PostgreSQLLogs"
| where Message contains "disconnection"
| extend DisconnectTime=todatetime(timestamp_s);
let starttime=toscalar(
    Disconnections
    | summarize mintime=min(DisconnectTime)
    | project xmintime=bin(mintime, 1m)
    | extend mintime=iff(isnotempty(xmintime), xmintime, dummystart)
    | project mintime
);
let endtime=toscalar(
    Disconnections
    | summarize xmaxtime=max(DisconnectTime)
    | extend maxtime=iff(isnotempty(xmaxtime), xmaxtime, dummyend)
    | project maxtime
);
let TimeRange = endtime - starttime;
let Intervals = iff(
    TimeRange <= 12h, 1m,
        iff(TimeRange <= 24h, 5m,
            iff(TimeRange <= 48h, 10m,
                iff(TimeRange <= 7d, 30m,1h)
            )
        )
);
let IntervalStr=iff (
    Intervals==1m,"1 minute",
        iff (Intervals==5m, "5 minutes",
            iff (Intervals==10m, "10 minutes",
                iff (Intervals==30m, "30 minutes", "1 hour")
            )
        )
);
Disconnections
| extend allmatches=extract_all(@'session time:(.+)user=(.+)database=(.+)host=(.\S+)', Message)
| extend duration=totime(allmatches[0][0])
| extend user=trim(@" ",tostring(allmatches[0][1]) )
| extend database=tostring(allmatches[0][2])
| extend ip=tostring(allmatches[0][3])
| where user != 'azuresu'
| extend ts = totimespan(duration)
| extend DurationInSeconds = ts / 1s
| extend ConnType=iff(
    DurationInSeconds <= 60, 'Short-Lived Connection' ,
    iff(DurationInSeconds > 60 and DurationInSeconds < 1200, 'Normal-Lived Connection','Long-Lived Connection')
)
| make-series Connections=count() default=0 on DisconnectTime from starttime to endtime step Intervals by ConnType
| render timechart with ( xtitle=strcat("Time (aggregation interval ",IntervalStr,")") )
图表:按 IP 划分的平均连接持续时间(以秒为单位)
Kusto 查询在 PostgreSQL 日志中搜索表示断开连接条目的“断开连接”类型的消息。 随后使用正则表达式检索持续时间、用户、数据库和 Ip extract_all(@‘session time:(.+)user=(.+)database=(.+)host=(.\S+)’, Message)。 不包括由用户“azuresu”表示的与 Azure 的断开连接。 最初,持续时间被报告为一个字符串,它以秒为单位进行转换。 生成的图表将表示基于间隔在 Ip 上聚合的平均连接持续时间(以秒为单位)。
//Average connection duration by IP
let dummystart=datetime('2000-01-01 00:00');
let dummyend=datetime('2000-01-01 00:01');
let Disconnections=AzureDiagnostics
| where ResourceProvider =="MICROSOFT.DBFORPOSTGRESQL"
| where Category == "PostgreSQLLogs"
| where Message contains "disconnection"
| extend DisconnectTime=todatetime(timestamp_s);
let starttime=toscalar(
    Disconnections
    | summarize mintime=min(DisconnectTime)
    | project xmintime=bin(mintime, 1m)
    | extend mintime=iff(isnotempty(xmintime), xmintime, dummystart)
    | project mintime
);
let endtime=toscalar(
    Disconnections
    | summarize xmaxtime=max(DisconnectTime)
    | extend maxtime=iff(isnotempty(xmaxtime), xmaxtime, dummyend)
    | project maxtime
);
let TimeRange = endtime - starttime;
let Intervals = iff(
    TimeRange <= 12h, 1m,
        iff(TimeRange <= 24h, 5m,
            iff(TimeRange <= 48h, 10m,
                iff(TimeRange <= 7d, 30m,1h)
            )
        )
);
let IntervalStr=iff (
    Intervals==1m,"1 minute",
        iff (Intervals==5m, "5 minutes",
            iff (Intervals==10m, "10 minutes",
                iff (Intervals==30m, "30 minutes", "1 hour")
            )
        )
);
Disconnections
| extend allmatches=extract_all(@'session time:(.+)user=(.+)database=(.+)host=(.\S+)', Message)
| extend duration=totime(allmatches[0][0])
| extend user=trim(@" ",tostring(allmatches[0][1]) )
| extend database=tostring(allmatches[0][2])
| extend ip=tostring(allmatches[0][3])
| where user != 'azuresu'
| extend ts = totimespan(duration)
| extend DurationInSeconds = ts / 1s
| make-series avgConnectionDurationInSec=avg(DurationInSeconds) on DisconnectTime from starttime to endtime step Intervals by ip
| render timechart with ( xtitle=strcat("Time (aggregation interval ",IntervalStr,")") )
图表:SqlErrorCode 的连接错误
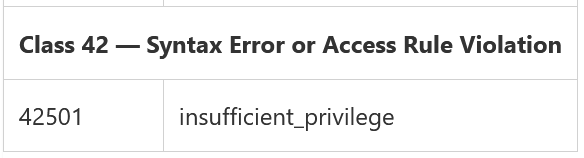
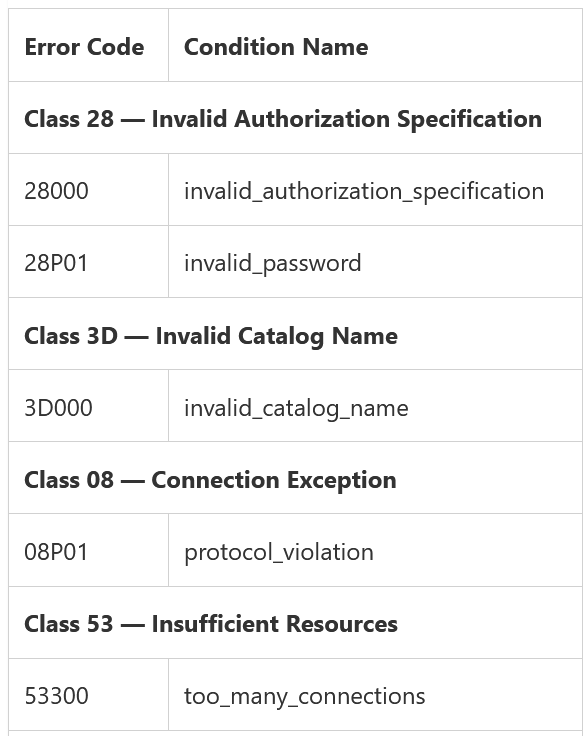
要获取所有登录失败,Kusto 查询首先搜索“身份验证失败”消息或具有以下任何 PostgreSQL 错误代码的所有 FATAL 错误:

生成的图表将代表一个基于 Interval 聚合的连接 SQL 错误代码计数器,并将及时指示 SQL 错误代码的模式。
//Connection errors counter by SqlErrorCode
let dummystart=datetime('2000-01-01 00:00');
let dummyend=datetime('2000-01-01 00:01');
let MAX_PID_JOIN_SEC=30;
let ConnectErrors=AzureDiagnostics
| where ResourceProvider == "MICROSOFT.DBFORPOSTGRESQL"
| where Category == "PostgreSQLLogs"
| where Message contains "authentication failed" or sqlerrcode_s in ('28000', '28P01', '3D000', '53300', '42501','08P01')
| where errorLevel_s =='FATAL'
| extend SqlErrorCode=sqlerrcode_s
| extend AuthFailedTime=todatetime(timestamp_s);
let starttime=toscalar(
    ConnectErrors
    | summarize mintime=min(AuthFailedTime)
    | project xmintime=bin(mintime, 1m)
    | extend mintime=iff(isnotempty(xmintime), xmintime, dummystart)
    | project mintime
);
let endtime=toscalar(
    ConnectErrors
    | summarize xmaxtime=max(AuthFailedTime)
    | extend maxtime=iff(isnotempty(xmaxtime), xmaxtime, dummyend)
    | project maxtime
);
let TimeRange = endtime - starttime;
let Intervals = iff(
    TimeRange <= 12h, 1m,
        iff(TimeRange <= 24h, 5m,
            iff(TimeRange <= 48h, 10m,
                iff(TimeRange <= 7d, 30m,1h)
            )
        )
);
let IntervalStr=iff (
    Intervals==1m,"1 minute",
        iff (Intervals==5m, "5 minutes",
            iff (Intervals==10m, "10 minutes",
                iff (Intervals==30m, "30 minutes", "1 hour")
            )
        )
);
let searchpids=ConnectErrors
| distinct processId_d;
let ConnectionReceived=AzureDiagnostics
| where ResourceProvider == "MICROSOFT.DBFORPOSTGRESQL"
| where Category == "PostgreSQLLogs"
| where Message contains "connection received"
| where processId_d in (searchpids)
| extend IP=extract(@'host=(.\S+)', 1, Message)
| extend ConnectTime=todatetime(timestamp_s);
ConnectErrors
| join kind=leftouter ConnectionReceived on $left.processId_d == $right.processId_d
| extend deltatime=datetime_diff('second', AuthFailedTime, ConnectTime)
| where deltatime >= 0 and deltatime < MAX_PID_JOIN_SEC
| make-series ConnectionErrors=count() default=0 on ConnectTime from starttime to endtime step Intervals by SqlErrorCode
| render timechart with ( xtitle=strcat("Time (aggregation interval ",IntervalStr,")") )
图表:IP 连接错误
要获取所有登录失败,Kusto 查询首先搜索“身份验证失败”消息或具有以下任何 PostgreSQL 错误代码的所有 FATAL 错误:
为了获得失败消息的 IP,它使用了额外的操作。 首先,它检索所有不同的失败 PID,然后搜索所有类型为“已收到连接”的消息以查找相应的 PID。 从收到的连接表中,使用正则表达式解析 IP。 在这个阶段有两张表:一张保存故障,另一张保存连接。 此外,这两个表是基于 PID 的外部联接。 由于 PID 可以及时重复,因此要获得与实际故障相对应的正确配对,计算故障时间和连接时间之间的以秒为单位的差异。 连接的最大允许差异以秒为单位由 MAX_PID_JOIN_SEC=30 表示。 使用这种方法,可以确保实现正确的映射。
生成的图表将代表基于时间间隔聚合的连接失败计数器,并将及时指示 IP 的错误数。
//Connection errors counter by Ip
let dummystart=datetime('2000-01-01 00:00');
let dummyend=datetime('2000-01-01 00:01');
let MAX_PID_JOIN_SEC=30;
let ConnectErrors=AzureDiagnostics
| where ResourceProvider == "MICROSOFT.DBFORPOSTGRESQL"
| where Category == "PostgreSQLLogs"
| where Message contains "authentication failed" or sqlerrcode_s in ('28000', '28P01', '3D000', '53300', '42501','08P01')
| where errorLevel_s =='FATAL'
| extend AuthFailedTime=todatetime(timestamp_s);
let starttime=toscalar(
    ConnectErrors
    | summarize mintime=min(AuthFailedTime)
    | project xmintime=bin(mintime, 1m)
    | extend mintime=iff(isnotempty(xmintime), xmintime, dummystart)
    | project mintime
);
let endtime=toscalar(
    ConnectErrors
    | summarize xmaxtime=max(AuthFailedTime)
    | extend maxtime=iff(isnotempty(xmaxtime), xmaxtime, dummyend)
    | project maxtime
);
let TimeRange = endtime - starttime;
let Intervals = iff(
    TimeRange <= 12h, 1m,
        iff(TimeRange <= 24h, 5m,
            iff(TimeRange <= 48h, 10m,
                iff(TimeRange <= 7d, 30m,1h)
            )
        )
);
let IntervalStr=iff (
    Intervals==1m,"1 minute",
        iff (Intervals==5m, "5 minutes",
            iff (Intervals==10m, "10 minutes",
                iff (Intervals==30m, "30 minutes", "1 hour")
            )
        )
);
let searchpids=ConnectErrors
| distinct processId_d;
let ConnectionReceived=AzureDiagnostics
| where ResourceProvider == "MICROSOFT.DBFORPOSTGRESQL"
| where Category == "PostgreSQLLogs"
| where Message contains "connection received"
| where processId_d in (searchpids)
| extend IP=extract(@'host=(.\S+)', 1, Message)
| extend ConnectTime=todatetime(timestamp_s);
ConnectErrors
| join kind=leftouter ConnectionReceived on $left.processId_d == $right.processId_d
| extend deltatime=datetime_diff('second', AuthFailedTime, ConnectTime)
| where deltatime >= 0 and deltatime < MAX_PID_JOIN_SEC
| make-series ConnectionErrors=count() default=0 on ConnectTime from starttime to endtime step Intervals by IP
| render timechart with ( xtitle=strcat("Time (aggregation interval ",IntervalStr,")") )
摘要:IP 的新连接
Kusto 查询在服务器日志中搜索类型为“已收到连接”的消息,该消息表示 PostgreSQL 日志中每个连接的条目。 使用正则表达式,从日志条目中提取 IP:IP=extract(@‘host=(.\S+)’, 1, Message)。 随后,查询将按 IP 汇总在 Azure UI 中选择的整个时间范围内的所有新连接。 摘要将代表每个 IP 的连接计数器,并显示在整个时间范围内遇到的第一个和最后一个连接。
//Summary of all new connections by IP
AzureDiagnostics
| where ResourceProvider == "MICROSOFT.DBFORPOSTGRESQL"
| where Category == "PostgreSQLLogs"
| where Message contains "connection received"
| extend RealTime=todatetime(timestamp_s)
| extend IP=extract(@'host=(.\S+)', 1, Message)
| summarize FirstConnection=min(RealTime),LastConnection=max(RealTime), Counter=count() by IP
| order by Counter desc
摘要:Azure 成功连接
Kusto 查询在服务器日志中搜索“连接授权”类型的消息,该消息表示 PostgreSQL 日志中每个成功连接的条目。复制连接被排除在外。使用正则表达式检索建立连接的用户和数据库 extract_all(@‘user=(.+)database=(.\S+)’, Message)。用户被过滤为“azuresu”,因此仅被视为 Azure 连接。事件发生的时间用“connection received”表示,基本上是认证完成的时间用ConnAuthTime表示。
为了获取 Ip 和接收连接的时间,检索连接授权表的所有不同 PID。然后在所有类型为“已收到连接”的消息中搜索相应的 PID。从收到的连接表中,使用正则表达式解析 IP。接收到连接的时间表示为 ConnRecvTime。
此外,这两个表(Connection Authorized 和 Connection Received)是基于 PID 的外部联接。由于 PID 可以及时重复,因此要获得与实际连接相对应的正确配对,需要计算身份验证和连接时间之间的秒差(以秒为单位)。 MAX_PID_JOIN_SEC=30 表示连接的最大允许差异(以秒为单位),以确保实现正确的映射。
最后,从结果表中将汇总在 Azure UI 中选择的整个时间范围内的所有 Azure 连接。数据按 Ip、用户和数据库分组,它将表示连接计数器,并显示每个分组对(Ip、用户和数据库)在整个时间范围内遇到的第一个和最后一个连接时间。
//Summary of Azure Only Successful Connections
let MAX_PID_JOIN_SEC=30;
let ConnectionAuthorized=AzureDiagnostics
| where ResourceProvider =="MICROSOFT.DBFORPOSTGRESQL"
| where Category == "PostgreSQLLogs"
| where Message contains "connection authorized"
| where Message !contains "replication connection"
| extend allmatches=extract_all(@'user=(.+)database=(.\S+)', Message)
| extend user=trim(@" ",tostring(allmatches[0][0]) )
| extend database=tostring(allmatches[0][1])
| where user == 'azuresu' // only azuresu connections
| project ConnAuthTime=todatetime(timestamp_s), processId_d,user, database, ConAuthMSG=Message;
let searchpids=ConnectionAuthorized
| distinct processId_d;
let ConnectionReceived=AzureDiagnostics
| where ResourceProvider =="MICROSOFT.DBFORPOSTGRESQL"
| where Category == "PostgreSQLLogs"
| where Message contains "connection received"
| where processId_d in (searchpids)
| extend IP=extract(@'host=(.\S+)', 1, Message)
| project ConnRecvTime=todatetime(timestamp_s), processId_d,IP, ConRecvMSG=Message;
ConnectionAuthorized
| join kind=leftouter ConnectionReceived on $left.processId_d==$right.processId_d
| project processId_d,IP,user,database,ConnRecvTime,ConnAuthTime,ConRecvMSG,ConAuthMSG
| extend ConnSetupTime=ConnAuthTime-ConnRecvTime
| extend deltatime=datetime_diff('second',ConnAuthTime,ConnRecvTime)
| where deltatime >=0 and deltatime < MAX_PID_JOIN_SEC
| order by ConnRecvTime desc
| project IP,user,database,ConnRecvTime,ConnAuthTime,ConnSetupTime,processId_d//,ConRecvMSG,ConAuthMSG
| summarize FirstConnection=min(ConnRecvTime),LastConnection=max(ConnRecvTime), Count=count() by IP, user, database
| order by Count desc
摘要:成功的连接
Kusto 查询在服务器日志中搜索“连接授权”类型的消息,该消息表示 PostgreSQL 日志中每个成功连接的条目。复制连接被排除在外。使用正则表达式检索建立连接的用户和数据库 extract_all(@‘user=(.+)database=(.\S+)’, Message)。 Azure 连接被排除在外,只有你或你的应用程序创建的连接的图片。事件发生的时间用“connection received”表示,基本上是认证完成的时间用ConnAuthTime表示。
为了获取 Ip 和接收连接的时间,检索连接授权表的所有不同 PID。然后在所有类型为“已收到连接”的消息中搜索相应的 PID。从收到的连接表中,使用正则表达式解析 IP。接收到连接的时间表示为 ConnRecvTime。
此外,这两个表(Connection Authorized 和 Connection Received)是基于 PID 的外部联接。由于 PID 可以及时重复,因此要获得与实际连接相对应的正确配对,需要计算身份验证和连接时间之间的秒差(以秒为单位)。 MAX_PID_JOIN_SEC=30 表示连接的最大允许差异(以秒为单位),以确保实现正确的映射。
最后,从结果表中将汇总在 Azure UI 中选择的整个时间范围内的所有非复制连接。数据按 Ip、用户和数据库分组,它将表示连接计数器,并显示每个分组对(Ip、用户和数据库)在整个时间范围内遇到的第一个和最后一个连接时间。
//Summary of Successful Connections
let MAX_PID_JOIN_SEC=30;
let ConnectionAuthorized=AzureDiagnostics
| where ResourceProvider =="MICROSOFT.DBFORPOSTGRESQL"
| where Category == "PostgreSQLLogs"
| where Message contains "connection authorized"
| where Message !contains "replication connection"
| extend allmatches=extract_all(@'user=(.+)database=(.\S+)', Message)
| extend user=trim(@" ",tostring(allmatches[0][0]) )
| extend database=tostring(allmatches[0][1])
| where user != 'azuresu' // exclude azuresu connections
| project ConnAuthTime=todatetime(timestamp_s), processId_d,user, database, ConAuthMSG=Message;
let searchpids=ConnectionAuthorized
| distinct processId_d;
let ConnectionReceived=AzureDiagnostics
| where ResourceProvider =="MICROSOFT.DBFORPOSTGRESQL"
| where Category == "PostgreSQLLogs"
| where Message contains "connection received"
| where processId_d in (searchpids)
| extend IP=extract(@'host=(.\S+)', 1, Message)
| project ConnRecvTime=todatetime(timestamp_s), processId_d,IP, ConRecvMSG=Message;
ConnectionAuthorized
| join kind=leftouter ConnectionReceived on $left.processId_d==$right.processId_d
| project processId_d,IP,user,database,ConnRecvTime,ConnAuthTime,ConRecvMSG,ConAuthMSG
| extend ConnSetupTime=ConnAuthTime-ConnRecvTime
| extend deltatime=datetime_diff('second',ConnAuthTime,ConnRecvTime)
| where deltatime >=0 and deltatime < MAX_PID_JOIN_SEC
| order by ConnRecvTime desc
| project IP,user,database,ConnRecvTime,ConnAuthTime,ConnSetupTime,processId_d//,ConRecvMSG,ConAuthMSG
| summarize FirstConnection=min(ConnRecvTime),LastConnection=max(ConnRecvTime), Count=count() by IP, user, database
| order by Count desc
摘要:复制连接
Kusto Query 在服务器日志中搜索类型为“已授权的复制连接”的消息,该消息表示 PostgreSQL 日志中每个复制连接的条目。这样就排除了非复制连接。使用正则表达式检索建立连接的用户和应用程序名称 extract_all(@‘user=(.+)application_name=(.\S+)’, Message)。不包括 Azure 连接,以便仅显示由您或您的应用创建的连接。事件发生的时间用“connection received”表示,基本上是认证完成的时间用ConnAuthTime表示。
要获取 Ip 和接收连接的时间,将检索复制连接授权表的所有不同 PID。然后在所有类型为“已收到连接”的消息中搜索相应的 PID。从收到的连接表中,使用正则表达式解析 IP。接收到连接的时间表示为 ConnRecvTime。
此外,这 2 个表(Replication Connection Authorized 和 Connection Received)是基于 PID 的外部联接。由于 PID 可以及时重复,因此要获得与实际连接相对应的正确配对,需要计算身份验证和连接时间之间的秒差(以秒为单位)。 MAX_PID_JOIN_SEC=30 表示连接的最大允许差异(以秒为单位),以确保实现正确的映射。
最后,结果表中将汇总在 Azure UI 中选择的整个时间范围内的所有复制连接。数据按 Ip、user 和 application_name 分组,它将代表连接计数器,并显示每个分组对(Ip、user 和 application_name)在整个时间范围内遇到的第一个和最后一个复制连接时间。
//Summary of Replication connections
let MAX_PID_JOIN_SEC=30;
let ReplicationConn=AzureDiagnostics
| where ResourceProvider =="MICROSOFT.DBFORPOSTGRESQL"
| where Category == "PostgreSQLLogs"
| where Message contains "replication connection authorized"
| extend allmatches=extract_all(@'user=(.+)application_name=(.\S+)', Message)
| extend user=tostring(allmatches[0][0])
| extend application_name=tostring(allmatches[0][1])
| project ConnAuthTime=todatetime(timestamp_s), user, application_name, processId_d, ConAuthMSG=Message;
let searchpids=ReplicationConn
| distinct processId_d;
let ConnectionReceived=AzureDiagnostics
| where ResourceProvider =="MICROSOFT.DBFORPOSTGRESQL"
| where Category == "PostgreSQLLogs"
| where Message contains "connection received"
| where processId_d in (searchpids)
| extend IP=extract(@'host=(.\S+)', 1, Message)
| project ConnRecvTime=todatetime(timestamp_s), processId_d,IP, ConRecvMSG=Message;
ReplicationConn
| join kind=leftouter ConnectionReceived on $left.processId_d==$right.processId_d
| extend ConnSetupTime=ConnAuthTime-ConnRecvTime
| extend deltatime=datetime_diff('second',ConnAuthTime,ConnRecvTime)
| where deltatime >=0 and deltatime < MAX_PID_JOIN_SEC
| summarize FirstConnection=min(ConnRecvTime),LastConnection=max(ConnRecvTime), Count=count() by IP, user, application_name
| order by Count desc
摘要:断开连接
Kusto 查询在 PostgreSQL 日志中搜索表示断开连接条目的“断开连接”类型的消息。 随后使用正则表达式检索持续时间、用户、数据库和 Ip extract_all(@‘session time:(.+)user=(.+)database=(.+)host=(.\S+)’, Message)。 不包括由用户“azuresu”表示的与 Azure 的断开连接。 最初,持续时间被报告为一个字符串,它以秒为单位进行转换。
随后将汇总在 Azure UI 中选择的整个时间范围内的所有断开连接。 数据按 Ip、用户和数据库分组,它将代表断开连接计数器,并显示每个分组对(Ip、用户和 数据库)。
// Summary of disconnections
AzureDiagnostics
| where ResourceProvider =="MICROSOFT.DBFORPOSTGRESQL"
| where Category == "PostgreSQLLogs"
| where Message contains "disconnection"
| extend allmatches=extract_all(@'session time:(.+)user=(.+)database=(.+)host=(.\S+)', Message)
| extend duration=totime(allmatches[0][0])
| extend user=trim(@" ",tostring(allmatches[0][1]) )
| extend database=tostring(allmatches[0][2])
| extend IP=tostring(allmatches[0][3])
| where user != 'azuresu'
| extend ts = totimespan(duration)
| extend DurationInSeconds = ts / 1s
| extend DisconnectTime=todatetime(timestamp_s)
| summarize FirstDisconnection=min(DisconnectTime), LastDisconnection=max(DisconnectTime), minDurationSec=min(DurationInSeconds),
maxDurationSec=max(DurationInSeconds), AvgDurationSec=avg(DurationInSeconds),
    NrOfDisconnections=count() by IP,user, database
| order by NrOfDisconnections desc
摘要:所有失败的登录
要获取所有登录失败,Kusto 查询首先搜索“身份验证失败”消息或具有以下任何 PostgreSQL 错误代码的所有 FATAL 错误:
如果相应的字段不为空,则会将失败的详细信息附加到错误消息本身。失败的时间表示为 AuthFailedTime。
要获取 Ip 和接收连接的时间,将检索身份验证失败表的所有不同 PID。然后在所有类型为“已收到连接”的消息中搜索相应的 PID。从接收到的连接表中,使用正则表达式解析 IP,接收到连接的时间表示为 ConnectTime。
此外,这两个表(Authentication Failure 和 Connection Received)是基于 PID 的外部联接。由于 PID 可以及时重复,因此要获得与实际连接失败相对应的正确配对,计算失败的身份验证和连接时间之间的差异(以秒为单位)。 MAX_PID_JOIN_SEC=30 表示连接的最大允许差异(以秒为单位),以确保实现正确的映射。
最后,从结果表中将汇总在 Azure UI 中选择的整个时间范围内的所有身份验证失败。数据按 Ip、ErrorMessage 和 SqlErrorCode 分组,它将代表登录失败计数器,并显示每个分组对(Ip、ErrorMessage 和 SqlErrorCode)在整个时间范围内遇到的第一次和最后一次失败时间。
//Summary of All Failed logins
let MAX_PID_JOIN_SEC=30;
let ConnectErrors=AzureDiagnostics
| where ResourceProvider == "MICROSOFT.DBFORPOSTGRESQL"
| where Category == "PostgreSQLLogs"
| where Message contains "authentication failed" or sqlerrcode_s in ('28000', '28P01', '3D000', '53300', '42501','08P01')
| where errorLevel_s =='FATAL'
| extend preErrorMsg=extract(@'[FATAL|LOG|ERROR]:(.+)', 1, Message)
| extend nextparseErrorMsg=extract(@':\s(.+)', 1, preErrorMsg)
| extend ErrorMsgWithoutDetail=iff(isempty(nextparseErrorMsg), preErrorMsg, nextparseErrorMsg)
| extend ErrorMessage=iff(isnotempty(detail_log_s), strcat(ErrorMsgWithoutDetail, '. ', detail_log_s), ErrorMsgWithoutDetail)
| project AuthFailedTime=todatetime(timestamp_s), processId_d, ErrorMessage, SqlErrorCode=sqlerrcode_s;
let searchpids=ConnectErrors
| distinct processId_d;
let ConnectionReceived=AzureDiagnostics
| where ResourceProvider == "MICROSOFT.DBFORPOSTGRESQL"
| where Category == "PostgreSQLLogs"
| where Message contains "connection received"
| where processId_d in (searchpids)
| extend IP=extract(@'host=(.\S+)', 1, Message)
| project ConnectTime=todatetime(timestamp_s), IP, processId_d;
ConnectErrors
| join kind=leftouter ConnectionReceived on $left.processId_d == $right.processId_d
| extend ConnSetupTime=AuthFailedTime - ConnectTime
| extend deltatime=datetime_diff('second', AuthFailedTime, ConnectTime)
| where deltatime >= 0 and deltatime < MAX_PID_JOIN_SEC
| summarize FirstErrorTime=min(ConnectTime), LastErrorTime=max(ConnectTime), TotalErrors=count() by IP, ErrorMessage, SqlErrorCode
| order by TotalErrors desc
清单:所有成功的连接
Kusto 查询在服务器日志中搜索“连接授权”类型的消息,该消息表示 PostgreSQL 日志中每个成功连接的条目。复制连接被排除在外。使用正则表达式检索建立连接的用户和数据库 extract_all(@‘user=(.+)database=(.\S+)’, Message)。 Azure 连接也被排除在外,以仅显示您或您的应用程序创建的连接。 “连接授权”表示事件的时间,基本上是认证完成的时间表示为ConnAuthTime。连接授权的完整消息由 ConAuthMSG 表示。
为了获取 Ip 和接收连接的时间,检索连接授权表的所有不同 PID。然后在所有类型为“已收到连接”的消息中搜索相应的 PID。从收到的连接表中,使用正则表达式解析 IP。接收到连接的时间表示为 ConnRecvTime,而完整消息表示为 ConRecvMSG。
此外,这两个表(Connection Authorized 和 Connection Received)是基于 PID 的外部联接。由于 PID 可以及时重复,因此要获得与实际连接相对应的正确配对,需要计算身份验证和连接时间之间的秒差(以秒为单位)。 MAX_PID_JOIN_SEC=30 表示连接的最大允许差异(以秒为单位),以确保实现正确的映射。
结果表中的数据将按降序排序,并将针对每个成功连接预测 IP、用户、数据库、连接接收时间 (ConnRecvTime)、连接认证时间 (ConnAuthTime)、建立连接所需的时间 ConnSetupTime(其中是 ConnAuthTime 和 ConnRecvTime 之间的时间差)和连接的 PID。 ConAuthMSG 和 ConRecvMSG 已被注释,但是如果您需要这些消息,您可以选择自行取消注释。
//All Successful Connections in descending order
let MAX_PID_JOIN_SEC=30;
let ConnectionAuthorized=AzureDiagnostics
| where ResourceProvider =="MICROSOFT.DBFORPOSTGRESQL"
| where Category == "PostgreSQLLogs"
| where Message contains "connection authorized"
| where Message !contains "replication connection"
| extend allmatches=extract_all(@'user=(.+)database=(.\S+)', Message)
| extend user=trim(@" ",tostring(allmatches[0][0]) )
| extend database=tostring(allmatches[0][1])
| where user != 'azuresu' // exclude azuresu connections
| project ConnAuthTime=todatetime(timestamp_s), processId_d,user, database, ConAuthMSG=Message;
let searchpids=ConnectionAuthorized
| distinct processId_d;
let ConnectionReceived=AzureDiagnostics
| where ResourceProvider =="MICROSOFT.DBFORPOSTGRESQL"
| where Category == "PostgreSQLLogs"
| where Message contains "connection received"
| where processId_d in (searchpids)
| extend IP=extract(@'host=(.\S+)', 1, Message)
| project ConnRecvTime=todatetime(timestamp_s), processId_d,IP, ConRecvMSG=Message;
ConnectionAuthorized
| join kind=leftouter ConnectionReceived on $left.processId_d==$right.processId_d
| extend ConnSetupTime=ConnAuthTime-ConnRecvTime
| extend deltatime=datetime_diff('second',ConnAuthTime,ConnRecvTime)
| where deltatime >=0 and deltatime < MAX_PID_JOIN_SEC
| project IP,user,database,ConnRecvTime,ConnAuthTime,ConnSetupTime,PID=tostring(toint(processId_d))//,ConRecvMSG,ConAuthMSG
| order by ConnRecvTime desc
清单:所有复制连接
Kusto Query 在服务器日志中搜索类型为“已授权的复制连接”的消息,该消息表示 PostgreSQL 日志中每个复制连接的条目。这样就排除了非复制连接。使用正则表达式检索建立连接的用户和应用程序名称 extract_all(@‘user=(.+)application_name=(.\S+)’, Message)。不包括 Azure 连接,以便仅显示由您或您的应用创建的连接。事件发生的时间用“connection received”表示,基本上是认证完成的时间用ConnAuthTime表示。连接授权的完整消息由 ConAuthMSG 表示。
为了获取 Ip 和接收连接的时间,检索连接授权表的所有不同 PID。然后在所有类型为“已收到连接”的消息中搜索相应的 PID。从收到的连接表中,使用正则表达式解析 IP。接收到连接的时间表示为 ConnRecvTime,而完整消息表示为 ConRecvMSG。
此外,这 2 个表(Replication Connection Authorized 和 Connection Received)是基于 PID 的外部联接。由于 PID 可以及时重复,因此要获得与实际连接相对应的正确配对,需要计算身份验证和连接时间之间的秒差(以秒为单位)。 MAX_PID_JOIN_SEC=30 表示连接的最大允许差异(以秒为单位),以确保实现正确的映射。
结果表中的数据将按降序排序,并将为每个复制连接投影 IP、用户、应用程序名称、连接接收时间 (ConnRecvTime)、复制连接认证时间 (ConnAuthTime)、建立连接所需的时间 ConnSetupTime ( ConnAuthTime 和 ConnRecvTime 之间的时间差)和连接的 PID。 ConAuthMSG 和 ConRecvMSG 已被注释,但是如果您需要这些消息,您可以选择自行取消注释。
//All Replication connections
let MAX_PID_JOIN_SEC=30;
let ReplicationConn=AzureDiagnostics
| where ResourceProvider =="MICROSOFT.DBFORPOSTGRESQL"
| where Category == "PostgreSQLLogs"
| where Message contains "replication connection authorized"
| extend allmatches=extract_all(@'user=(.+)application_name=(.\S+)', Message)
| extend user=tostring(allmatches[0][0])
| extend application_name=tostring(allmatches[0][1])
| project ConnAuthTime=todatetime(timestamp_s), user, application_name, processId_d, ConAuthMSG=Message;
let searchpids=ReplicationConn
| distinct processId_d;
let ConnectionReceived=AzureDiagnostics
| where ResourceProvider =="MICROSOFT.DBFORPOSTGRESQL"
| where Category == "PostgreSQLLogs"
| where Message contains "connection received"
| where processId_d in (searchpids)
| extend IP=extract(@'host=(.\S+)', 1, Message)
| project ConnRecvTime=todatetime(timestamp_s), processId_d,IP, ConRecvMSG=Message;
ReplicationConn
| join kind=leftouter ConnectionReceived on $left.processId_d==$right.processId_d
| extend ConnSetupTime=ConnAuthTime-ConnRecvTime
| extend deltatime=datetime_diff('second',ConnAuthTime,ConnRecvTime)
| where deltatime >=0 and deltatime < MAX_PID_JOIN_SEC
| order by ConnRecvTime desc
| project IP, user, application_name, ConnRecvTime,ConnAuthTime,ConnSetupTime, PID=tostring(toint(processId_d))//,ConRecvMSG,ConAuthMSG
清单:所有断开连接
Kusto 查询在 PostgreSQL 日志中搜索表示断开连接条目的“断开连接”类型的消息。随后使用正则表达式检索持续时间、用户、数据库和 Ip extract_all(@‘session time:(.+)user=(.+)database=(.+)host=(.\S+)’, Message)。不包括由用户“azuresu”表示的与 Azure 的断开连接。最初,持续时间被报告为一个字符串,它以秒为单位进行转换。
随后将汇总在 Azure UI 中选择的整个时间范围内的所有断开连接。数据按 Ip、用户和数据库分组,它将表示断开连接计数器,并显示每个分组对(Ip、用户和数据库)。
数据将按降序排序,并将针对每次断开连接预测 IP、用户、数据库、断开连接时间 DisconnectTime、持续时间字符串持续时间、以秒转换的持续时间 DurationInSeconds 和相应连接的 PID。
// All disconnections in descending order
AzureDiagnostics
| where ResourceProvider =="MICROSOFT.DBFORPOSTGRESQL"
| where Category == "PostgreSQLLogs"
| where Message contains "disconnection"
| extend allmatches=extract_all(@'session time:(.+)user=(.+)database=(.+)host=(.\S+)', Message)
| extend duration=totime(allmatches[0][0])
| extend user=trim(@" ",tostring(allmatches[0][1]) )
| extend database=tostring(allmatches[0][2])
| extend IP=tostring(allmatches[0][3])
| where user != 'azuresu'
| extend ts = totimespan(duration)
| extend DurationInSeconds = ts / 1s
| project IP,user,database,DisconnectTime=todatetime(timestamp_s), duration,DurationInSeconds, PID=tostring(toint(processId_d))
| order by DisconnectTime desc
清单:所有登录失败
要获取所有登录失败,Kusto 查询首先搜索“身份验证失败”消息或具有以下任何 PostgreSQL 错误代码的所有 FATAL 错误:
如果相应的字段不为空,则会将失败的详细信息附加到错误消息本身。失败的时间记为 AuthFailedTime,而 PostgreSQL 的错误码记为 SqlErrorCode。
要获取 Ip 和接收连接的时间,将检索身份验证失败表的所有不同 PID。然后在所有类型为“已收到连接”的消息中搜索相应的 PID。从接收到的连接表中,使用正则表达式解析 IP,接收到连接的时间表示为 ConnectTime。
此外,这两个表(Authentication Failure 和 Connection Received)是基于 PID 的外部联接。由于 PID 可以及时重复,因此要获得与实际连接失败相对应的正确配对,计算失败的身份验证和连接时间之间的差异(以秒为单位)。 MAX_PID_JOIN_SEC=30 表示连接的最大允许差异(以秒为单位),以确保实现正确的映射。
结果表中的数据将按降序排序,并将针对每次登录失败预测 Ip、ErrorMessage、SqlErrorCode、连接接收时间 (ConnectTime)、连接认证失败时间 (AuthFailedTime)、建立连接所需时间 ConnSetupTime (这是 AuthFailedTime 和 ConnectTime 之间的时间差)和相应连接的 PID。
//All Connection failures in descending order
let MAX_PID_JOIN_SEC=30;
let ConnectErrors=AzureDiagnostics
| where ResourceProvider == "MICROSOFT.DBFORPOSTGRESQL"
| where Category == "PostgreSQLLogs"
| where Message contains "authentication failed" or sqlerrcode_s in ('28000', '28P01', '3D000', '53300', '42501','08P01')
| where errorLevel_s =='FATAL'
| extend preErrorMsg=extract(@'[FATAL|LOG|ERROR]:(.+)', 1, Message)
| extend nextparseErrorMsg=extract(@':\s(.+)', 1, preErrorMsg)
| extend ErrorMsgWithoutDetail=iff(isempty(nextparseErrorMsg), preErrorMsg, nextparseErrorMsg)
| extend ErrorMessage=iff(isnotempty(detail_log_s), strcat(ErrorMsgWithoutDetail, '. ', detail_log_s), ErrorMsgWithoutDetail)
| project AuthFailedTime=todatetime(timestamp_s), processId_d, ErrorMessage, SqlErrorCode=sqlerrcode_s;
let searchpids=ConnectErrors
| distinct processId_d;
let ConnectionReceived=AzureDiagnostics
| where ResourceProvider == "MICROSOFT.DBFORPOSTGRESQL"
| where Category == "PostgreSQLLogs"
| where Message contains "connection received"
| where processId_d in (searchpids)
| extend IP=extract(@'host=(.\S+)', 1, Message)
| project ConnectTime=todatetime(timestamp_s), IP, processId_d;
ConnectErrors
| join kind=leftouter ConnectionReceived on $left.processId_d == $right.processId_d
| extend ConnSetupTime=AuthFailedTime - ConnectTime
| extend deltatime=datetime_diff('second', AuthFailedTime, ConnectTime)
| where deltatime >= 0 and deltatime < MAX_PID_JOIN_SEC
| project IP,ErrorMessage,SqlErrorCode,ConnectTime,AuthFailedTime,ConnSetupTime, PID=tostring(toint(processId_d))
| order by ConnectTime desc
我们希望这篇博客文章对您有所帮助。 其他信息可在以下文档中找到:
- Azure Database for PostgreSQL - 灵活的服务器
- Azure Database for PostgreSQL 中的服务器参数 - 灵活的服务器
- Azure Database for PostgreSQL 中的日志 - 灵活的服务器
我们一直期待着得到您的反馈,因此请通过电子邮件联系 Ask Azure DB for PostgreSQL。
原文标题:Deploy a connectivity dashboard for PostgreSQL Flexible Server
原文作者:Sergiu Ernu
原文地址:https://techcommunity.microsoft.com/t5/azure-database-for-postgresql/deploy-a-connectivity-dashboard-for-postgresql-flexible-server/ba-p/3049069
