本文主要对如何在ggplot2中绘制折线图与面积图做一些总结,主要涉及单变量与多变量折线图、单变量与多变量面积图。其中折线图主要使用geom_line() 图层函数,面积图主要使用geom_area() 图层函数。
数据准备
以国家统计局[1]官网中黑龙江、吉林、辽宁三省份2001-2020年人均GDP数据为例来绘制折线图与面积图。数据可在官网自行下载,或后台回复【20220117】获得。
#设置工作路径与准备相关package
setwd("C:\\Users\\Acer\\Desktop") #设置工作路径
#install.packages("gcookbook")
#install.packages("ggplot2")
#install.packages("reshape2")
#install.packages("scales")
library(gcookbook)
library(ggplot2)
library(reshape2)
library(scales)
pergdp <- read.csv("折线图.csv")
head(pergdp)
#  year Liaoning Jilin Heilongjiang
#1 2001    12015  7076         7990
#2 2002    13000  7581         8507
#3 2003    14041  7925         9464
#4 2004    15355  9073        10836
#5 2005    17210 10237        12456
#6 2006    19760 11864        13947
1、单变量折线图
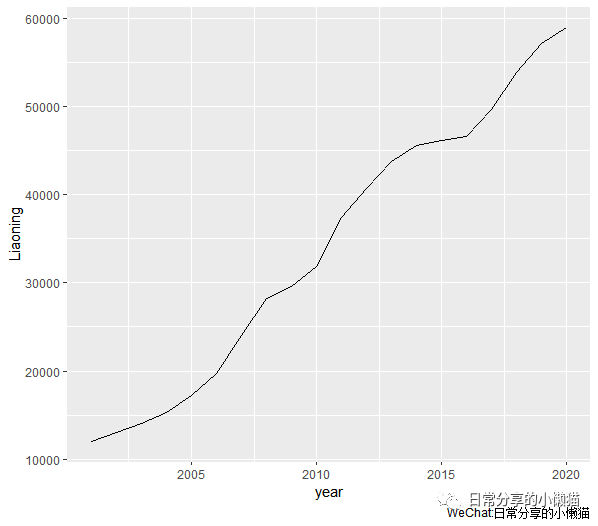
1.1 基础图形
ggplot(pergdp, aes(x = year, y = Liaoning)) +
  geom_line()
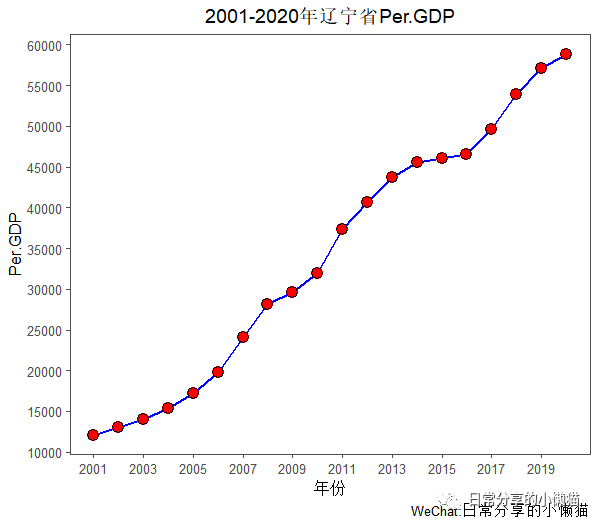
1.2 对基础图形进一步修饰。调整坐标轴、刻度、颜色、大小等
ggplot(pergdp, aes(x = year, y = Liaoning)) +
  geom_line(size = 1, color = "blue") + #设置线的厚度与颜色
  geom_point(shape = 21, size = 4, fill = "red", color = "black") + #对点的形状、大小、填充色、边框色进行调整
  scale_x_continuous(breaks = seq(2001, 2020, 2)) + #设置x轴的显示刻度
  scale_y_continuous(breaks = seq(10000, 60000, 5000)) + #设置y轴的显示刻度
  labs(x = "年份", y = "Per.GDP", title = "2001-2020年辽宁省Per.GDP") + #添加x、y轴标题与图标题
  theme_few() + #设置主题风格
  theme(plot.title = element_text(hjust = 0.5)) #设置图标题的位置
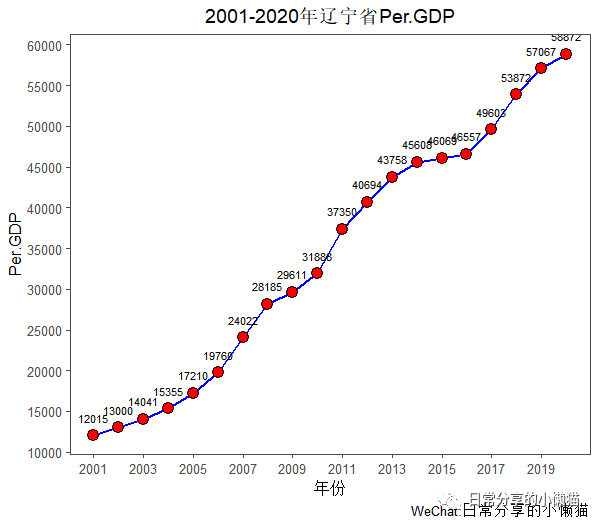
1.3 添加数据标签。利用geom_text()函数,其中vjust与size用来控制标签的纵向对齐与大小
ggplot(pergdp, aes(x = year, y = Liaoning)) +
  geom_line(size = 1, color = "blue") +
  geom_point(shape = 21, size = 4, fill = "red", color = "black") +
  scale_x_continuous(breaks = seq(2001, 2020, 2)) +
  scale_y_continuous(breaks = seq(10000, 60000, 5000)) +
  geom_text(aes(label = Liaoning), vjust = -1.5, size = 3) +
  labs(x = "年份", y = "Per.GDP", title = "2001-2020年辽宁省Per.GDP") +
  theme_few() +
  theme(plot.title = element_text(hjust = 0.5))
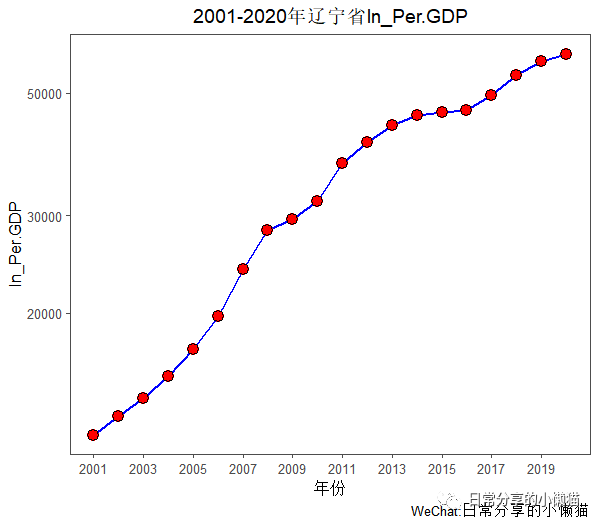
1.4 对y轴取对数。使用scale_y_log10() 函数
ggplot(pergdp, aes(x = year, y = Liaoning)) +
  geom_line(size = 1, color = "blue") +
  geom_point(shape = 21, size = 4, fill = "red", color = "black") +
  scale_x_continuous(breaks = seq(2001, 2020, 2)) +
  scale_y_log10() +
  labs(x = "年份", y = "Per.GDP", title = "2001-2020年辽宁省ln_Per.GDP") +
  theme_few() +
  theme(plot.title = element_text(hjust = 0.5))
2、多变量折线图
首先将宽数据转换为ggplot2能够设别的长数据。使用reshape2中的melt() 函数
pergdp <- read.csv("折线图.csv")
mydata <- melt(pergdp,
               id.vars=c("year"),
               variable.name="province",
               value.name="Per.GDP")
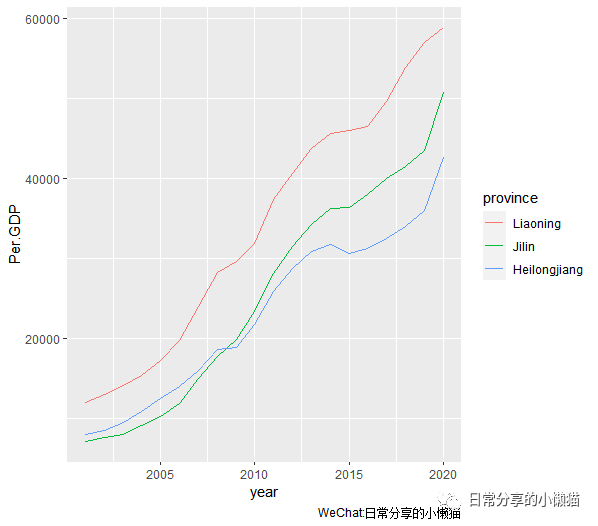
2.1 基础图形。多变量折线图可以使用color、linetype、shape、fill等对分组变量进行映射。
ggplot(mydata, aes(x = year, y = Per.GDP, color = province)) + #将分组变量映射到color
  geom_line()
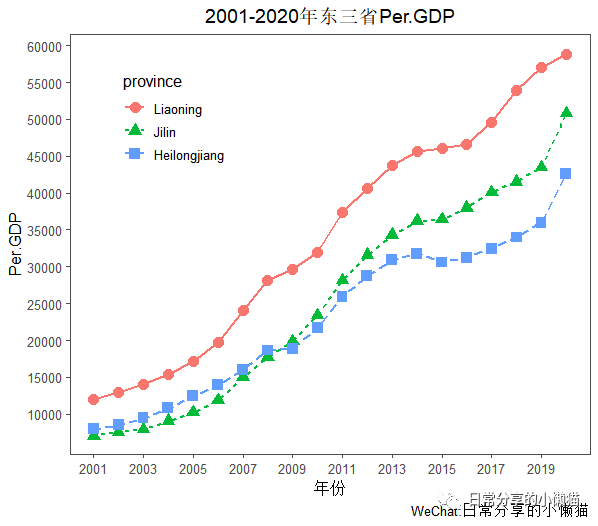
2.2 对基础图形进一步修饰。调整坐标轴刻度、线条颜色、厚度、添加数据点等
ggplot(mydata, aes(x = year, y = Per.GDP, color = province, shape = province, linetype = province)) +
  geom_line(size = 1) +
  geom_point(size = 3.5) +
  scale_x_continuous(breaks = seq(2001, 2020, 2)) +
  scale_y_continuous(breaks = seq(10000, 60000, 5000)) +
  labs(x = "年份", y = "Per.GDP", title = "2001-2020年东三省Per.GDP") +
  theme_few() +
  theme(plot.title = element_text(hjust = 0.5)) +
  theme(legend.position = c(0.2,0.8))
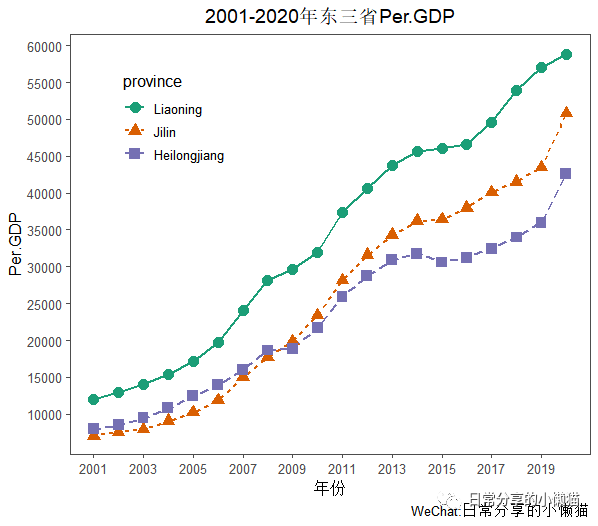
2.3 自定义颜色。使用RColorBrewer包中的颜色,利用scale_color_brewer() 函数,定义palette参数,如palette = "Dark2"。关于RColorBrewer的使用可参考R语言绘图|如何调用RColorBrewer包对图形颜色进行修改。
ggplot(mydata, aes(x = year, y = Per.GDP, color = province, shape = province, linetype = province)) +
  geom_line(size = 1) +
  geom_point(size = 3.5) +
  scale_x_continuous(breaks = seq(2001, 2020, 2)) +
  scale_y_continuous(breaks = seq(10000, 60000, 5000)) +
  labs(x = "年份", y = "Per.GDP", title = "2001-2020年东三省Per.GDP") +
  scale_color_brewer(palette = "Dark2") +
  theme_few() +
  theme(plot.title = element_text(hjust = 0.5)) +
  theme(legend.position = c(0.2,0.8))
3、单变量面积图
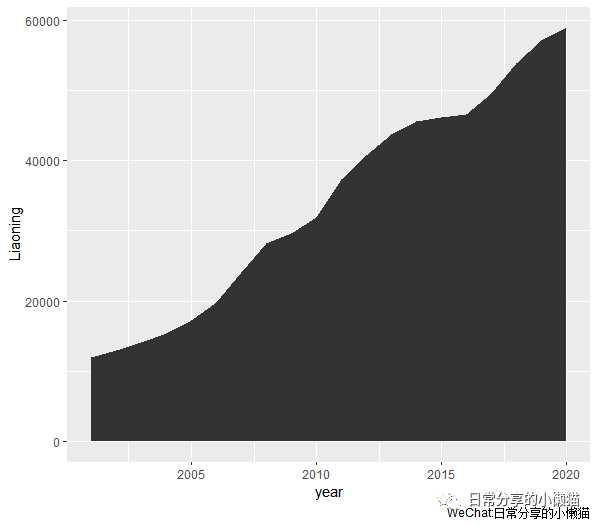
3.1 基础图形
ggplot(pergdp, aes(x = year, y = Liaoning)) +
  geom_area()
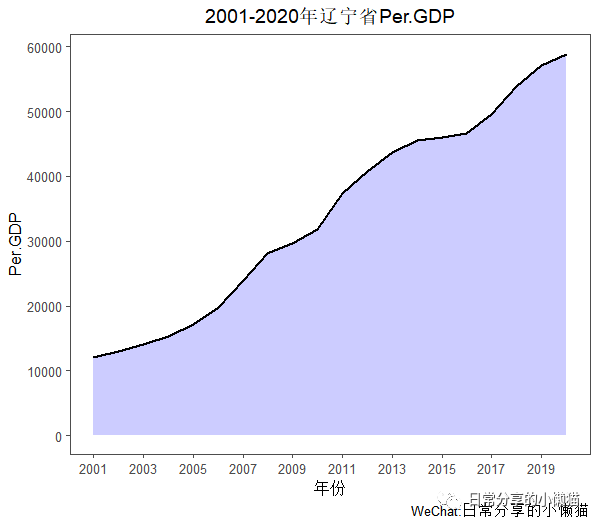
3.2 对基础图形进一步修饰。调整面积图的颜色及坐标轴、标题等
ggplot(pergdp, aes(x = year, y = Liaoning)) +
  geom_area(fill = "blue", color = "black", alpha = 0.2, size = 1) + #调整面积图的填充色、边框色、透明度以及边框厚度
  scale_x_continuous(breaks = seq(2001, 2020, 2)) +
  scale_y_continuous(breaks = seq(0, 60000, 10000)) +
  labs(x = "年份", y = "Per.GDP", title = "2001-2020年辽宁省Per.GDP") +
  theme_few() +
  theme(plot.title = element_text(hjust = 0.5))
4、多变量面积图
使用gcookbook包中的uspopage数据集。
#查看数据集
head(uspopage)
#  Year AgeGroup Thousands
#1 1900       <5      9181
#2 1900     5-14     16966
#3 1900    15-24     14951
#4 1900    25-34     12161
#5 1900    35-44      9273
#6 1900    45-54      6437
str(uspopage) #查看数据集结构
#'data.frame': 824 obs. of  3 variables:
# $ Year     : int  1900 1900 1900 1900 1900 1900 1900 1900 1901 1901 ...
# $ AgeGroup : Factor w/ 8 levels "<5","5-14","15-24",..: 1 2 3 4 5 6 7 8 1 2 ...
# $ Thousands: int  9181 16966 14951 12161 9273 6437 4026 3099 9336 17158 ...
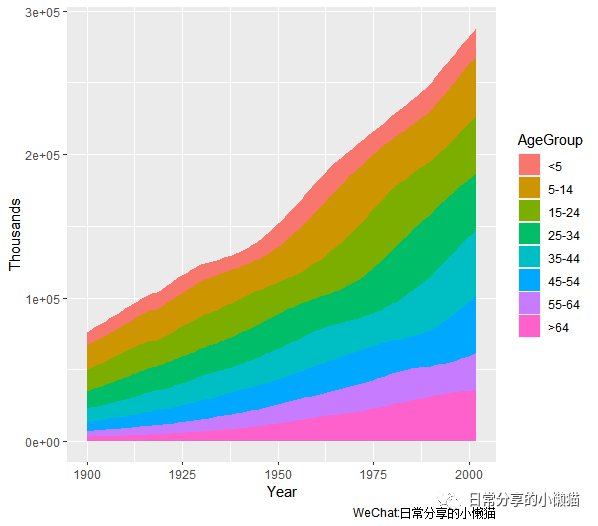
4.1 基础图形
ggplot(uspopage, aes(x = Year, y = Thousands, fill = AgeGroup)) + #使用fill进行映射
  geom_area()
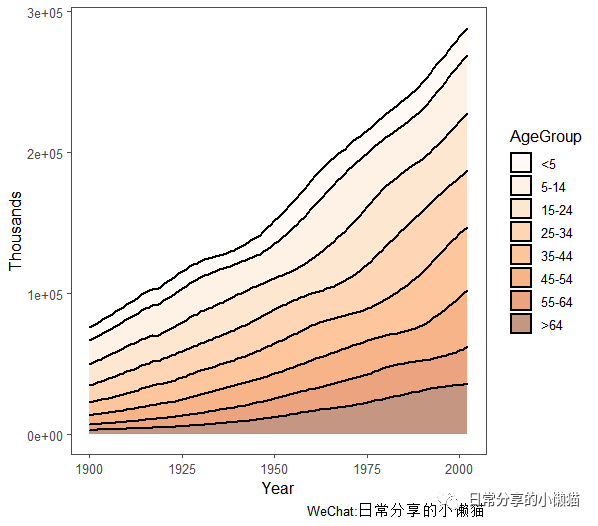
4.2 对基础图形进一步修饰。调整面积图的颜色、透明度等
ggplot(uspopage, aes(x = Year, y = Thousands, fill = AgeGroup)) +
  geom_area(color = "black", size = 1, alpha = 0.5) +
  scale_fill_brewer(palette = "Oranges") +
  theme_few()
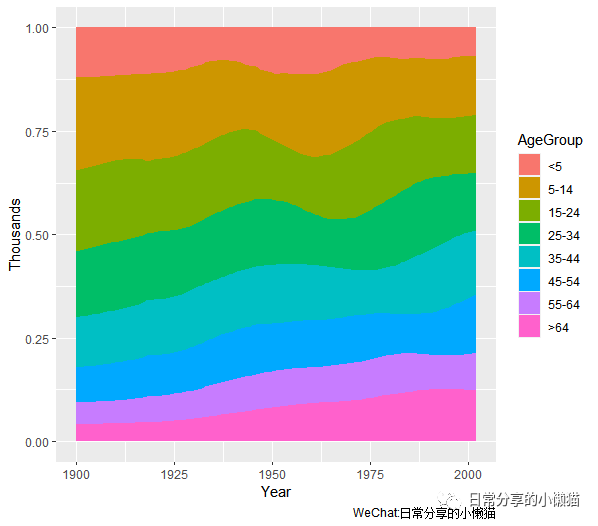
5、多变量面积图(百分比形式)
5.1 基础图形。在geom_area() 函数中加入position = "fill"
ggplot(uspopage, aes(x = Year, y = Thousands, fill = AgeGroup)) +
  geom_area(position = "fill")
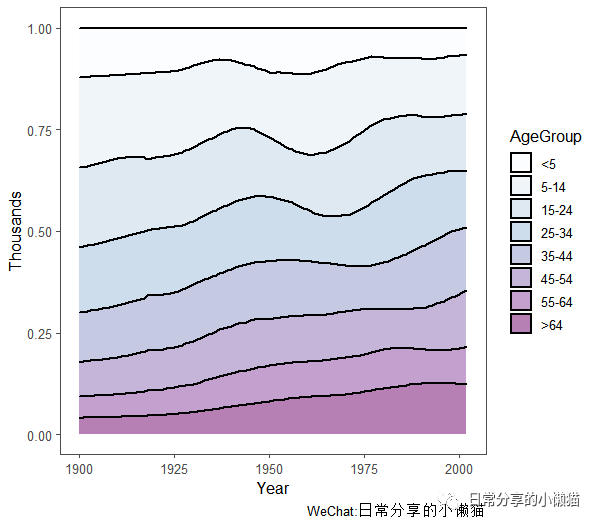
5.2 对基础图形进一步修饰,调整颜色、透明度等
ggplot(uspopage, aes(x = Year, y = Thousands, fill = AgeGroup)) +
  geom_area(position = "fill",color = "black", size = 1, alpha = 0.5) +
  scale_fill_brewer(palette = "BuPu") +
  theme_few()
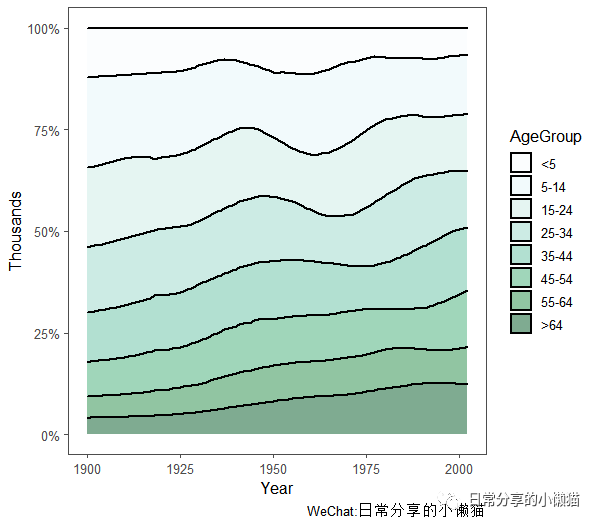
5.3 修改y轴刻度形式。将y轴0~1刻度形式改为0%~100%刻度形式
ggplot(uspopage, aes(x = Year, y = Thousands, fill = AgeGroup)) +
  geom_area(position = "fill",color = "black", size = 1, alpha = 0.5) +
  scale_fill_brewer(palette = "BuGn") +
  scale_y_continuous(labels = scales::percent) +
  theme_few()
6、其他
关于折线图的绘制可进一步参考Winston Chang所著的R Graphics Cookbook,中文版为《R数据可视化手册》。以下为折线图中常用到的点的形状与线的形状,其中需要注意的是,在点的形状中,1~14只有边框线(color),而没有填充色(fill),15~20只有填充色而没有边框线,21~25既有边框线也有填充色。
线的样式(eg:linetype = "dashed")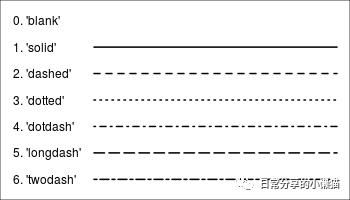
点的样式(eg:shape = 21)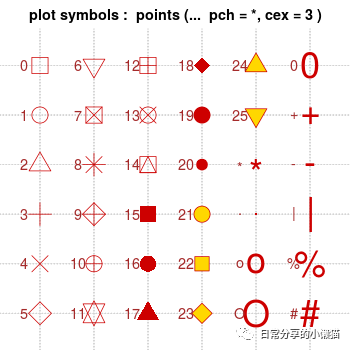
如有帮助请多多点赞哦!
参考资料
国家统计局: https://data.stats.gov.cn/index.htm


