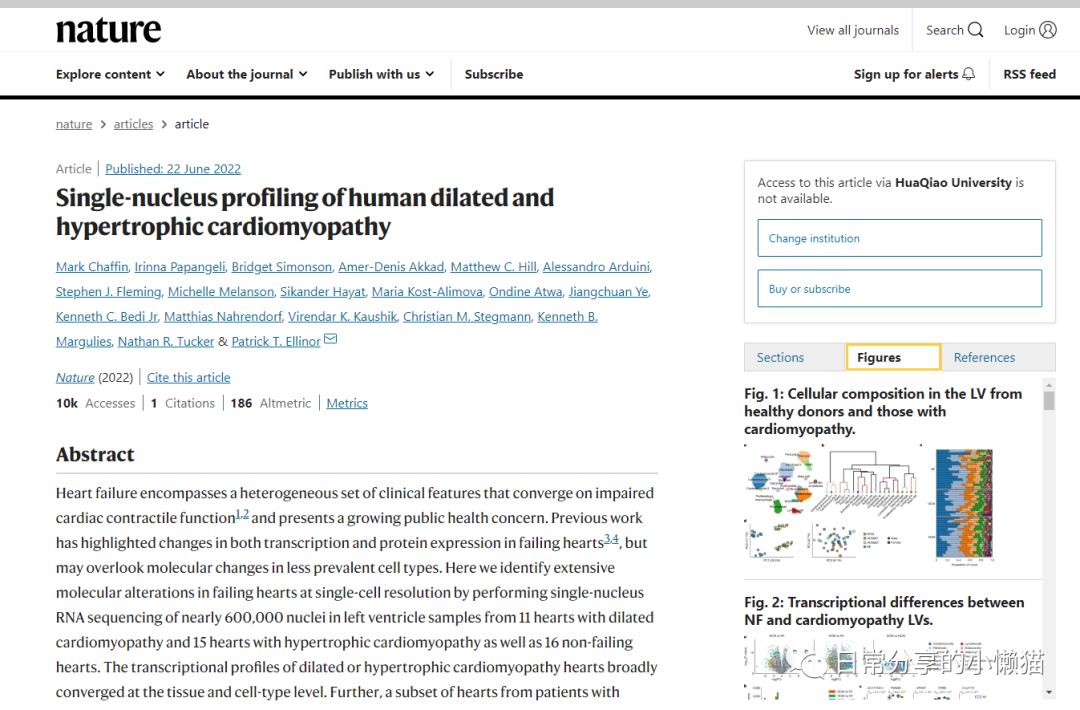
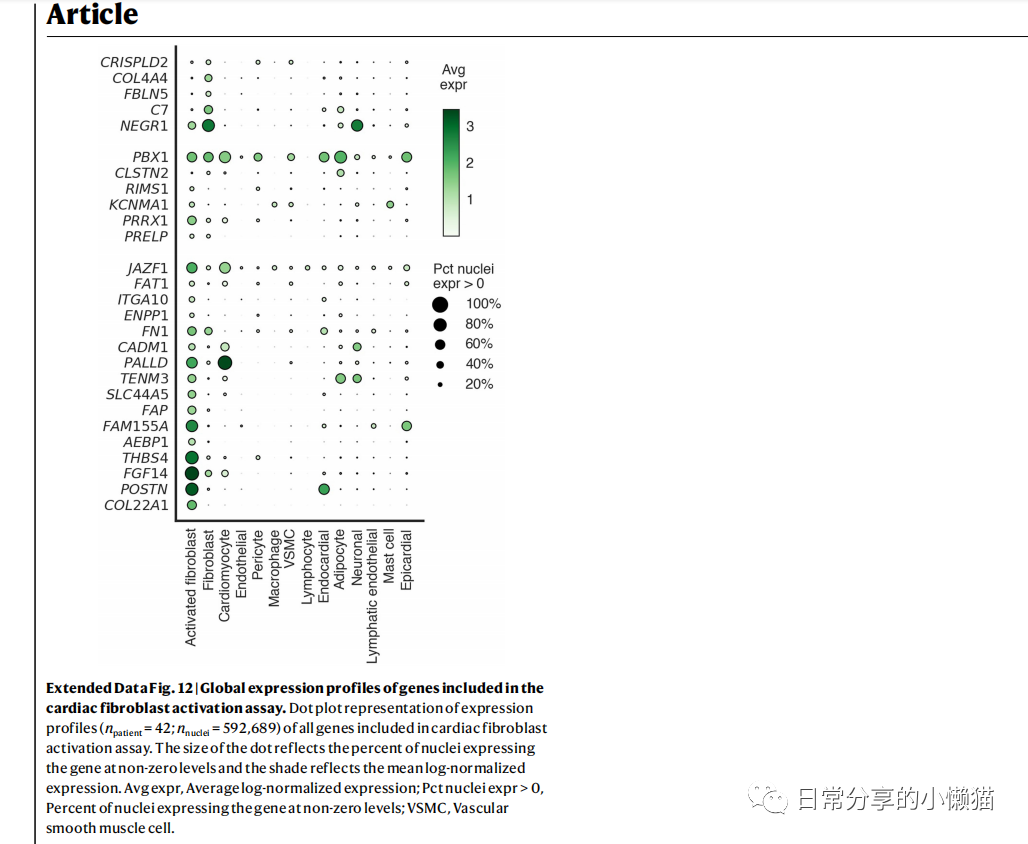
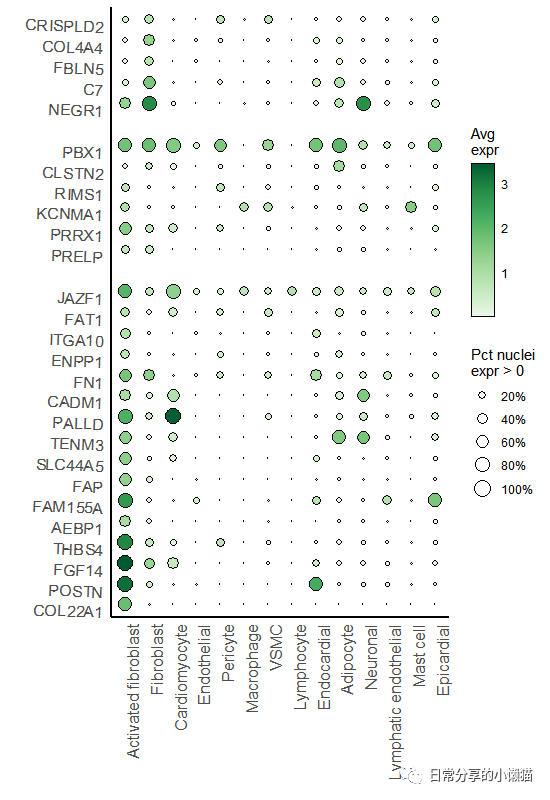
本文主要展示如何利用R语言绘制来自nature期刊Single-nucleus profiling of human dilated and hypertrophic cardiomyopathy[1]一文中的Extended Data Fig. 12气泡图。该气泡图用于展示细胞的基因表达谱,使用大小以及阴影分别表示细胞核的百分比以及平均对数标准化值,如下图所示:

1、图形绘制
setwd("C:\\Users\\Acer\\Desktop")
library(ggplot2)
library(dplyr)
sing.df <- readxl::read_xlsx("41586_2022_4817_MOESM18_ESM.xlsx")
head(sing.df)
#  Gene     CellType             Pct_Expr0 Avg_Expr
#1 CRISPLD2 Activated fibroblast   0.165    0.339
#2 CRISPLD2 Fibroblast             0.331    0.772
#3 CRISPLD2 Cardiomyocyte          0.0133   0.0169
#4 CRISPLD2 Endothelial            0.00265  0.00625
#5 CRISPLD2 Pericyte               0.283    0.759
#6 CRISPLD2 Macrophage             0.0218   0.0380
str(sing.df)
#tibble [378 x 4] (S3: tbl_df/tbl/data.frame)
# $ Gene     : chr [1:378] "CRISPLD2" "CRISPLD2" "CRISPLD2" "CRISPLD2" ...
# $ CellType : chr [1:378] "Activated fibroblast" "Fibroblast" "Cardiomyocyte" "Endothelial" ...
# $ Pct_Expr0: num [1:378] 0.16545 0.33146 0.01327 0.00265 0.28281 ...
# $ Avg_Expr : num [1:378] 0.33905 0.77193 0.01693 0.00625 0.7593 ...

#sing.df <- sing.df %>% mutate_if(is.character, as.factor)
sing.df$Gene <- factor(sing.df$Gene, levels = sing.df$Gene %>% unique() %>% rev())
sing.df$CellType <- factor(sing.df$CellType, levels = sing.df$CellType %>% unique())

# 绘图
ggplot(sing.df, aes(CellType, Gene, fill = Avg_Expr, size = Pct_Expr0 )) +
  geom_point(shape = 21, color = "black") +
  theme_classic() +
  scale_y_discrete(breaks = levels(sing.df$Gene),
                   limits = c(levels(sing.df$Gene)[1:16], "skip",
                              levels(sing.df$Gene)[17:22], "skip",
                              levels(sing.df$Gene)[23:27])) +
  scale_size_continuous(breaks = seq(0.2, 1, 0.2), limits = c(0, 1),
                        range = c(0, 5.5),
                        labels = c("20%", "40%", "60%", "80%", "100%")) +
  scale_fill_distiller(palette = "Greens", direction = 1) +
  theme(axis.text.x = element_text(angle = 90, size = 12, hjust = 1),
        axis.text.y = element_text(size = 12, angle = -2, vjust = 1),
        axis.line = element_line(size = 1),
        axis.ticks = element_blank()) +
  guides(fill = guide_colorbar(ticks = FALSE,
                               barheight = 8,
                               frame.colour = "black")) +
  labs(x = "", y = "",
       fill = "Avg\nexpr",
       size = "Pct nuclei\nexpr > 0")
 本图中一个较不常见的地方为在y轴加入间隙,需要使用到scale_y_discrete() 函数,对因子进行适当调整。该图虽看似简单,但包含细节较多,包括因子顺序、fill映射图例、size映射图例、y轴断裂等,需多加学习。
2、其他
其他绘图方法可进一步阅读公众号其他文章。
如有帮助请多多点赞哦!
参考资料
Chaffin, M., Papangeli, I., Simonson, B. et al. Single-nucleus profiling of human dilated and hypertrophic cardiomyopathy. Nature (2022): https://doi.org/10.1038/s41586-022-04817-8
文章转载自日常分享的小懒猫,如果涉嫌侵权,请发送邮件至:contact@modb.pro进行举报,并提供相关证据,一经查实,墨天轮将立刻删除相关内容。


