


前言
命令行工具,是传统dba傍身技能之一。今天我们要来学习使用pg_top进行数据库监控。
安装PG_TOP
pg_top有两种安装方式,一种是yum安装,这种方式安装非常简单,但是缺点是它需要依赖postgresql-server软件包的安装。所以我选择第二种方式编译安装。我这里使用root进行编译安装,编译之前需要设置好PGHOME和LD_LIBRARY_PATH等环境变量。
export PGHOME=/data/postgresql/pgsql
export LD_LIBRARY_PATH=$PGHOME/lib:$LD_LIBRARY_PATH
[root@centos8 ~]# wget -c https://gitlab.com/pg_top/pg_top/-/archive/master/pg_top-master.zip
[root@centos8 ~]# unzip pg_top-master.zip复制
解压安装文件后,先看以下INSTALL.rst文件,该文件会告诉我们如何进行编译安装。我们首先需要执行cmake配置一下安装路径(该步骤也会对当前环境进行一个检查)。
[root@centos8 pg_top-master]# cmake -DCMAKE_INSTALL_PREFIX=/usr/local复制
然后执行make,在执行make的过程中,我遇到了一个报错。我估计大多数人的centos/redhat系统都会报这个错误。该错误提示找不到bsd/stdlib.h。从这个名字中我们就可以大概猜出它缺少bsd的lib包。
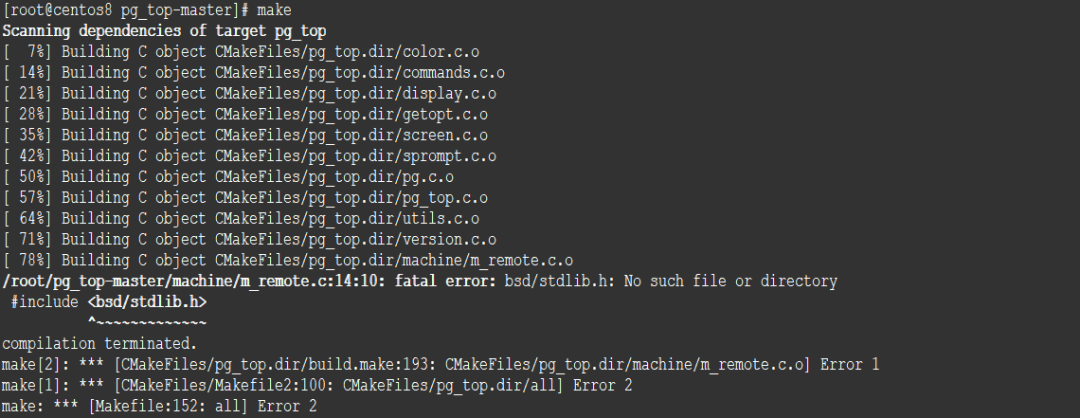
所以我们需要安装libbsd-devel
,安装完后再次执行make就能顺利编译。
[root@centos8 pg_top-master]# yum install libbsd-devel
[root@centos8 pg_top-master]# make
[ 7%] Building C object CMakeFiles/pg_top.dir/machine/m_remote.c.o
[ 14%] Building C object CMakeFiles/pg_top.dir/machine/m_common.c.o
[ 21%] Building C object CMakeFiles/pg_top.dir/machine/m_linux.c.o
[ 28%] Linking C executable pg_top
[100%] Built target pg_top
[root@centos8 pg_top-master]# make install
[100%] Built target pg_top
Install the project...
-- Install configuration: ""
-- Installing: /usr/local/bin/pg_top
-- Installing: /usr/local/share/man/man1/pg_top.1复制
PG_TOP使用
使用pg_top进行数据库监控。和登录本地数据库一样,设置-U指定登录用户,-d指定数据库,-h指定主机名,-p指定端口。
[root@centos8 bin]# pg_top --help
pg_top monitors a PostgreSQL database cluster.
Usage:
pg_top [OPTION]... [COUNT]
General options:
-b, --batch use batch mode
-c, --show-command display command name of each process
-C, --color-mode turn off color mode
-i, --interactive use interactive mode
-I, --hide-idle hide idle processes
-n, --non-interactive use non-interactive mode
-o, --order-field=FIELD select sort order
-r, --remote-mode activate remote mode
-R display replication stats
-s, --set-delay=SECOND set delay between screen updates
-T, --show-tags show color tags
-V, --version output version information, then exit
-x, --set-display=COUNT set maximum number of displays
exit once this number is reached
-X display i/o stats
-z, --show-username=NAME display only processes owned by given
username
-?, --help show this help, then exit
Connection options:
-d, --dbname=DBNAME database to connect to
-h, --host=HOSTNAME database server host or socket directory
-p, --port=PORT database server port
-U, --username=USERNAME user name to connect as
-W, --password force password prompt, and persistent connection
[root@centos8 bin]# pg_top -U hr -d hr -h localhost -p 5432复制
执行结果如下图所示。
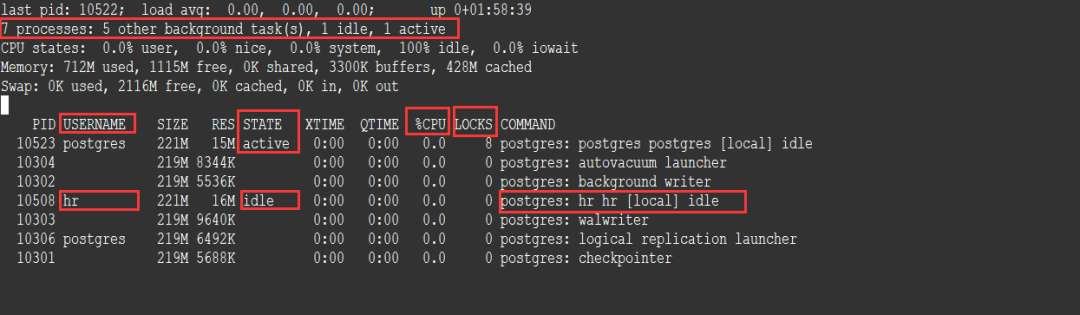
这里最上面会进程数量。后台进程有多少个,活动的进程有多少个,idle的进程有多少个。还可以看到主机的cpu和内存使用情况。下面是当前PostgreSQL进程的pid,用户名,状态,XTIME代表事务时间,QTIME代表query执行时间,还有cpu百分比和锁的数量。后面的COMMAND代表进程和它的操作类型。
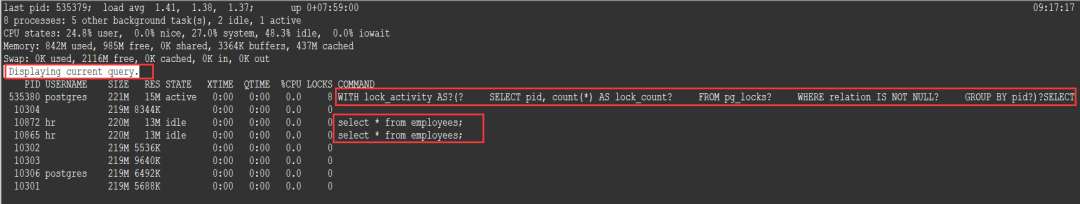
你可以按一下c,就会显示这些进程执行的详细SQL语句。
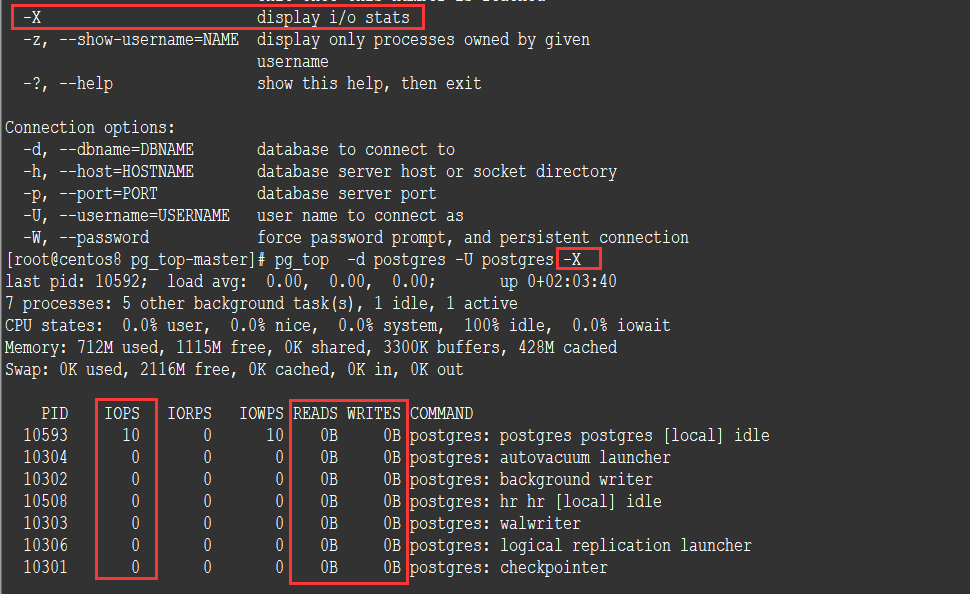
你也可以在运行pg_top时指定-X参数,它可以显示每个进程的I/O信息。例如iops、Reads、Writes。能够监控到高耗I/O的进程。
如果你想查看复制信息,可以使用-R参数。
在进入监控的界面按h,还会出现隐藏的一些指令。
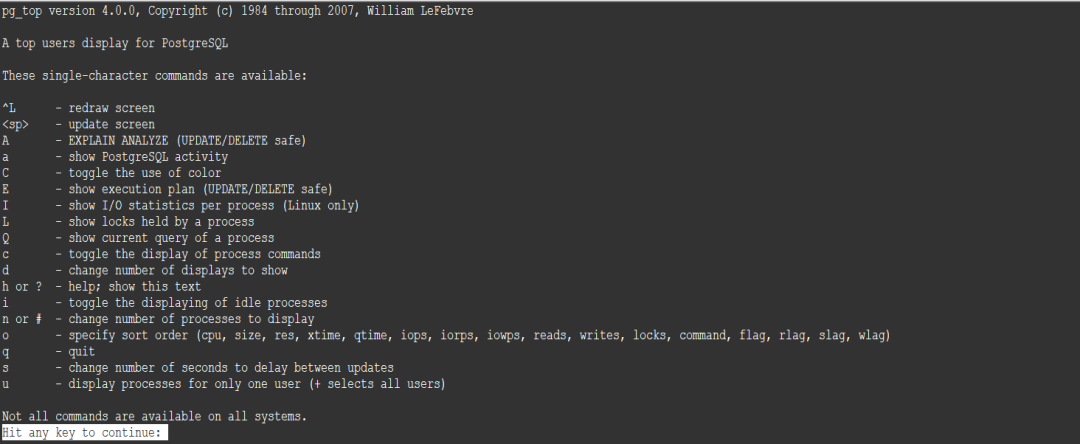
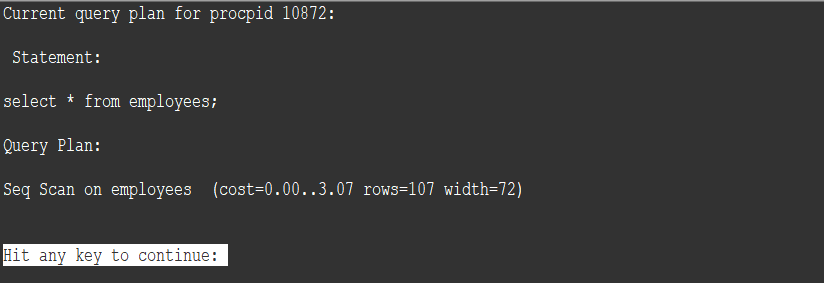
例如按Q输入进程号可以查看单个进程执行SQL语句。按E可以查看该进程运行SQL的执行计划。
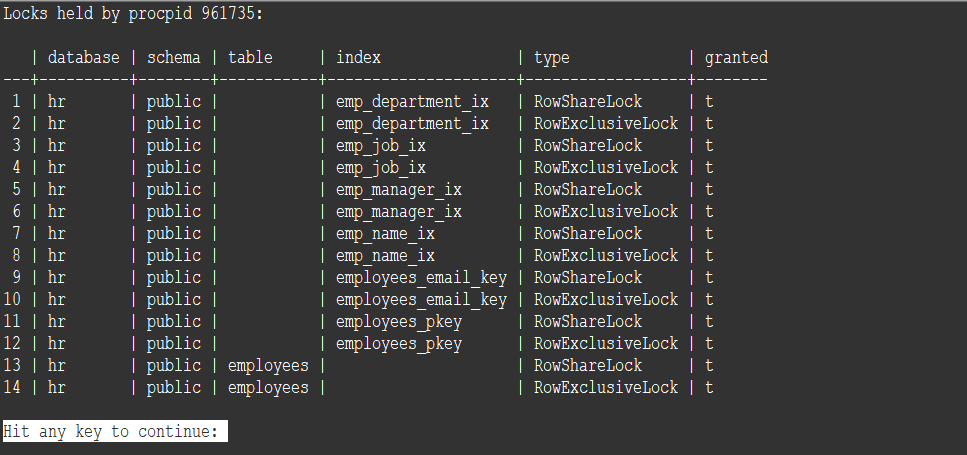
按L输入进程号可以查看锁信息。
当然还有一个比较有用的功能,它可以像oswatch一样工作。-x 后面指定次数,然后把该结果重定向到一个文件。通过grep对这个文件进行过滤,我们可以找出系统发生性能变化的准确时间点和波动的趋势。
pg_top -U hr -d hr -b -x 10 > pg.out
[root@centos8 bin]# cat pg.out | grep -i processes
11 processes: 5 other background task(s), 4 idle, 1 active, 1 idle txn
10 processes: 5 other background task(s), 3 idle, 1 active, 1 idle txn
11 processes: 5 other background task(s), 4 idle, 1 active, 1 idle txn
11 processes: 5 other background task(s), 4 idle, 1 active, 1 idle txn
10 processes: 5 other background task(s), 3 idle, 1 active, 1 idle txn
11 processes: 5 other background task(s), 4 idle, 1 active, 1 idle txn
10 processes: 5 other background task(s), 3 idle, 1 active, 1 idle txn
11 processes: 5 other background task(s), 4 idle, 1 active, 1 idle txn
10 processes: 5 other background task(s), 3 idle, 1 active, 1 idle txn
11 processes: 5 other background task(s), 4 idle, 1 active, 1 idle txn
[root@centos8 bin]# cat pg.out | grep -i "CPU states" | awk -F ',' '{print $1,$3,$4}'
CPU states: 26.1% user 25.6% system 48.3% idle
CPU states: 25.8% user 25.7% system 48.5% idle
CPU states: 25.0% user 26.5% system 48.5% idle
CPU states: 25.4% user 26.2% system 48.4% idle
CPU states: 25.8% user 25.8% system 48.4% idle
CPU states: 25.9% user 25.8% system 48.3% idle
CPU states: 25.1% user 26.7% system 48.2% idle
CPU states: 25.3% user 26.6% system 48.1% idle
CPU states: 25.0% user 26.3% system 48.7% idle
CPU states: 25.4% user 26.3% system 48.3% idle复制
pg_top还可以监控remote主机的信息,这需要在remote主机上安装pg_proctab
插件,只有安装插件才能查询remote主机的cpu、内存等信息,
[root@centos8 ~]# pg_top -r -U postgres -d postgres -h 192.168.56.143 -p 5432 -W
Password:
Stored function 'pg_cputime' is missing.复制
出现这个提示就是需要你在远程数据库上安装「pg_proctab」插件。
git https://gitlab.com/pg_proctab/pg_proctab.git
cd pg_proctab
make && make install
[postgres@centos8 ~]$ psql
psql (13.1)
Type "help" for help.
postgres=# create extension pg_proctab;
CREATE EXTENSION复制
安装完再次执行就没有这个报错了。

后记
到此为止,pg_top的基本功能讲解就结束了,据说Google编程之夏(GSoC)会对该项目进行增强,拭目以待哦。推荐参考资料:
1.https://pg_top.gitlab.io/
2.https://github.com/markwkm/pg_proctab


励志成为PostgreSQL大神
长按关注吧
评论

 0 点赞
0 点赞