


今天借助一个例子继续讲ASH的用法。
客户报告: 一个RAC构成的环境,在11:20左右开始处理慢。 提供资料: AWR Report ASH 请求事项: 原因确认 解决方法复制
先简单看一AWR Report 的总体状况。
・Node1 DB Time: 967.74 (mins) ・Node2 DB Time: 414.41 (mins) ・Node3 DB Time: 354.11 (mins) ・Node4 DB Time: 460.29 (mins) ・Node5 DB Time: 551.66 (mins)复制
根据以上的信息,可以看到Node1的“DB Time : 967.74 (mins)”,Node2–Node5 的两倍左右。
所以,我们可以看看每个INSTANCE的“Top 5 Timed Foreground Events”。
・Node1 Top 5 Timed Foreground Events ~~~~~~~~~~~~~~~~~~~~~~~~~~~~~ Avg wait % DB Event Waits Time(s) (ms) time Wait Class ------------------------------ ------------ ----------- ------ ------ ---------- db file sequential read 4,893,299 26,714 5 46.0 User I/O log file sync 476,854 6,132 13 10.6 Commit DB CPU 5,009 8.6 Disk file operations I/O 163,640 4,128 25 7.1 User I/O gc current block 3-way 2,866,969 3,163 1 5.4 Cluster ・Node2 Top 5 Timed Foreground Events ~~~~~~~~~~~~~~~~~~~~~~~~~~~~~ Avg wait % DB Event Waits Time(s) (ms) time Wait Class ------------------------------ ------------ ----------- ------ ------ ---------- gc cr block busy 256,891 4,668 18 18.8 Cluster DB CPU 4,613 18.6 db file sequential read 3,089,328 3,822 1 15.4 User I/O gc current block 3-way 2,533,718 2,717 1 10.9 Cluster gc cr grant 2-way 2,424,954 1,698 1 6.8 Cluster ・Node3 Top 5 Timed Foreground Events ~~~~~~~~~~~~~~~~~~~~~~~~~~~~~ Avg wait % DB Event Waits Time(s) (ms) time Wait Class ------------------------------ ------------ ----------- ------ ------ ---------- DB CPU 4,368 20.6 gc cr block busy 241,547 4,166 17 19.6 Cluster db file sequential read 2,272,733 2,652 1 12.5 User I/O gc current block 3-way 2,123,690 2,157 1 10.2 Cluster Disk file operations I/O 227,537 1,604 7 7.5 User I/O ・Node4 Top 5 Timed Foreground Events ~~~~~~~~~~~~~~~~~~~~~~~~~~~~~ Avg wait % DB Event Waits Time(s) (ms) time Wait Class ------------------------------ ------------ ----------- ------ ------ ---------- db file sequential read 5,651,562 6,052 1 21.9 User I/O DB CPU 5,315 19.2 gc cr block busy 195,097 3,457 18 12.5 Cluster gc cr grant 2-way 4,318,113 2,704 1 9.8 Cluster gc current block 3-way 2,451,795 2,571 1 9.3 Cluster ・Node5 Top 5 Timed Foreground Events ~~~~~~~~~~~~~~~~~~~~~~~~~~~~~ Avg wait % DB Event Waits Time(s) (ms) time Wait Class ------------------------------ ------------ ----------- ------ ------ ---------- db file sequential read 5,631,340 6,850 1 20.7 User I/O DB CPU 5,586 16.9 gc cr block busy 230,530 4,129 18 12.5 Cluster gc current block 3-way 3,321,250 3,498 1 10.6 Cluster gc cr grant 2-way 4,412,873 2,792 1 8.4 Cluster复制
看到这里,因为所有INSTANCE的待机EVENT都和I/O关联,基本上可以判断为是业务处理集中的问题。
下面就需要仔细分析ASH数据,找到能证明结论的东西。
首先,我们看一下分钟单位的Active Session数。
◆SQL文 SQL> select to_char(sample_time,'yyyy/mm/dd hh24:mi'),count(*) from m_dba_hist_active_sess_history where instance_number=<&instance_number> group by to_char(sample_time,'yyyy/mm/dd hh24:mi') order by to_char(sample_time,'yyyy/mm/dd hh24:mi');复制
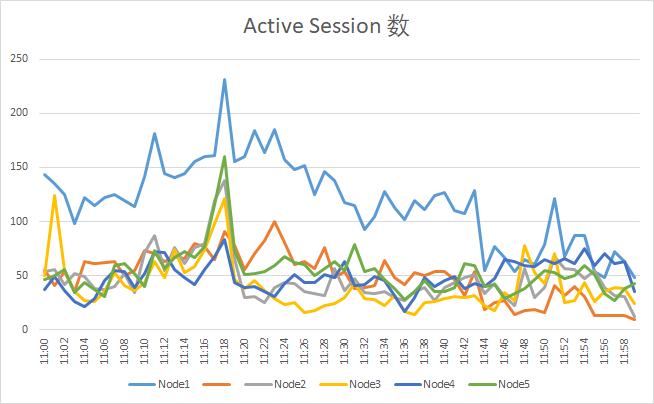
通过上面曲线图,我们可以清晰的看到在11:18 ,所有INSTANCE的Active Session数都有不同程度的增加。
然后,针对增长程度最大的Node1进行进一步的分析。先来看看Active Session的 PROGRAM分布情况。
经过简单的分析,我们可以知道通过 sqlplus 和 JDBC Thin Client 连上来的SESSION数量最大,并且增长幅度最大。
SQL> select to_char(sample_time,'yyyy/mm/dd hh24:mi'),count(*) from m_dba_hist_active_sess_history where instance_number=1 and PROGRAM like 'sqlplus%' group by to_char(sample_time,'yyyy/mm/dd hh24:mi') having count(*)>10 order by to_char(sample_time,'yyyy/mm/dd hh24:mi'); TO_CHAR(SAMPLE_TIME,'YYYY/MM/DDHH24:MI') COUNT(*) ------------------------------------------------ ---------- 。。。 。。。 2021/03/22 11:14 12 2021/03/22 11:15 12 2021/03/22 11:16 12 2021/03/22 11:17 12 2021/03/22 11:18 24 ★SESSION数增加1倍 2021/03/22 11:19 22 2021/03/22 11:20 26 2021/03/22 11:21 19 2021/03/22 11:22 16 2021/03/22 11:23 18 2021/03/22 11:24 17 2021/03/22 11:25 18 2021/03/22 11:26 18 2021/03/22 11:27 20 2021/03/22 11:28 22 2021/03/22 11:29 21 2021/03/22 11:30 23 。。。 。。。 SQL> select to_char(sample_time,'yyyy/mm/dd hh24:mi'),count(*) 2 from m_dba_hist_active_sess_history 3 where instance_number=1 4 and PROGRAM like 'JDBC Thin Client' 5 group by to_char(sample_time,'yyyy/mm/dd hh24:mi') having count(*)>10 order by to_char(sample_time,'yyyy/mm/dd hh24:mi'); 6 7 TO_CHAR(SAMPLE_TIME,'YYYY/MM/DDHH24:MI') COUNT(*) ------------------------------------------------ ---------- 。。。 。。。 2021/03/22 11:13 99 2021/03/22 11:14 104 2021/03/22 11:15 116 2021/03/22 11:16 118 2021/03/22 11:17 119 2021/03/22 11:18 168 ★増加した 2021/03/22 11:19 100 2021/03/22 11:20 100 2021/03/22 11:21 137 2021/03/22 11:22 121 2021/03/22 11:23 134 2021/03/22 11:24 113 2021/03/22 11:25 108 2021/03/22 11:26 119 2021/03/22 11:27 89 2021/03/22 11:28 107 2021/03/22 11:29 100 。。。 。。。复制
到现在为止,基本上可以判定为11:18左右,通过 sqlplus 和 JDBC Thin Client 连上来的SESSION数过于集中,
引起了I/O处理过多,导致了这次问题的发生。
那这种问题应该如何处理呢?
有下面两个方向:
1. 分散业务处理。 2. 找到I/O多的具体处理,看看有没有I/O少的方法。复制
第2个方向涉及SQL TUNING 的知识,这里不再细说了。
2021/03/23 @ Dalian
【版权声明】本文为墨天轮用户原创内容,转载时必须标注文章的来源(墨天轮),文章链接,文章作者等基本信息,否则作者和墨天轮有权追究责任。如果您发现墨天轮中有涉嫌抄袭或者侵权的内容,欢迎发送邮件至:contact@modb.pro进行举报,并提供相关证据,一经查实,墨天轮将立刻删除相关内容。
评论
不了峰

4年前
评论
 0
0来自日本的数据库?
4年前
点赞 评论
相关阅读
【纯干货】Oracle 19C RU 19.27 发布,如何快速升级和安装?
Lucifer三思而后行
786次阅读
2025-04-18 14:18:38
Oracle RAC 一键安装翻车?手把手教你如何排错!
Lucifer三思而后行
664次阅读
2025-04-15 17:24:06
Oracle数据库一键巡检并生成HTML结果,免费脚本速来下载!
陈举超
591次阅读
2025-04-20 10:07:02
【ORACLE】你以为的真的是你以为的么?--ORA-38104: Columns referenced in the ON Clause cannot be updated
DarkAthena
548次阅读
2025-04-22 00:13:51
【活动】分享你的压箱底干货文档,三篇解锁进阶奖励!
墨天轮编辑部
532次阅读
2025-04-17 17:02:24
【ORACLE】记录一些ORACLE的merge into语句的BUG
DarkAthena
510次阅读
2025-04-22 00:20:37
一页概览:Oracle GoldenGate
甲骨文云技术
496次阅读
2025-04-30 12:17:56
火焰图--分析复杂SQL执行计划的利器
听见风的声音
470次阅读
2025-04-17 09:30:30
OR+DBLINK的关联SQL优化思路
布衣
382次阅读
2025-05-05 19:28:36
3月“墨力原创作者计划”获奖名单公布
墨天轮编辑部
382次阅读
2025-04-15 14:48:05


