


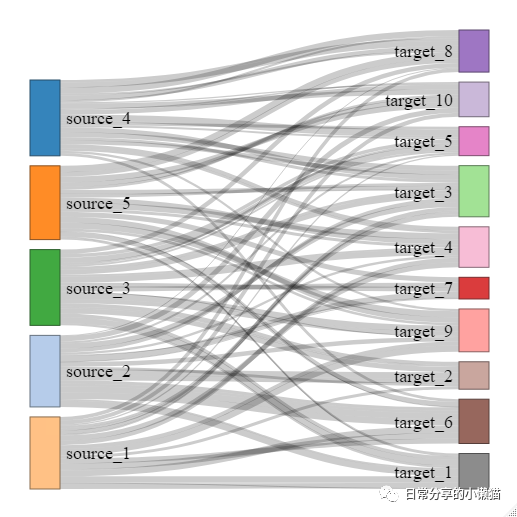
桑基图(Sankey diagram) 是用于描述一组值到另一组值流向的图表。因1898年Matthew Henry Phineas Riall Sankey绘制的“蒸汽机的能源效率图”而闻名[1]。桑基图主要关注能量、物料或资本等在系统内部的流动和转移情况。
1、数据准备
数据共3列,一列为source,一列为target,一列为value。
install.packages("dplyr")
install.packages("webshot")
install.packages("networkD3")
library(dplyr)
library(webshot)
library(networkD3)
setwd("C:\\Users\\Acer\\Desktop")
set.seed(1234)
sankey <- data.frame(
  source = paste0("source_",1:5) %>% sample(100, replace = TRUE),
  target = paste0("target_", 1:10) %>% sample(100, replace = TRUE),
  value = runif(100, 1, 10))
head(sankey) # c("source", "target", "value")
#    source    target    value
#1 source_4  target_3 7.605047
#2 source_2  target_7 8.940873
#3 source_5  target_9 9.580119
#4 source_4  target_8 2.754114
#5 source_1  target_3 5.253551
#6 source_5 target_10 4.474456

sankey <- sankey %>% mutate_if(is.character, as.factor) # convert to factor
nodes <- data.frame(node = c(sankey$source, sankey$target)) %>% unique() #node label
sankey$IDsource <- match(sankey$source, nodes$node) - 1 # start from 0
sankey$IDtarget <- match(sankey$target, nodes$node) - 1 # start from 0
head(sankey)
#    source    target    value IDsource IDtarget
#1 source_4  target_3 7.605047        0        5
#2 source_2  target_7 8.940873        1        6
#3 source_5  target_9 9.580119        2        7
#4 source_4  target_8 2.754114        0        8
#5 source_1  target_3 5.253551        3        5
#6 source_5 target_10 4.474456        2        9
2、图形绘制
sankeyNetwork(Links = sankey, Nodes = nodes,
              Source = "IDsource", Target = "IDtarget", Value = "value", NodeID = "node",
              fontSize= 18, nodeWidth = 30)
3、图形保存
利用networkD3包中的saveNetwork()
函数以及webshot包中的webshot()
函数可将图形进一步保存为html
格式以及pdf
格式。
sankeyplot <-
sankeyNetwork(Links = sankey, Nodes = nodes,
              Source = "IDsource", Target = "IDtarget", Value = "value", NodeID = "node",
              fontSize= 18, nodeWidth = 30)
saveNetwork(sankeyplot, file = "sankeyplot.html") #save to html
webshot::webshot("sankeyplot.html", file =  "sankeyplot.pdf", vwidth = 500, vheight = 500) #save to pdf
4、其他
关于sankeyNetwork()
绘图函数的详细使用介绍可在R中通过help()
函数查看。其他绘图方法可进一步阅读公众号其他文章。
如有帮助请多多点赞哦!
参考资料
Matthew Henry Phineas Riall Sankey: "https://en.wikipedia.org/wiki/Matthew_Henry_Phineas_Riall_Sankey
文章转载自日常分享的小懒猫,如果涉嫌侵权,请发送邮件至:contact@modb.pro进行举报,并提供相关证据,一经查实,墨天轮将立刻删除相关内容。
