


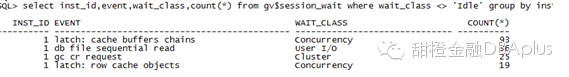
如果系统中出现了大量的latch:cache buffers chains等待事件,并且查看cpu的使用率都较平常升高了不少,该如何应对,本文,学习下该等待事件的原理,现象,解决方法。
1 buffer cache 内存管理
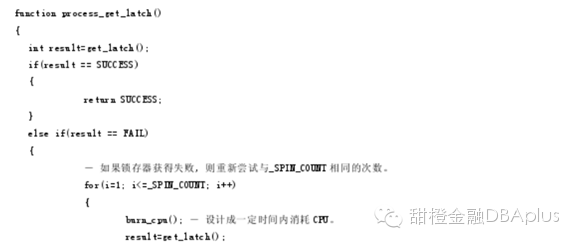
oracle为了有效管理buffer cache,使用hash chain的结构,这个hash chain是位于share pool里面的,使用的是 bucket->chain->header结构。
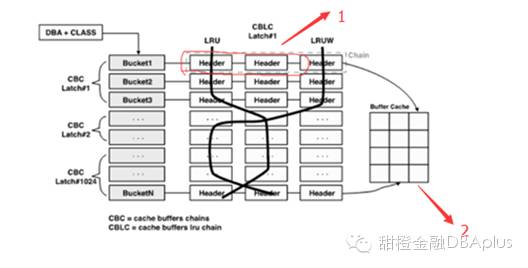
请注意上面图中1和2两个区域,分别存储在sharepool和buffer cahce中。
先明白一点,hash chain结构利用cache buffers chain latch来保护,当进程扫描特定的数据块时,必须获得相应数据块所在的hash chain管理的cache buffers chain latch(简称CBC latch)。基本上一个进程获得仅有的一个cache buffers chainlatch。在获得这个latch的过程中如果发生了争用,在此过程中就会有
Latch :cachebuffers chains的等待事件。Oracle 9i开始,将cache buffers chains latch以shared模式获得,但只限于只读操作,所以,同时执行只读操作的进程之间能共享这个latch,而对缓冲区获得和释放buffer lock时,需要把cache buffers chains锁存器以exclusive模式获得。所以即便在执行只读操作时,也会发生cache buffers chains latch的争用。
假设,如果有20个进程同时查询红色框中的块的时候,这20个进程都要获得同一个CBC latch#1,因此时这个latch是shared模式获得的,不存在争用,但是对缓冲区获得和释放buffer lock时(我们知道,hash chain上是buffer header,块的实际信息实在buffer cache中,在红色框中2这个区域,对实际块的读取操作要获得和释放buffer lock),需要对CBC latch#1以独占模式获得,这会阻塞其它的进程或的latch,此时很容易造成latch :cache buffers chains 的争用。
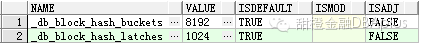
CBC latch 和hash_buckets的数量是由以下的隐含参数控制的。
2 相关视图
学习latch的知识,当然要了解和掌握些oracle的相关视图。
V$LATCH:V$LATCH displays aggregate latch statistics for bothparent and child latches, grouped by latch name. Individual parent and childlatch statistics are broken down in theviews V$LATCH_PARENT and V$LATCH_CHILDREN.
V$LATCH_CHILDREN:V$LATCH_CHILDREN displays statistics about childlatches. This view includes all columns of V$LATCH plusthe CHILD# column. Note that child latches have the same parent iftheir LATCH# columns match each other。
比如CBC chain在我的测试库里面总共有1024个,则这个视图里面就会详细的记录每个chain的状况。
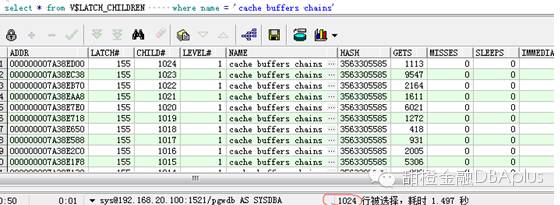
通过这个视图,详细的查看每个latch的使用情况。
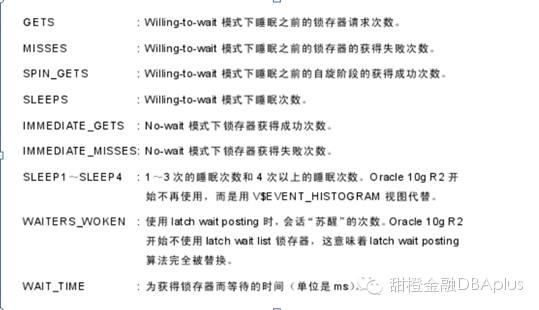
假如在1024个 CBC LATCH中,对特定编号的子锁存器的GETS请求较高,则表示相应锁存器所管辖的hash chain上具有 hot block。通过misses/gets值和immediate_misses/(immediate_gets+immediate_misses)值小于1%,也可以判断发生了锁存器争用。也可以利用 wait_time字段,当等待时间大于cpu时间一定的值时,也可以判断发生了锁存器的争用。
V$BH :displays thestatus and number of pings for every buffer in the SGA. This is a RealApplication Clusters view.
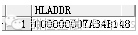
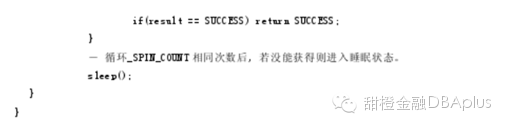
X$BH Fixed Table Buffer Cache Diagram
ADDR RAW(4) Hex address of the Buffer Header.
INDX NUMBER Buffer Header number
BUF# NUMBER
HLADDR RAW(4) Hash Chain Latch Address
TS# NUMBER 8.X Tablespace number
DBARFIL NUMBER 8.X Relative file number of block
DBAFIL NUMBER 7.3 File number of block
DBABLK NUMBER Block number of block
OBJ NUMBER Data object number
TCH NUMBER 8.1 Touch Count
3 实验
实验1:latch 的模式(shared,exclusive)
createtabletest(idint,namevarchar2(10));
insertintotestvalues(1,'liushuai');
select t.rowid,
dbms_rowid.rowid_relative_fno(rowid) file#,
dbms_rowid.rowid_block_number(rowid) block#,
id,
name
frommepf_dev.test t
where id = 1

select hladdr from x$bh where file#=20and dbablk=6987
select addr,name,gets from v$latch_children t where addr='000000007A34B148';
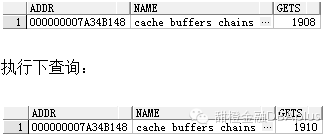
执行一次逻辑读,发现gets增加了2次,这里说明一次逻辑读要加两次CBC Latch,一次为了加Buffer Pin,一次为了释放Buffer Pin!
实验2:hot block
create table test1 (id number,name char(20));
begin
for i in1..100000 loop
insert into test1 values(i,'liushuai');
end loop;
commit;
end;
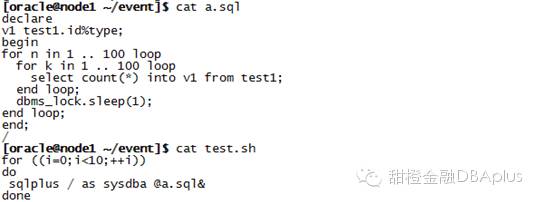
用上面的脚本实现10个进程并发测试。
select name,gets,misses from v$latch where name='cachebuffers chains;
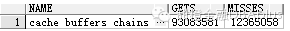
我们可以看到,misses数瞬间增大到了这么多。
select a.owner, a.segment_name,count(*)
from dba_extents a,
(select dbarfil, dbablk
from x$bh
where hladdr in
(select addr from(select addr
from v$latch_children
orderby misses desc)whererownum<11)) b
where a.relative_fno = b.dbarfil
and a.block_id <= b.dbablk
and a.block_id + a.blocks > b.dbablk
groupby a.owner, a.segment_name
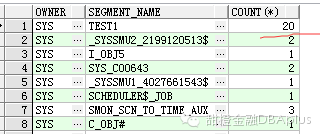
其中test1表是我们自己的业务表。有20个块,因为我们只取了前几位的latch地址。可以判断test1为热点。虽然test1表在内存中,我们可以命中,但要读取,还要通过latch,如果应用太集中,都访问一个表,必然造成这个结果。现在不是内存小了,而是访问模式太集中了,现象为cpu的负载过高。latch丢失严重。解决的办法为分散应用,优化sql.
4 案例分享
4.1)案例现象
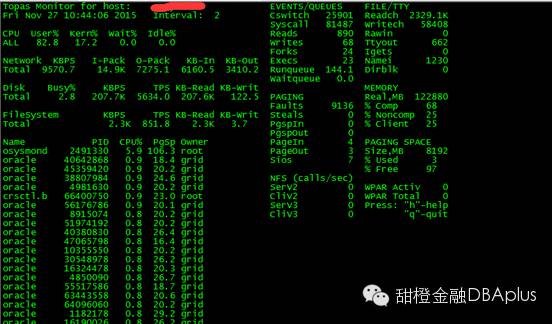
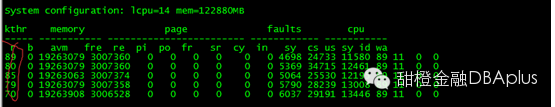
发现等待的进程非常多,远远超过了cpu的数量。可以看到user cpu很高,并且kern cpu也有所增高。
故障分析:
select *
from (select sql_text, sql_id, cpu_time
from v$sqlarea
order by cpu_time desc)
where rownum <= 10
order by rownum asc;
使用如上sql大致看下排名前10位的消耗cpu的语句。
最终发现了几条sql的并发量很大,并且执行计划很差,几乎都是全表扫描。
4.2)案例解决:
以下是相关sql,以及sql的改写。
88sbs8c1rprg8:
FROM xxx tp
LEFT JOIN xxx tm
ON tm.xxx= SUBSTR(tp.xxx, 1, 7)
LEFT JOIN xxx tda
ON tda.xxx= tm.xxx
WHERE 1 = 1
AND LENGTH(tp.xxx) = 11
AND SUBSTR(tp.xxx, 1, 14) BETWEEN to_char(:3, 'yyyyMMddHH24miss') and
to_char(:4, 'yyyyMMddHH24miss')
AND tp.xxx= '07'
GROUP BY tda.xxx, tda.xxx
3s6ck2jwv919q
select count(*) xxx,sum(AVAILABLE_BALANCE)/100 xxx,
round( SUM(CASE WHEN xxx='00' then 1 else 0 end)/count(*)*100,2) xxx
from xxx
where
xxx is not null
and substr(xxx,0,12) >= to_char(to_date(:1 ,'YYYY-MM-DD HH24:MI:SS'),'YYYYMMDDHH24MISS')
and substr(xxx,0,12) < to_char(to_date(:2 ,'YYYY-MM-DD HH24:MI:SS'),'YYYYMMDDHH24MISS')
A:去掉substr函数,B:业务沟通添加分区字段
注意,使用函数不会走索引,并且频繁使用函数,会消耗过多的cpu。
SELECT o.xxx, count(o.referee)
FROM xxx o
join (SELECT i.xxx, sum(i.xxx) ljsy1
FROM xxx i
where i.xxx<= '2015-11-23' --1
and i.xxx>= '2015-07-01'
group by i.xxx) tt
on o.xxx= tt.xxx
join (SELECT i.xxx, sum(i.xxx) ljsy2
FROM xxx i
where i.xxx<= '2015-11-24' --2
and i.xxx>= '2015-07-01'
group by i.xxx) ttt
on o.xxx= ttt.xxx
where to_char(o.xxx, 'yyyy-MM-dd') >= '2015-09-01'
and tt.xxx< 1
and ttt.xxx>= 1
and o.xxx= '350000'
*and o.xxx!='510100' */
and o.xxx!= '07'
group by o.xxx
union all
SELECT o.xxx, count(o.xxx)
FROM xxx o
join (SELECT i.xxx, sum(i.xxx) ljsy1
FROM xxx i
where i.xxx <= '2015-11-23' --1
and i.xxx >= '2015-07-01'
group by i.xxx) tt
on o.xxx= tt.xxx
join (SELECT i.xxx, sum(i.xxx) ljsy2
FROM xxx i
where i.xxx <= '2015-11-24' --2
and i.xxx >= '2015-07-01'
group by i.xxx) ttt
on o.xxx= ttt.xxx
where to_char(o.xxx, 'yyyy-MM-dd') >= '2015-09-01'
and tt.xxx< 1
and ttt.xxx>= 1
and o.xxx!= '350000'
/*and o.xxx!='510100' */
group by o.referee;
经过和业务沟通,多次改写 后的sql如下:(3分钟可出结果)
SELECT o.xxx, count(o.xxx)
FROM xxxo
where o.xxx>= to_date('2015-09-01', 'yyyy-mm-dd')
and ((o.xxx= '350000' and o.xxx!= '07') or
o.xxx!= '350000')
and exists (SELECT 1
FROM xxx i
where i.xxx= '2015-11-24' --2
and i.xxx> 0
and i.xxx= o.xxx)
and not exists (SELECT i.xxx
FROM xxx i
where i.xxx<= '2015-11-23' --1
and i.xxx>= '2015-10-01'
and i.xxx >=1
and i.xxx = o.xxx)
group by o.xxx;
以上sql经过改写,执行计划均有很大的提升,并且逻辑读大大降低。同时限制并发数量。
(注意本文这次不讲sql优化,只是对该等待事件的解决提供思路,要结合业务优化sql)
案例总结:
latch:cachebuffers chains 等待事件会严重占用user cpu和sys cpu。
大部分是由于并发比较多的执行计划有待改进的sql引起的,此时,需要优化sql,限制并发,降低热点块的访问程度,大部分都能减轻该等待事件。
最后阐述下该等待事件,为什么cpu会升高。
latch的获得的原理如下图:
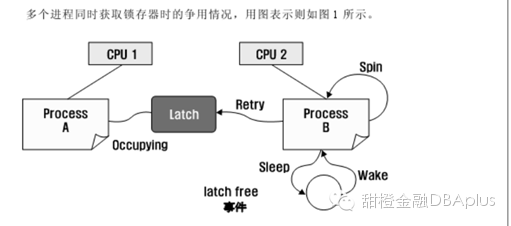
最初的的latch 获得失败后不会马上睡眠,而是自旋(spin),其理由是:
第一,因为期待其它的进程在很短时间内释放latch;第二,因为如果陷入睡眠状态,在os层面上会发生context switching(上下文切换),这部分的资源消耗比起使用较少的cpu进行自旋更多。为了在执行自旋过程中,以活动的状态继续占有cpu,执行一连串简单的命令语句,因此一定时间内要占有少量的cpu(burn_cpu),所以latch争用而发生进程同时自选时,cpu使用率可能较高。注意:latch争用发生时,较高的cpu使用率不是实际工作过程中发生的,而是在为获得latch而自旋过程中引发的。
第二:如果自旋结束还没有获得latch,则进程进入休眠状态,这意味者进程放弃对cpu的使用,此时就发生了 context switch(上下文切换),这部分消耗是算在 kern cpu上的,所以kerncpu也会增高。包括进程被唤醒的时候,同样也发生了context switch。
