


kubernetes 的TCP 数据包可视化
介绍
k8spacket
是用 Golang 编写的工具,它使用gopacket
第三方库来嗅探工作负载(传入和传出)上的 TCP 数据包。它在运行的容器网络接口上创建 TCP 侦听器。当 Kubernetes 创建一个新容器时,CNI 插件负责提供与其他容器进行通信的可能性。最常见的方法是用linux namespace
隔离网络并用veth pair
连接隔离的 namespace
与网桥。除了bridge
类型,CNI 插件还可以使用其他类型(vlan
, ipvlan
,macvlan
),但都为容器创建了一个网络接口,它是k8spacket
嗅探器的主要句柄。
k8spacket
有助于了解 Kubernetes 集群中的 TCP 数据包流量:
显示集群中工作负载之间的流量
通知流量在集群外路由到哪里
显示有关连接关闭套接字的信息
显示工作负载发送/接收的字节数
计算建立连接的时间
显示整个集群中工作负载之间的网络连接拓扑
k8spacket
是一个 Kubernetes API 客户端,可以将嗅探到的工作负载解析为可视化上可见的集群资源名称(Pods
和Services
)。它作为DaemonSet Pod
启动,使用 hostNetwork
,并监听节点上的网络接口。
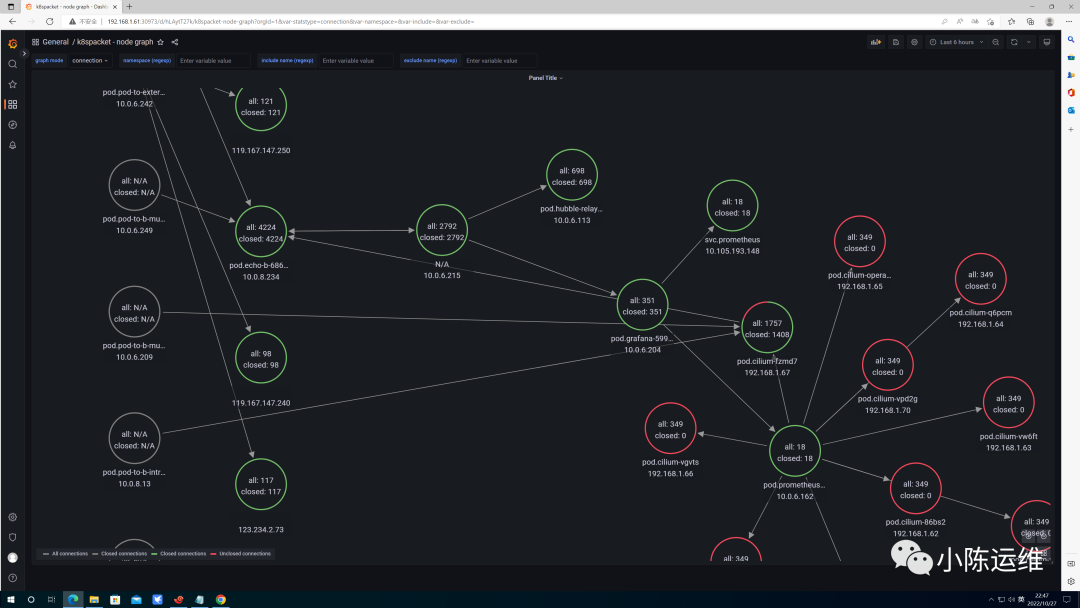
k8spacket
收集 TCP 流、处理数据,使用 Node Graph API Grafana 数据源插件(详情请查看 Node Graph API 插件),通过 API 展示在Grafana
面板。
要安装k8spacket
,需要同时安装 Grafana。下面将在Kind
安装的 k8s 集群上做演示。
添加 k8spacket 的helm源
[root@k8s-master-1 ~]# helm repo add k8spacket https://k8spacket.github.io/k8spacket-helm-chart"k8spacket" has been added to your repositories[root@k8s-master-1 ~]#[root@k8s-master-1 ~]#[root@k8s-master-1 ~]#[root@k8s-master-1 ~]# helm install k8spacket --namespace k8spacket k8spacket/k8spacket --create-namespaceNAME: k8spacketLAST DEPLOYED: Thu Oct 27 18:48:30 2022NAMESPACE: k8spacketSTATUS: deployedREVISION: 1TEST SUITE: NoneNOTES:1. Get the application URL by running these commands:export NODE_PORT=$(kubectl get --namespace k8spacket -o jsonpath="{.spec.ports[0].nodePort}" services k8spacket)export NODE_IP=$(kubectl get nodes --namespace k8spacket -o jsonpath="{.items[0].status.addresses[0].address}")echo http://$NODE_IP:$NODE_PORT[root@k8s-master-1 ~]#复制
查看 pod 信息
root@hello:~# kubectl get pod -n k8spacketNAME READY STATUS RESTARTS AGEk8spacket-46587 0/1 CrashLoopBackOff 2 (23s ago) 2m24sk8spacket-9wb5q 0/1 CrashLoopBackOff 1 (6s ago) 2m24sk8spacket-grh7k 0/1 ImagePullBackOff 0 2m24sk8spacket-hcgg4 0/1 CrashLoopBackOff 1 (4s ago) 2m24sk8spacket-ng99p 0/1 CrashLoopBackOff 1 (3s ago) 2m24sk8spacket-p7hgb 0/1 CrashLoopBackOff 1 (4s ago) 2m24sk8spacket-pk4zt 0/1 CrashLoopBackOff 1 (4s ago) 2m24sk8spacket-tcksl 0/1 CrashLoopBackOff 1 (6s ago) 2m24sk8spacket-tkzcc 0/1 CrashLoopBackOff 1 (8s ago) 2m24sk8spacket-w8r5r 0/1 CrashLoopBackOff 3 (11s ago) 2m24sroot@hello:~#复制
查看报错为 tunl0 问题
[root@k8s-master-1 ~]# kubectl logs -n k8spacket k8spacket-465872022/10/27 13:35:36 Serving requests on port 66762022/10/27 13:35:36 Refreshing interfaces for capturing...2022/10/27 13:35:36 Starting capture on interface "cilium_host"2022/10/27 13:35:36 Starting capture on interface "tunl0"2022/10/27 13:35:36 Starting capture on interface "lxc_health"2022/10/27 13:35:36 Starting capture on interface "cilium_net"2022/10/27 13:35:36 Starting capture on interface "lxcaaf84592af2d"2022/10/27 13:35:36 Starting capture on interface "lxcc06519232b44"2022/10/27 13:35:36 reading in packets2022/10/27 13:35:36 reading in packets2022/10/27 13:35:36 error opening pcap handle: tunl0: That device is not up[root@k8s-master-1 ~]#复制
修改配置
# 将 charts 包拉取到本地 在进行修改信息[root@k8s-master-1 ~]# cd tmp/[root@k8s-master-1 tmp]# helm fetch k8spacket/k8spacket[root@k8s-master-1 tmp]# tar -zxf k8spacket-0.1.3.tgz[root@k8s-master-1 tmp]# cd k8spacket# 设置配置为command: "ip address | grep @ | grep -v tunl0 | sed -E 's/.* (\\w+)@.*/\\1/' | tr '\\n' ',' | sed 's/.$//'"# 完整配置如下[root@k8s-master-1 k8spacket]# vim values.yaml[root@k8s-master-1 k8spacket]# cat values.yamlreplicaCount: 1affinity: {}image:repository: docker.io/k8spacket/k8spacketpullPolicy: IfNotPresentserviceAccount:create: true# Annotations to add to the service accountannotations: {}clusterRole:create: truenodeSelector: {}podAnnotations: {}priorityClassName: ""podSecurityContext:runAsUser: 1000securityContext:allowPrivilegeEscalation: truecapabilities:add: [ "NET_ADMIN", "NET_RAW" ]service:type: ClusterIPport: 8080nodePort:resources:requests:memory: "1000Mi"cpu: "250m"limits:memory: "1500Mi"cpu: "500m"tolerations: []k8sPacket:metrics:## Hide source port when 'true' (set to string value 'dynamic' instead of decimal real source port) for Prometheus metrics cardinality reasonshideSourcePort: truereverseLookup:## Reverse lookup db file based on GeoLite2 Free Geolocation Data## See: https://dev.maxmind.com/geoip/geolite2-free-geolocation-data?lang=engeoipDBPath: "/home/k8spacket/GeoLite2-City.mmdb"## Whois result match regexpwhoisRegexp: "(?:OrgName:|org-name:)\\s*(.*)"tcp:listener:port: 6676interfaces:## Command to achieve containers network interfacescommand: "ip address | grep @ | grep -v tunl0 | sed -E 's/.* (\\w+)@.*/\\1/' | tr '\\n' ',' | sed 's/.$//'"## How often refresh the list of network interfaces to listenrefreshPeriod: "10s"assembler:## See: https://pkg.go.dev/github.com/google/gopacket/tcpassembly#AssemblerOptionsmaxPagesPerConnection: 50maxPagesTotal: 50## Every (periodDuration) seconds, flush connections that haven't seen activity in the past (closeOlderThanDuration) seconds.flushing:periodDuration: "10s"closeOlderThanDuration: "20s"[root@k8s-master-1 k8spacket]#复制
重新安装 k8spacket
[root@k8s-master-1 k8spacket]# helm uninstall k8spacket -n k8spacket[root@k8s-master-1 k8spacket]# helm install k8spacket --namespace k8spacket . --create-namespaceNAME: k8spacketLAST DEPLOYED: Thu Oct 27 21:47:38 2022NAMESPACE: k8spacketSTATUS: deployedREVISION: 1TEST SUITE: NoneNOTES:1. Get the application URL by running these commands:export NODE_PORT=$(kubectl get --namespace k8spacket -o jsonpath="{.spec.ports[0].nodePort}" services k8spacket)export NODE_IP=$(kubectl get nodes --namespace k8spacket -o jsonpath="{.items[0].status.addresses[0].address}")echo http://$NODE_IP:$NODE_PORT[root@k8s-master-1 k8spacket]#复制
查看验证
[root@k8s-master-1 ~]# kubectl get pod -n k8spacket -o wideNAME READY STATUS RESTARTS AGE IP NODE NOMINATED NODE READINESS GATESk8spacket-8kxnx 1/1 Running 0 4m27s 192.168.1.66 k8s-node-3 <none> <none>k8spacket-cqpks 1/1 Running 0 4m27s 192.168.1.70 k8s-node-6 <none> <none>k8spacket-h72fc 1/1 Running 0 4m27s 192.168.1.67 k8s-node-4 <none> <none>k8spacket-jkxg9 1/1 Running 0 4m27s 192.168.1.75 k8s-node-7 <none> <none>k8spacket-kgpql 1/1 Running 0 4m27s 192.168.1.62 k8s-master-2 <none> <none>k8spacket-lf9br 1/1 Running 0 4m27s 192.168.1.61 k8s-master-1 <none> <none>k8spacket-mcbv5 1/1 Running 0 4m27s 192.168.1.68 k8s-node-5 <none> <none>k8spacket-ndlzt 1/1 Running 0 4m27s 192.168.1.64 k8s-node-1 <none> <none>k8spacket-vfg2x 1/1 Running 0 4m27s 192.168.1.63 k8s-master-3 <none> <none>k8spacket-vvwtr 1/1 Running 0 4m27s 192.168.1.65 k8s-node-2 <none> <none>[root@k8s-master-1 ~]#[root@k8s-master-1 ~]# kubectl get svc -n k8spacket -o wideNAME TYPE CLUSTER-IP EXTERNAL-IP PORT(S) AGE SELECTORk8spacket ClusterIP 10.110.30.53 <none> 8080/TCP 4m31s app.kubernetes.io/instance=k8spacket,app.kubernetes.io/name=k8spacket[root@k8s-master-1 ~]#访问验证[root@k8s-master-1 ~]# curl 10.110.30.53:8080/metrics复制
安装 dashboards 配置
[root@k8s-master-1 ~]# cd tmp/[root@k8s-master-1 tmp]#[root@k8s-master-1 tmp]# wget https://github.com/k8spacket/k8spacket/archive/refs/heads/master.zip[root@k8s-master-1 tmp]# unzip master.zip[root@k8s-master-1 tmp]#[root@k8s-master-1 tmp]# cd k8spacket-master[root@k8s-master-1 k8spacket-master]#[root@k8s-master-1 k8spacket-master]# kubectl apply -f ./dashboards/configmap/k8spacket-logs-dashboard createdconfigmap/k8spacket-metrics-dashboard createdconfigmap/k8spacket-node-graph-dashboard created[root@k8s-master-1 k8spacket-master]#复制
安装 Grafana
[root@k8s-master-1 tmp]# helm repo add grafana https://grafana.github.io/helm-charts"grafana" has been added to your repositories[root@k8s-master-1 tmp]# helm fetch grafana/grafana[root@k8s-master-1 tmp]#[root@k8s-master-1 tmp]# tar -zxf grafana-6.43.1.tgz复制
修改Grafana配置内容
[root@k8s-master-1 tmp]# cd grafana/[root@k8s-master-1 grafana]#[root@k8s-master-1 grafana]# vim values.yaml修改以下配置内容persistence:type: pvcenabled: trueenv:GF_INSTALL_PLUGINS: hamedkarbasi93-nodegraphapi-datasourcedashboardProviders:dashboardproviders.yaml:apiVersion: 1providers:- name: 'default'orgId: 1folder: ''type: filedisableDeletion: falseeditable: trueoptions:path: /var/lib/grafana/dashboards/defaultdashboardsConfigMaps:default: k8spacket-node-graph-dashboarddatasources:nodegraphapi-plugin-datasource.yaml:apiVersion: 1datasources:- name: "Node Graph API"jsonData:url: "http://k8spacket.k8spacket.svc.cluster.local:8080"access: "proxy"basicAuth: falseisDefault: falsereadOnly: falsetype: "hamedkarbasi93-nodegraphapi-datasource"typeLogoUrl: "public/plugins/hamedkarbasi93-nodegraphapi-datasource/img/logo.svg"typeName: "node-graph-plugin"orgId: 1version: 1复制
安装Grafana
[root@k8s-master-1 grafana]# helm install grafana -f values.yaml ./NAME: grafanaLAST DEPLOYED: Thu Oct 27 22:11:27 2022NAMESPACE: defaultSTATUS: deployedREVISION: 1NOTES:1. Get your 'admin' user password by running:kubectl get secret --namespace default grafana -o jsonpath="{.data.admin-password}" | base64 --decode ; echo2. The Grafana server can be accessed via port 80 on the following DNS name from within your cluster:grafana.default.svc.cluster.localGet the Grafana URL to visit by running these commands in the same shell:export POD_NAME=$(kubectl get pods --namespace default -l "app.kubernetes.io/name=grafana,app.kubernetes.io/instance=grafana" -o jsonpath="{.items[0].metadata.name}")kubectl --namespace default port-forward $POD_NAME 30003. Login with the password from step 1 and the username: admin[root@k8s-master-1 grafana]#复制
修改为NodePort
[root@k8s-master-1 grafana]# kubectl get svcNAME TYPE CLUSTER-IP EXTERNAL-IP PORT(S) AGEecho-a ClusterIP 10.108.160.226 <none> 8080/TCP 6d9hecho-b NodePort 10.108.200.169 <none> 8080:31414/TCP 6d9hecho-b-headless ClusterIP None <none> 8080/TCP 6d9hecho-b-host-headless ClusterIP None <none> <none> 6d9hgrafana ClusterIP 10.101.109.183 <none> 80/TCP 4mkubernetes ClusterIP 10.96.0.1 <none> 443/TCP 6d9h[root@k8s-master-1 grafana]#[root@k8s-master-1 grafana]# kubectl edit svc grafanaservice/grafana edited[root@k8s-master-1 grafana]#[root@k8s-master-1 grafana]# kubectl get svcNAME TYPE CLUSTER-IP EXTERNAL-IP PORT(S) AGEecho-a ClusterIP 10.108.160.226 <none> 8080/TCP 6d9hecho-b NodePort 10.108.200.169 <none> 8080:31414/TCP 6d9hecho-b-headless ClusterIP None <none> 8080/TCP 6d9hecho-b-host-headless ClusterIP None <none> <none> 6d9hgrafana NodePort 10.101.109.183 <none> 80:30973/TCP 4m37skubernetes ClusterIP 10.96.0.1 <none> 443/TCP 6d9h[root@k8s-master-1 grafana]#复制
查看Grafana密码
[root@k8s-master-1 grafana]# kubectl get secret --namespace default grafana -o jsonpath="{.data.admin-password}" | base64 --decode ; echo9O1Hd9LOqJ6LKUjZTlEWAGeXRitr0CZd4p6fr00J[root@k8s-master-1 grafana]#复制
访问地址
访问http://192.168.1.61:30973/添加 Node Graph API 插件http://192.168.1.61:30973/plugins查看 Node Graph API 数据收集源http://192.168.1.61:30973/datasources复制
关于
https://www.oiox.cn/
https://www.oiox.cn/index.php/start-page.html
CSDN、GitHub、51CTO、知乎、开源中国、思否、掘金、简书、华为云、阿里云、腾讯云、哔哩哔哩、今日头条、新浪微博、个人博客
全网可搜《小陈运维》
文章主要发布于微信公众号


