


使用普罗米修斯(Prometheus)与对Vertica数据库进行监控
工具介绍
Prometheus
Prometheus是一个开源的面向时间序列的系统监控和警报工具包。 Prometheus 从检测作业中抓取指标。 它在本地存储所有抓取的数据(样本),并提供一个 Web 界面以表格或图形视图呈现数据。 可以对这些数据运行一些可选规则,以从现有数据聚合和记录新的时间序列或生成警报。 Grafana 或其他 API 消费者可用于可视化收集的数据。
下载地址:官网地址
Vertica-prometheus-exporter
Vertica Prometheus Exporter是一个配置驱动的导出器,它公开从 Vertica 数据库收集的指标供 Prometheus 监控系统使用,以及支持 Prometheus 作为数据源的工具。
下载地址:GitHub
配置过程
本文仅对配置过程进行简单描述,帮助首次使用的用户了解配置过程。
环境准备
- Vertica数据库(单节点或者多节点)
- Prometheus:prometheus-2.40.4.linux-386.tar.gz
- vertica-prometheus-exporter:vertica-prometheus-exporter-v1.0.2.linux-amd64.tar.gz
Vertica-prometheus-exporter配置
1.上传tar包到服务器并解压
[dbadmin@szxtsp104 tmp]$ pwd
/tmp
[dbadmin@szxtsp104 tmp]$ tar -zxvf vertica-prometheus-exporter-v1.0.2.linux-amd64.tar.gz
2.修改vertica-prometheus-exporter.yml配置文件
[dbadmin@szxtsp104 tmp]$ vi vertica-prometheus-exporter-v1.0.2.linux-amd64/metrics/vertica-prometheus-exporter.yml
global:
  # Subtracted from Prometheus' scrape_timeout to give us some headroom and prevent Prometheus from timing out first.
  #
  # Must be strictly positive. The default is 500ms.
  scrape_timeout_offset: 500ms
  # Minimum interval between collector runs: by default (0s) collectors are executed on every scrape.
  min_interval: 10s
   # Maximum number of open connections to any one target. Metric queries will run concurrently on multiple connections,
  # as will concurrent scrapes.

  max_connections: 3
  # Maximum number of idle connections to any one target. Unless you use very long collection intervals, this should
  # always be the same as max_connections.

  max_idle_connections: 3
  # Maximum number of maximum amount of time a connection may be reused. Expired connections may be closed lazily before reuse.
  # If 0, connections are not closed due to a connection's age.
  max_connection_lifetime: 5m


# The target to monitor and the collectors to execute on it.
target:
  # Data source name always has a URI schema that matches the driver name. In some cases (e.g. vertica)
  # the schema gets dropped or replaced to match the driver expected DSN format.
  # data_source_name: 'vertica://<username>:<userpwd>@<exporterhostip>:5433/<databasename>'
  data_source_name: 'vertica://dbadmin:vertica@10.4.56.104:5433/vmart' #github auto test configration


  # Collectors (referenced by name) to execute on the target.
  collectors: [example ,example1]

# Collector files specifies a list of globs. One collector definition is read from each matching file.
collector_files:
# - "*.collector.yml"
- "*.collector.yml"

Log:
  retention_day:  15 # Any integer value which represents days .
  max_log_filesize:  500 # Any integer value which represents log file size in  megabytes
数据库连接配置项参数:
data_source_name: 'vertica://<username>:<userpwd>@<exporterhostip>:5433/<databasename>'
监控口径文件配置项参数:
collector_files:
- "*.collector.yml"
该配置文件中其余参数可查看文档按需求进行调整。
3.监控口径配置文件
在/tmp/vertica-prometheus-exporter-v1.0.2.linux-amd64/metrics目录下缺省存在两个监控口径配置文件,可以在这两个配置文件上进行修改,或者按照模版格式新建配置文件。
[dbadmin@szxtsp104 metrics]$ cat /tmp/vertica-prometheus-exporter-v1.0.2.linux-amd64/metrics/vertica-example1.collector.yml
collector_name: example1
metrics:
  - metric_name: vertica_connections_per_node
    type: gauge
    help: 'Connections per node'
    key_labels:
       - node_name
    values: [totalconns]
    query: |
        SELECT /*+ LABEL(exporter_vertica_global_status_connections_per_node) */ node_name , count(*) totalconns
        FROM v_monitor.sessions s
        GROUP BY node_name
        ORDER BY node_name;
  - metric_name: vertica_query_requests_transactions_count_per_node
    type: gauge
    help: 'Running transactions per node'
    key_labels:
       - node_name
    values: [total]
    query: |
       SELECT /*+ LABEL(exporter_vertica_query_requests_transactions_count_per_node) */
       node_name , count(*) total
       FROM transactions
       WHERE start_timestamp between date_trunc('minute',sysdate) - '1 minutes'::interval and date_trunc('minute',sysdate) - '1 milliseconds'::interval
       GROUP BY node_name
       ORDER BY node_name;
  - metric_name: vertica_cpu_usage_pct
    type: gauge
    help: 'vertica cpu usage percentage'
    key_labels:
       - node_name
    values: [avg_cpu_usage_pct]
    query_ref: vertica_system_resources
  - metric_name: vertica_mem_usage_pct
    type: gauge
    help: 'vertica memory usage percentage'
    key_labels:
       - node_name
    values: [avg_mem_usage_pct]
    query_ref: vertica_system_resources
  - metric_name: vertica_net_rx_bytespersec
    type: gauge
    help: 'Vertica Network Receive bps'
    key_labels:
       - node_name
    values: [net_rx_bps]
    query_ref: vertica_system_resources
  - metric_name: vertica_net_tx_bytespersec
    type: gauge
    help: 'Vertica Network Transmit bps'
    key_labels:
       - node_name
    values: [net_tx_bps]
    query_ref: vertica_system_resources
  - metric_name: vertica_io_read_bytespersec
    type: gauge
    help: 'Vertica IO Read bps'
    key_labels:
       - node_name
    values: [io_read_bps]
    query_ref: vertica_system_resources
  - metric_name: vertica_io_write_bytespersec
    type: gauge
    help: 'Vertica IO Writes bps'
    key_labels:
       - node_name
    values: [io_write_bps]
    query_ref: vertica_system_resources

queries:
  - query_name: vertica_system_resources
    query: |
       select
          node_name,
          ROUND(max(average_cpu_usage_percent)) as avg_cpu_usage_pct,
          ROUND(max(average_memory_usage_percent)) as avg_mem_usage_pct,
          CAST(max(net_rx_kbytes_per_second)*1024 as INTEGER) as net_rx_bps,
          CAST(max(net_tx_kbytes_per_second)*1024 as INTEGER) as net_tx_bps,
          CAST(max(io_read_kbytes_per_second)*1024 as INTEGER) as io_read_bps,
          CAST(max(io_written_kbytes_per_second)*1024 as INTEGER) as io_write_bps
       from system_resource_usage
       group by node_name, end_time
       order by end_time desc limit 1;
[dbadmin@szxtsp104 metrics]$ cat /tmp/vertica-prometheus-exporter-v1.0.2.linux-amd64/metrics/vertica-example.collector.yml
collector_name: example
# min_interval: 0s
metrics:
  - metric_name: vertica_license_size
    type: gauge
    help: "Total License size in MB"
    values: [licsz]
    query: |
      select  /*+ LABEL(exporter_vertica_license_size MB) */ (license_size_bytes/1000000)::INTEGER as licsz
      from license_audits where audited_data='Total'
      order by audit_end_timestamp desc limit 1;

  - metric_name: vertica_database_size
    type: gauge
    help: "Total Database size in MB"
    values: [ttldbsz]
    query: |
      select  /*+ LABEL(exporter_vertica_total_database_size) */ (database_size_bytes/1000000)::INTEGER as ttldbsz
      from license_audits where audited_data='Total'
      order by audit_end_timestamp desc limit 1;
  - metric_name: vertica_total_database_rows
    type: gauge
    help: "Total Rows in Database from projection_storage table."
    values: [ttlrows]
    query: |
      select /*+ LABEL(exporter_vertica_total_projection_rows) */ sum(row_count) as ttlrows
      from projection_storage;
  - metric_name: vertica_total_database_connections
    type: gauge
    help: "Total Database Connections from sessions table."
    values: [ttlconns]
    query: |
      select /*+ LABEL(exporter_vertica_total_database_connections) */ count(*) as ttlconns
      from sessions;
  - metric_name: vertica_state_not_up_or_standby
    type: counter
    help: "Nodes with state of other than UP or STANDBY."
    values: [down]
    query: |
      select count(*) as down
      from nodes
      where node_state!='UP' and node_state!='Standby';
4.启动Vertica-prometheus-exporter
nohup /tmp/vertica-prometheus-exporter-v1.0.2.linux-amd64/vertica-prometheus-exporter --config.file /tmp/vertica-prometheus-exporter-v1.0.2.linux-amd64/metrics/vertica-prometheus-exporter.yml &
启动后通过nohup.out日志检查该程序的端口:
[dbadmin@szxtsp104 vertica-prometheus-exporter-v1.0.2.linux-amd64]$ grep 'Listening on' nohup.out
time="2022-12-01T11:32:10+08:00" level=info msg="Listening on :9968"
Prometheus配置
1.上传tar包到服务器并解压
[dbadmin@szxtsp104 tmp]$ pwd
/tmp
[dbadmin@szxtsp104 tmp]$ tar -zxvf prometheus-2.40.4.linux-386.tar.gz
2.修改prometheus.yml配置文件
[dbadmin@szxtsp104 prometheus-2.40.4.linux-386]$ vi /tmp/prometheus-2.40.4.linux-386/prometheus.yml
# my global config
global:
  scrape_interval: 15s # Set the scrape interval to every 15 seconds. Default is every 1 minute.
  evaluation_interval: 15s # Evaluate rules every 15 seconds. The default is every 1 minute.
  # scrape_timeout is set to the global default (10s).

# Alertmanager configuration
alerting:
  alertmanagers:
    - static_configs:
        - targets:
          # - alertmanager:9093

# Load rules once and periodically evaluate them according to the global 'evaluation_interval'.
rule_files:
  # - "first_rules.yml"
  # - "second_rules.yml"

# A scrape configuration containing exactly one endpoint to scrape:
# Here it's Prometheus itself.
scrape_configs:
  # The job name is added as a label `job=<job_name>` to any timeseries scraped from this config.
  - job_name: "prometheus"

    # metrics_path defaults to '/metrics'
    # scheme defaults to 'http'.

    static_configs:
      - targets: ["10.4.56.104:9968"]
配置prometheus数据源:
    static_configs:
      - targets: ["10.4.56.104:9968"]
配置上一步中设置的Vertica-prometheus-exporter的IP以及端口。
该配置文件中其余参数可查看文档按需求进行调整。
3.启动prometheus
[dbadmin@szxtsp104 prometheus-2.40.4.linux-386]$ nohup /tmp/prometheus-2.40.4.linux-386/prometheus --config.file=/tmp/prometheus-2.40.4.linux-386/prometheus.yml &
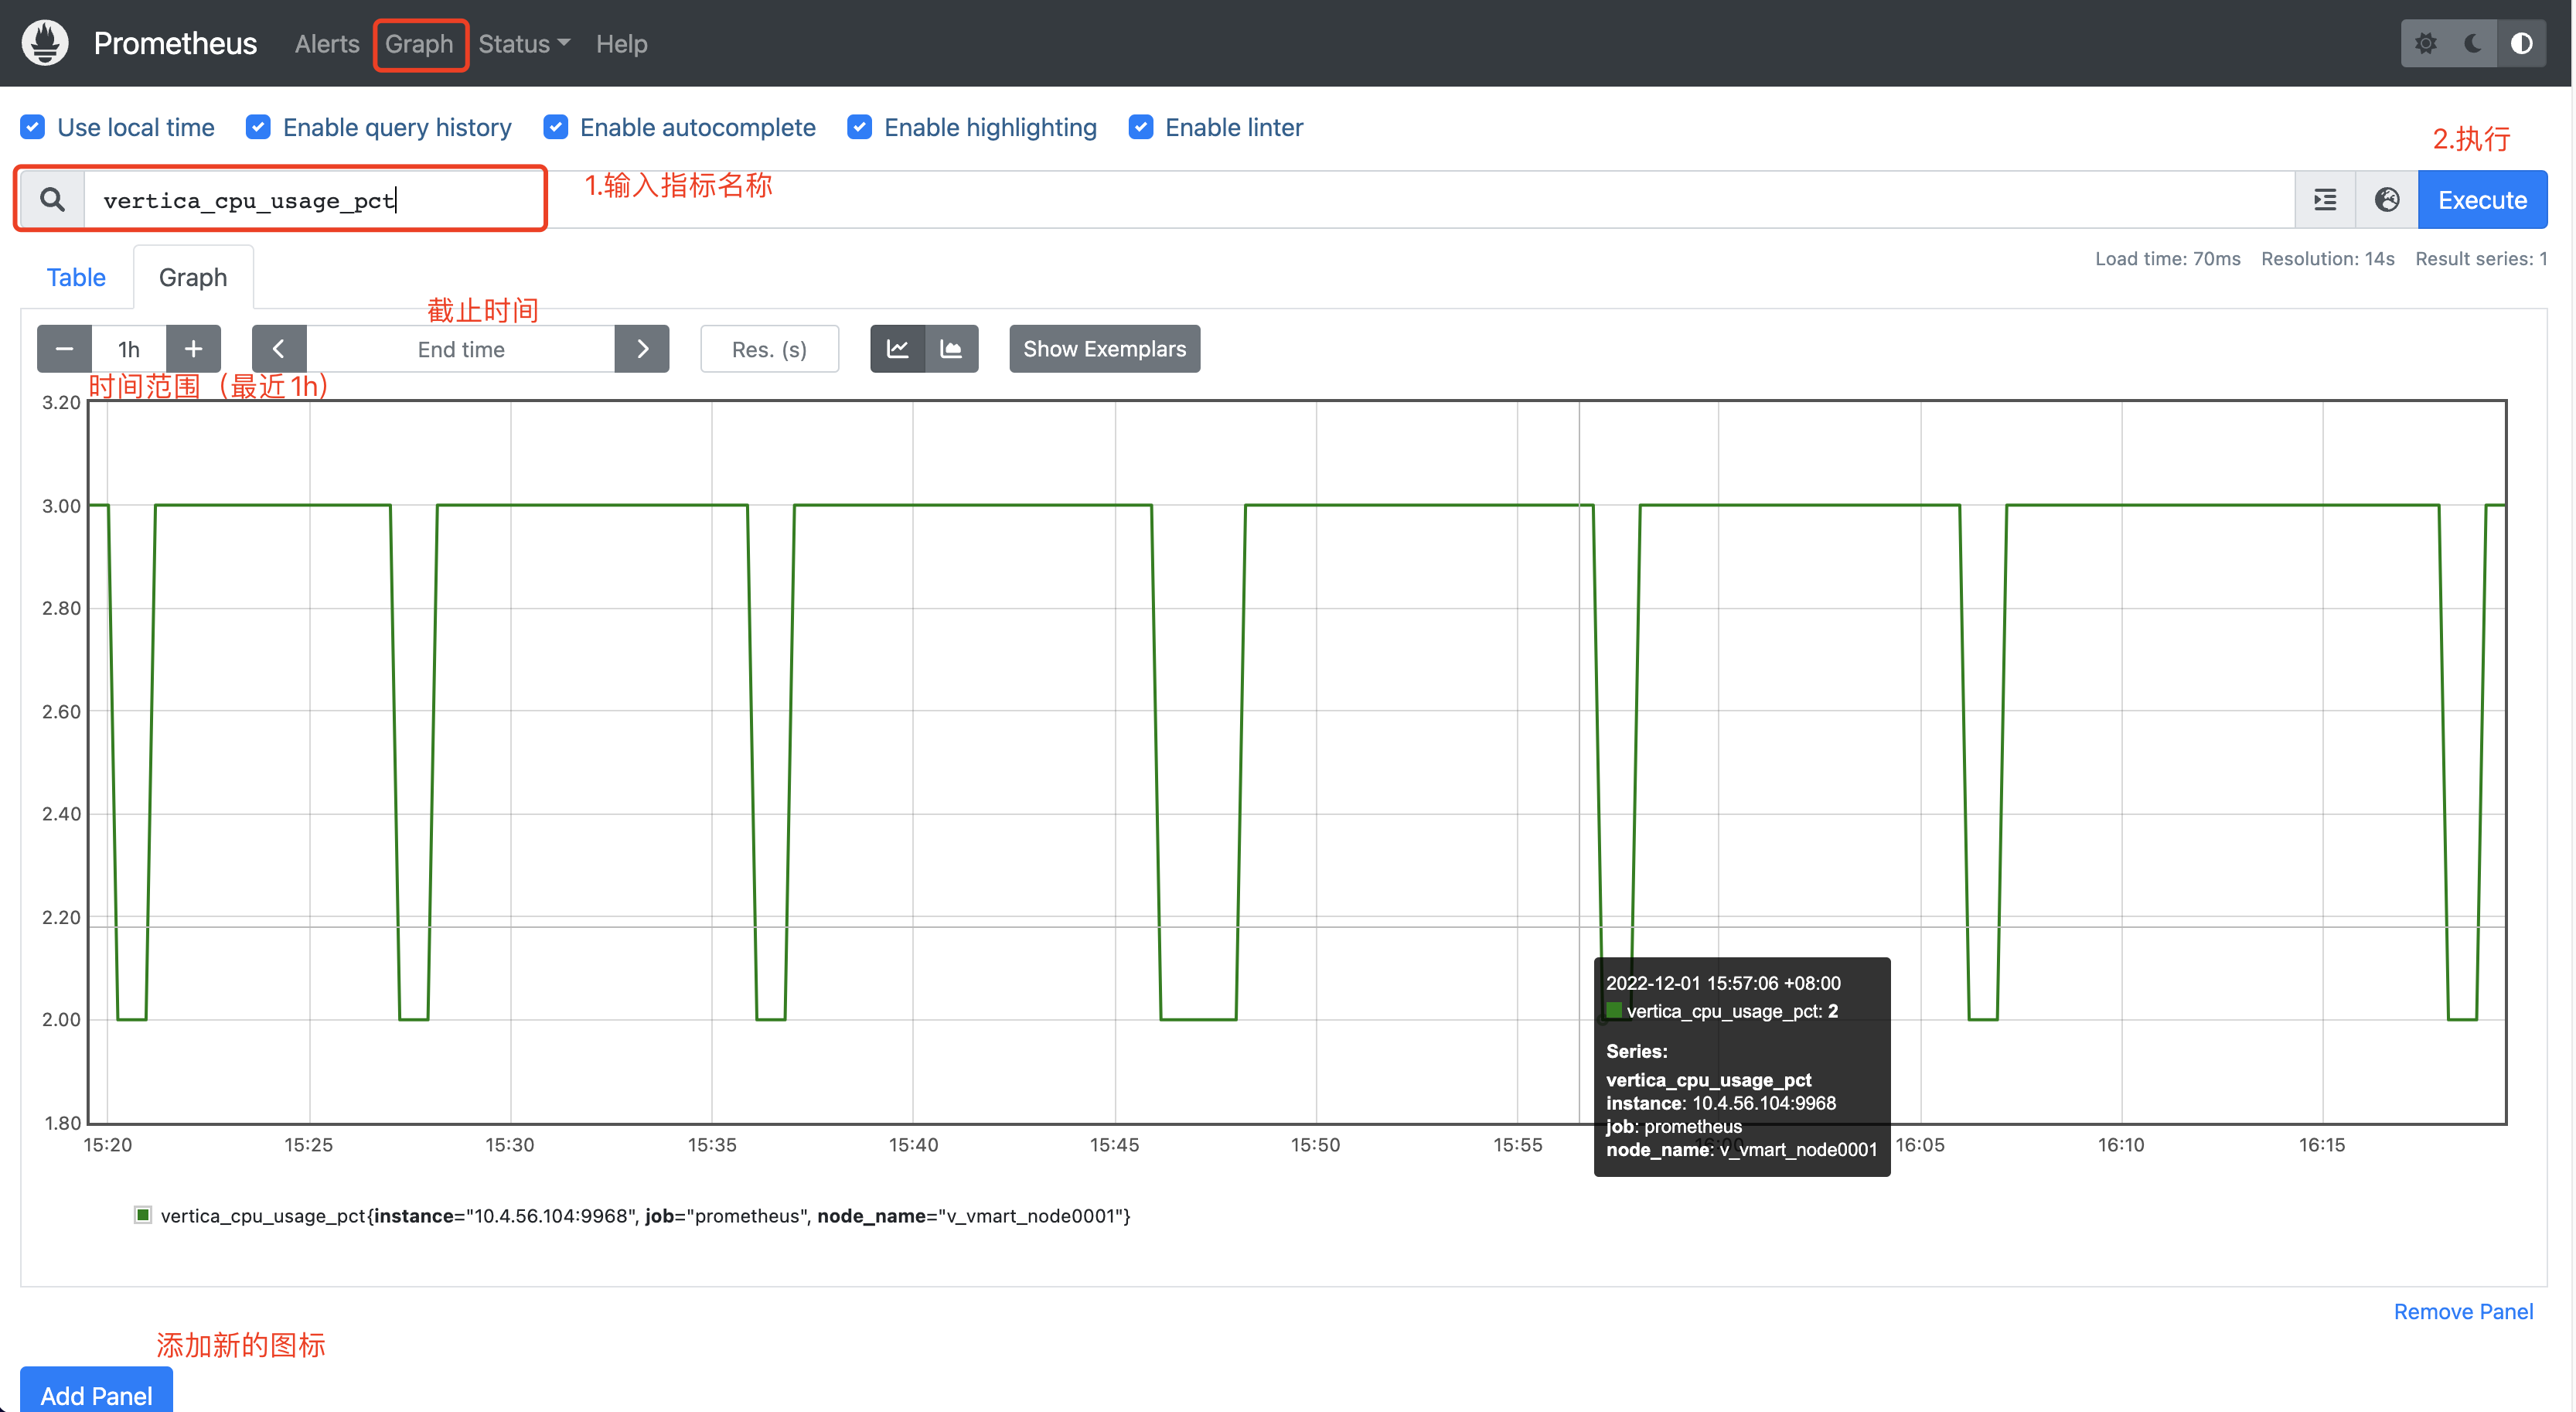
访问Prometheus
配置完成后,可以通过浏览器登录Prometheus界面,http://10.4.56.104:9090/graph,将IP改为启动Prometheus的服务器IP。
指标查询
通过页面的Graph即可选择不同的指标进行展示。

最后修改时间:2024-08-29 10:49:03
「喜欢这篇文章,您的关注和赞赏是给作者最好的鼓励」
关注作者
【版权声明】本文为墨天轮用户原创内容,转载时必须标注文章的来源(墨天轮),文章链接,文章作者等基本信息,否则作者和墨天轮有权追究责任。如果您发现墨天轮中有涉嫌抄袭或者侵权的内容,欢迎发送邮件至:contact@modb.pro进行举报,并提供相关证据,一经查实,墨天轮将立刻删除相关内容。
