


前言
目前的主要工作是为一些迁移后的PostgreSQL配置 prometheus监控。首先看看今天的工作成果。
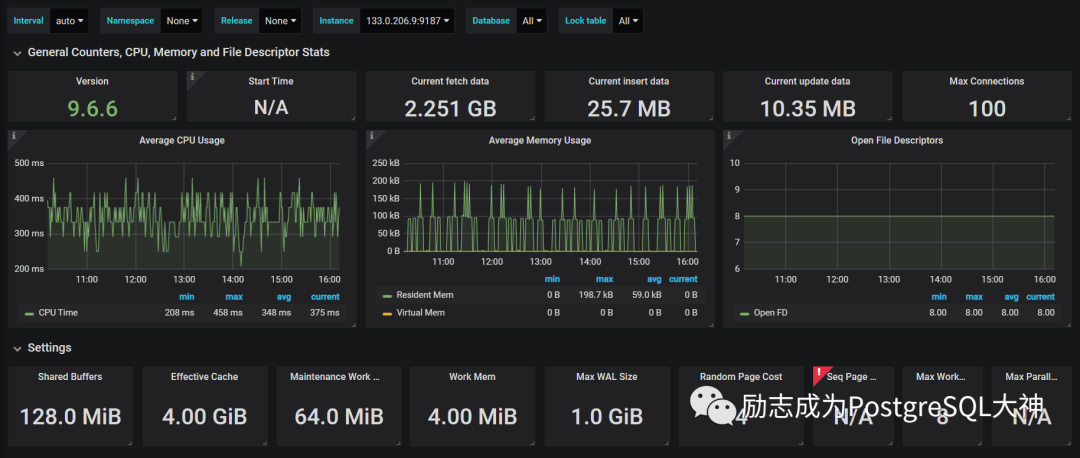
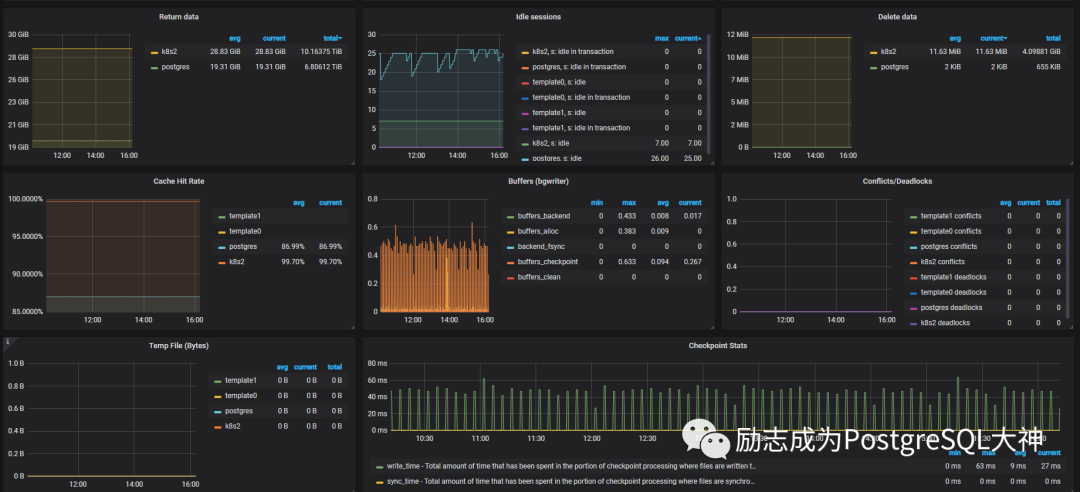
界面展示确实非常强大。但因为服务器是由他人安装的,所以许多配置工作已经提前完成。而我今天只做了加监控的工作,我是一个热爱研究的人,所以我决定在我的虚拟机上搭一套研究一下。
吹一波Prometheus
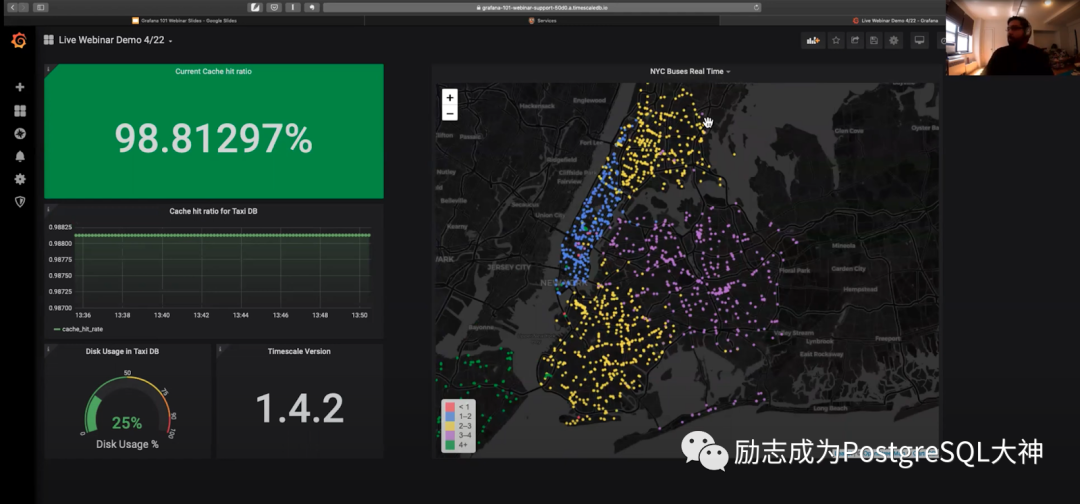
在安装之前,我浏览了一下Grafana Labs,也就是它展示的网站。这儿一定要吹一波。这比某些 xxx厂商开发的监控软件强大得多。可以说实现了无边界监控。它基于开源社区,很多人会把自己的模板传到社区里面。而且这些人的持续创作已经达到了其它软件所不能达到的高度。
比如这种地图应用。
还有这种监控阿尔卑斯山气候变化。
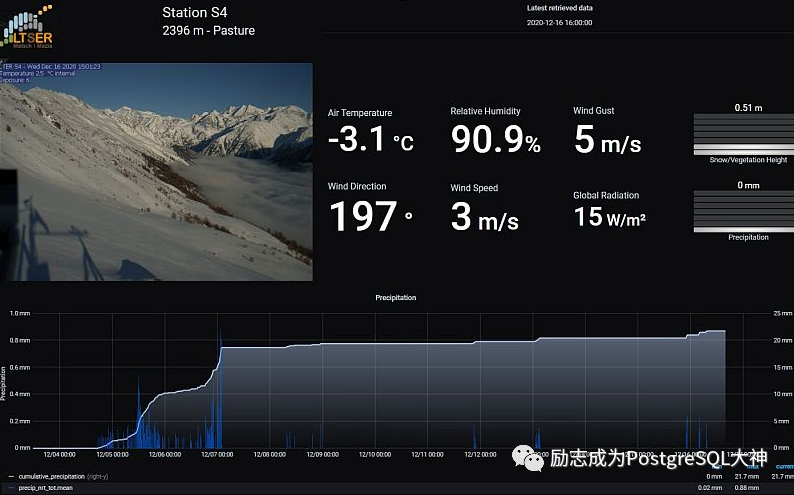
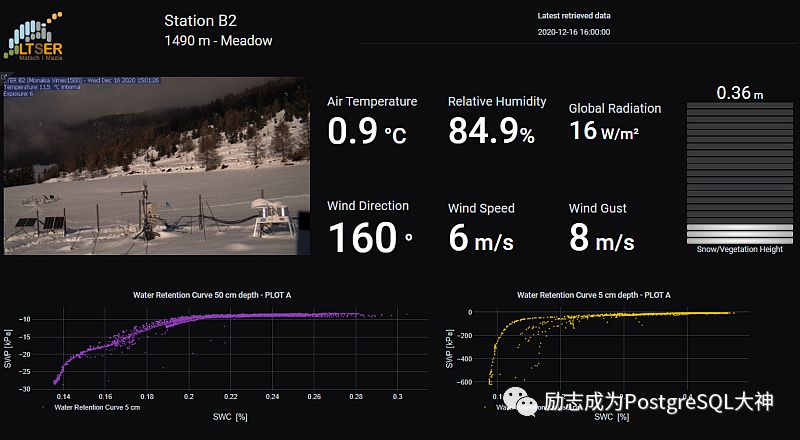
真是太酷了!一款软件它的生态起来了,就会有各种各样的玩法。
下一步,我们将在虚拟机上建立一套prometheus来监控一个PostgreSQL 13数据库服务器。
1.创建一个Prometheus用户和组
第一步是操作监控主机,创建 prometheus用户。将创建的用户设置为/bin/false,使用户无法直接登录。
[root@centos8 ~]# useradd -m -s /bin/false prometheus[root@centos8 ~]# id prometheusuid=1001(prometheus) gid=1001(prometheus) groups=1001(prometheus)
2.为Prometheus创建配置目录
一旦Prometheus用户被创建,我们就会在/etc和/var目录下创建配置目录,它将存储Prometheus配置文件和运行数据。其数据存储在 tsdb (时序数据库中)。
[root@centos8 ~]# mkdir /etc/prometheus[root@centos8 ~]# mkdir /var/lib/prometheus[root@centos8 ~]# chown prometheus /var/lib/prometheus/
3.下载Prometheus安装包
下载 Prometheus软件包,我现在下载的是2.24版本,解压后将相关的二进制文件和配置文件保存到上面创建的目录中。
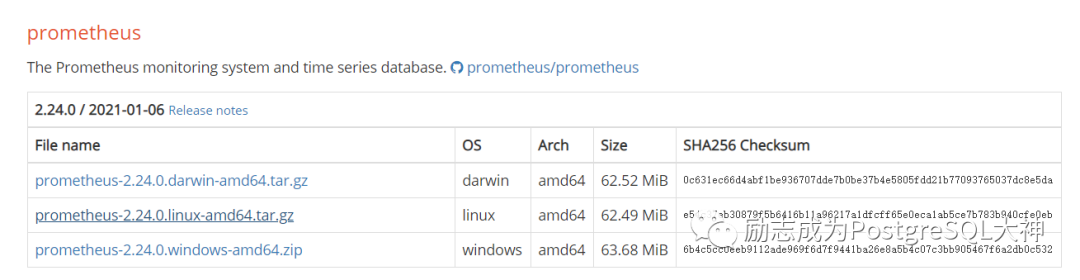
wget -c https://github.com/prometheus/prometheus/releases/download/v2.24.0/prometheus-2.24.0.linux-amd64.tar.gztar -zxvf prometheus-2.24.0.linux-amd64.tar.gzcd prometheus-2.24.0.linux-amd64/cp prometheus /usr/local/bincp promtool /usr/local/bincp -rp {consoles,console_libraries,prometheus.yml} /etc/prometheus/
4.为Prometheus创建配置文件
此处使用默认配置文件,其中主要有几个可配置的信息。一个是job_name,另一个是static_configs。这里暂且保持默认设置。
[root@centos8 prometheus-2.24.0.linux-amd64]# cat vim /etc/prometheus/prometheus.ymlcat: vim: No such file or directory# my global configglobal: scrape_interval: 15s # Set the scrape interval to every 15 seconds. Default is every 1 minute. evaluation_interval: 15s # Evaluate rules every 15 seconds. The default is every 1 minute. # scrape_timeout is set to the global default (10s).# Alertmanager configurationalerting: alertmanagers: - static_configs: - targets: # - alertmanager:9093# Load rules once and periodically evaluate them according to the global 'evaluation_interval'.rule_files: # - "first_rules.yml" # - "second_rules.yml"# A scrape configuration containing exactly one endpoint to scrape:# Here it's Prometheus itself.scrape_configs: # The job name is added as a label `job=<job_name>` to any timeseries scraped from this config. - job_name: 'prometheus' # metrics_path defaults to '/metrics' # scheme defaults to 'http'. static_configs: - targets: ['localhost:9090']
开启防火墙9090端口,不然无法在外面进行访问
[root@centos8 prometheus-2.24.0.linux-amd64]# firewall-cmd --add-port=9090/tcp --permanentsuccess[root@centos8 prometheus-2.24.0.linux-amd64]# firewall-cmd --reloadsuccess
5.在配置文件和目录上设置正确的权限并启动
要正确地使用和运行,需要修改二进制文件和配置文件的权限。
[root@centos8 prometheus-2.24.0.linux-amd64]# chown -R prometheus:prometheus /etc/prometheus[root@centos8 prometheus-2.24.0.linux-amd64]# chown -R prometheus:prometheus /var/lib/prometheus[root@centos8 prometheus-2.24.0.linux-amd64]# chown prometheus.prometheus /usr/local/bin/{prometheus,promtool}
随后指定配置文件以启动 prometheus软件。
[root@centos8 ~]# prometheus --config.file=/etc/prometheus/prometheus.ymllevel=info ts=2021-01-15T07:09:58.622Z caller=main.go:326 msg="No time or size retention was set so using the default time retention" duration=15dlevel=info ts=2021-01-15T07:09:58.623Z caller=main.go:364 msg="Starting Prometheus" version="(version=2.24.0, branch=HEAD, revision=02e92236a8bad3503ff5eec3e04ac205a3b8e4fe)"level=info ts=2021-01-15T07:09:58.623Z caller=main.go:369 build_context="(go=go1.15.6, user=root@d9f90f0b1f76, date=20210106-13:48:37)"level=info ts=2021-01-15T07:09:58.623Z caller=main.go:370 host_details="(Linux 4.18.0-193.28.1.el8_2.x86_64 #1 SMP Thu Oct 22 00:20:22 UTC 2020 x86_64 centos8.localdomain (none))"level=info ts=2021-01-15T07:09:58.623Z caller=main.go:371 fd_limits="(soft=1024, hard=262144)"level=info ts=2021-01-15T07:09:58.623Z caller=main.go:372 vm_limits="(soft=unlimited, hard=unlimited)"level=info ts=2021-01-15T07:09:58.624Z caller=web.go:530 component=web msg="Start listening for connections" address=0.0.0.0:9090level=info ts=2021-01-15T07:09:58.625Z caller=main.go:738 msg="Starting TSDB ..."level=info ts=2021-01-15T07:09:58.628Z caller=tls_config.go:192 component=web msg="TLS is disabled." http2=falselevel=info ts=2021-01-15T07:09:58.631Z caller=head.go:645 component=tsdb msg="Replaying on-disk memory mappable chunks if any"level=info ts=2021-01-15T07:09:58.631Z caller=head.go:659 component=tsdb msg="On-disk memory mappable chunks replay completed" duration=2.314µslevel=info ts=2021-01-15T07:09:58.631Z caller=head.go:665 component=tsdb msg="Replaying WAL, this may take a while"level=info ts=2021-01-15T07:09:58.631Z caller=head.go:717 component=tsdb msg="WAL segment loaded" segment=0 maxSegment=0level=info ts=2021-01-15T07:09:58.631Z caller=head.go:722 component=tsdb msg="WAL replay completed" checkpoint_replay_duration=26.851µs wal_replay_duration=223.424µs total_replay_duration=263.42µslevel=info ts=2021-01-15T07:09:58.632Z caller=main.go:758 fs_type=XFS_SUPER_MAGIClevel=info ts=2021-01-15T07:09:58.632Z caller=main.go:761 msg="TSDB started"level=info ts=2021-01-15T07:09:58.632Z caller=main.go:887 msg="Loading configuration file" filename=/etc/prometheus/prometheus.ymllevel=info ts=2021-01-15T07:09:58.632Z caller=main.go:918 msg="Completed loading of configuration file" filename=/etc/prometheus/prometheus.yml totalDuration=699.066µs remote_storage=1.613µs web_handler=601ns query_engine=1.152µs scrape=431.929µs scrape_sd=63.24µs notify=20.9µs notify_sd=8.527µs rules=1.052µslevel=info ts=2021-01-15T07:09:58.632Z caller=main.go:710 msg="Server is ready to receive web requests."
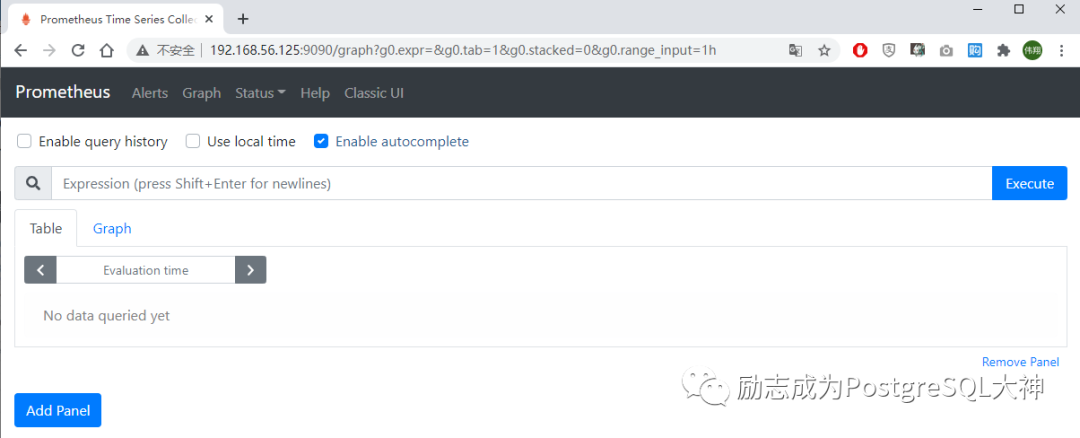
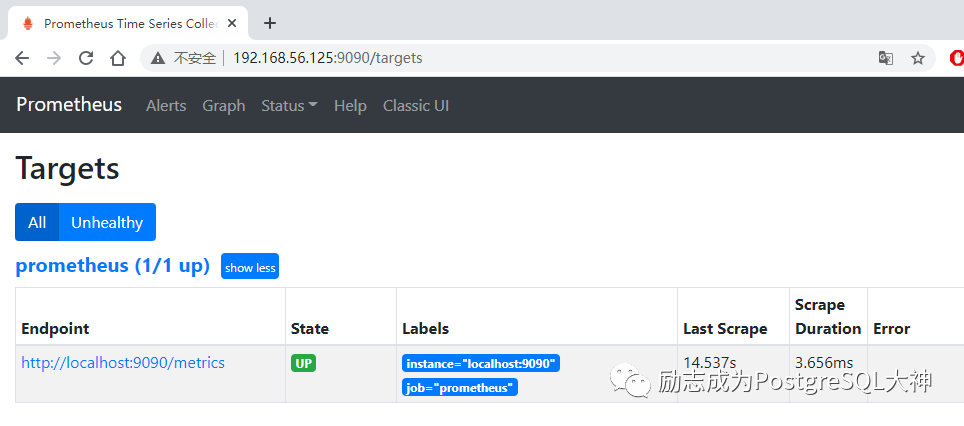
一旦成功启动,您就可以在 http://192.168.56.125:9090打开网页以进行访问。显示界面表示启动成功。
6.配置自启动服务
为了能够将Prometheus作为systemd系统服务进行管理,需要配置一个prometheus.service服务。配置内容如下:
vi /etc/systemd/system/prometheus.service[Unit]Description=Prometheus Time Series Collection and Processing ServerWants=network-online.targetAfter=network-online.target[Service]User=prometheusGroup=prometheusType=simpleExecStart=/usr/local/bin/prometheus \ --config.file /etc/prometheus/prometheus.yml \ --storage.tsdb.path /var/lib/prometheus/ \ --web.console.templates=/etc/prometheus/consoles \ --web.console.libraries=/etc/prometheus/console_libraries[Install]WantedBy=multi-user.target [root@centos8 ~]# systemctl daemon-reload[root@centos8 ~]# systemctl start prometheus[root@centos8 ~]# systemctl enable prometheusCreated symlink /etc/systemd/system/multi-user.target.wants/prometheus.service → /etc/systemd/system/prometheus.service.
在配置完毕后测试服务是否正常。
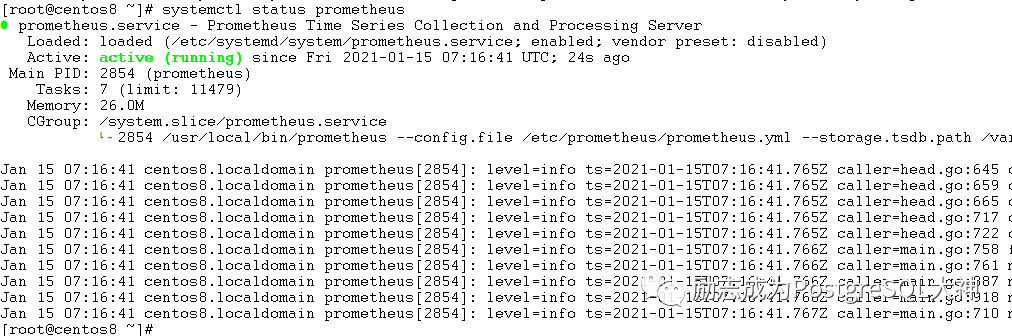
netstat可以查看一下prometheus进程,可以看到在9090端口上已开始进行监听。

再通过界面访问,点击status-> targets,就会看到当前机器状态已经显示为 up。
7.下载安装postgres_exporter
在接下来的操作中,我们需要将agent端安装到 postgresql主机上,以捕获数据并传输到服务端。在 github上,当前 postgres的exporter有几种, star最多可以访问https://github.com/wrouesnel/postgres_exporter。目前是0.8版。
wget -c https://github.com/wrouesnel/postgres_exporter/releases/download/v0.8.0/postgres_exporter_v0.8.0_linux-amd64.tar.gztar -xzvf postgres_exporter_v0.8.0_linux-amd64.tar.gzcd postgres_exporter_v0.8.0_linux-amd64[root@centos8 postgres_exporter_v0.8.0_linux-amd64]# ls -lrttotal 12548-rwxrwxr-x. 1 2000 2000 12846262 Nov 25 2019 postgres_exporter
启动postgres_exporter,启动之前设置一个DATA_SOURCE_NAME环境变量,它指定数据库连接字符串。
export DATA_SOURCE_NAME="postgresql://postgres:Sqlite123@192.168.56.119:5432/postgres?sslmode=disable"./postgres_exporter &INFO[0000] Established new database connection to "192.168.56.119:5432". source="postgres_exporter.go:878"INFO[0000] Semantic Version Changed on "192.168.56.119:5432": 0.0.0 -> 13.1.0 source="postgres_exporter.go:1405"INFO[0000] Starting Server: :9187 source="postgres_exporter.go:1672"
启动成功,postgres_exp监听9187端口。在此需要防火墙打开9187端口。

[root@centos8 ~]# firewall-cmd --add-port=9187/tcp --permanent success[root@centos8 ~]# firewall-cmd --reloadsuccess
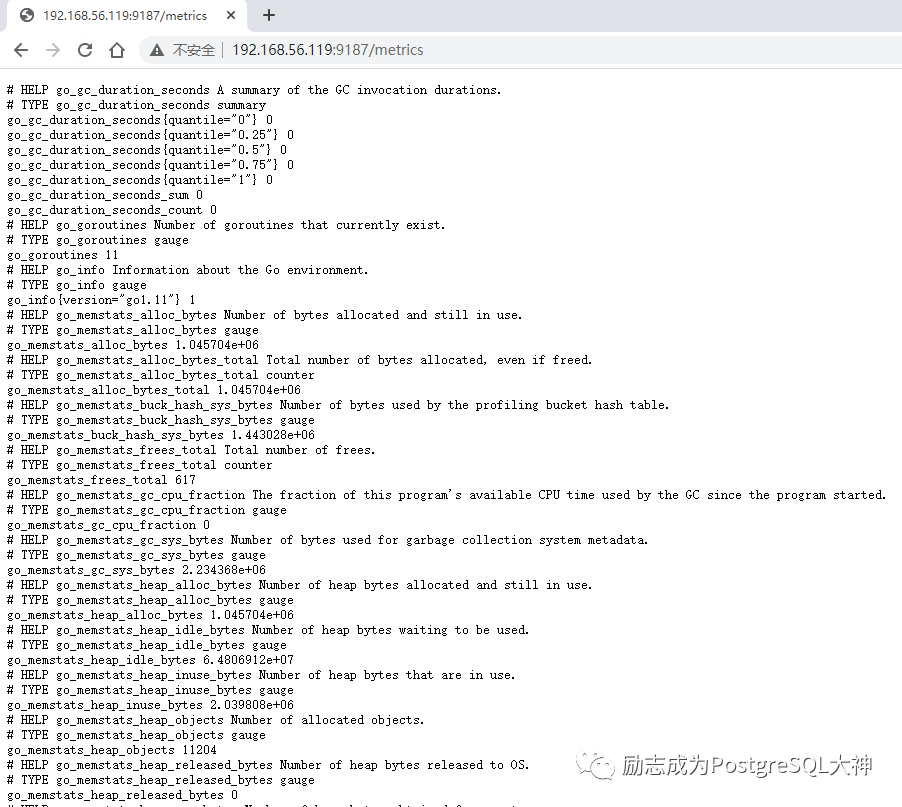
8.查看postgres端数据
此处访问PostgreSQL主机的9187端口,http://192.168.56.119:9187/metrics。可以显示数据表示配置成功。
9.在Prometheus侧添加agent节点
找到前面的prometheus.yml配置文件,添加agent节点的信息,包括主机ip和端口号。
sql- job_name: 'postgres_exp' static_configs: - targets: ['192.168.56.119:9187']
要注意的是 yml配置文件的缩进,这里的首次配置失败仅仅是因为缩进不正确,多了一个空格。
配置好后,执行kill -s SIGHUP,对配置文件进行重新加载。
[root@centos8 ~]# ps -ef | grep prometheusprometh+ 2854 1 0 07:16 ? 00:00:01 /usr/local/bin/prometheus --config.file /etc/prometheus/prometheus.yml[root@centos8 ~]# kill -s SIGHUP 2854
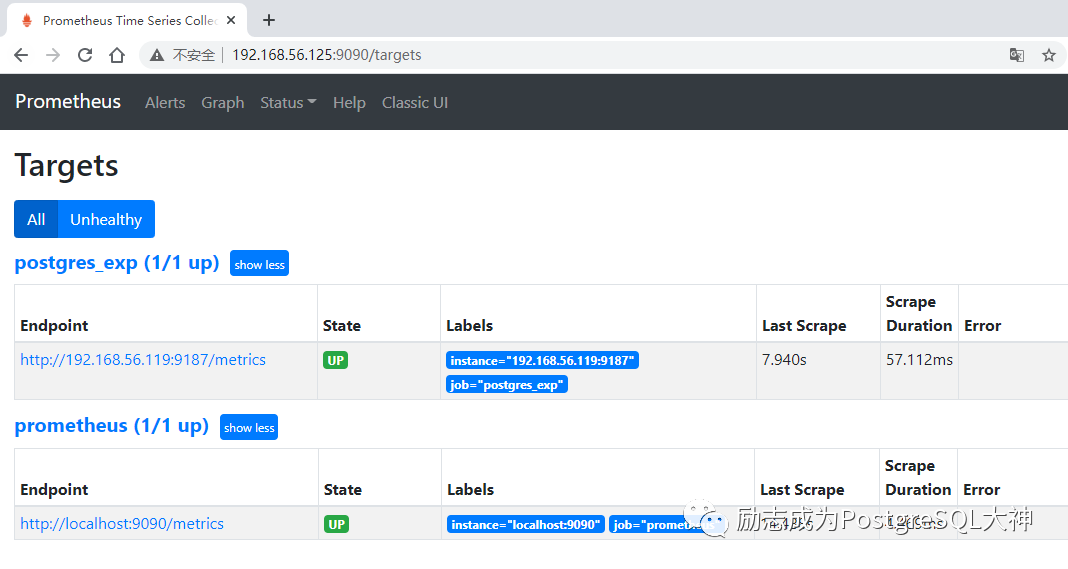
重新加载配置文件后,再次到图形界面上查看,此时能显示agent节点已经被监控起来了,state也是up状态。
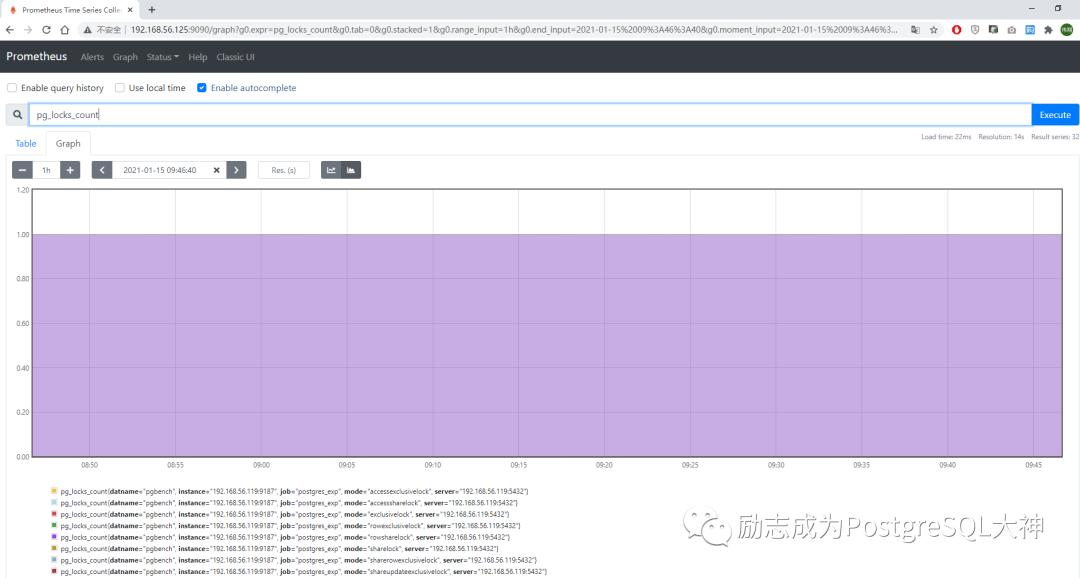
当前可以通过默认的prometheus查看一些数据,不过不够美观。
PostgreSQL中文社区欢迎广大技术人员投稿
投稿邮箱:press@postgres.cn
