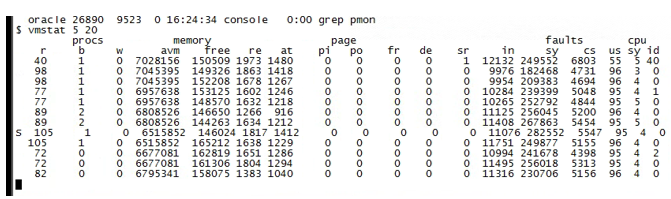
暂无图片
暂无图片
暂无图片
暂无图片
暂无图片

latch free 问题分析

原创 许玉冲 2022-12-10
1380

系统cpu使用率很高,系统运行缓慢。


# 数据等待事件查询:

SQL> select event,count(*) from v$session group by event order by 2;

EVENT                                                              COUNT(*)
---------------------------------------------------------------- ----------
pmon timer                                                                1
Streams AQ: waiting for time management or cleanup tasks                  1
Streams AQ: qmn coordinator idle wait                                     1
Streams AQ: qmn slave idle wait                                           1
wait for unread message on broadcast channel                              1
Streams AQ: waiting for messages in the queue                             1
SQL*Net message to client                                                 1
smon timer                                                                1
SQL*Net more data to client                                               1
jobq slave wait                                                           5
rdbms ipc message                                                        13

EVENT                                                              COUNT(*)
---------------------------------------------------------------- ----------
latch: cache buffers chains                                              40
latch free                                                               81
SQL*Net message from client                                             111
     SID EVENT                                                                    P1         P2         P3 P1TEXT                                                            WAIT_TIME SECONDS_IN_WAIT
---------- ---------------------------------------------------------------- ---------- ---------- ---------- ---------------------------------------------------------------- ---------- ---------------
       336 latch: cache buffers chains                                      1.3835E+19        122          0 address                                                                  24               0
       299 latch free                                                       1.3835E+19        127          0 address                                                                  21               0
       326 latch free                                                       1.3835E+19        127          0 address                                                                  21               0
       679 latch free                                                       1.3835E+19        127          0 address                                                                  21               0
       677 latch free                                                       1.3835E+19        127          0 address                                                                  21               0
       328 latch free                                                       1.3835E+19        127          0 address                                                                  21               0
       699 latch free                                                       1.3835E+19        127          0 address                                                                  21               0
       696 latch free                                                       1.3835E+19        127          0 address                                                                  21               0
       691 latch free                                                       1.3835E+19        127          0 address                                                                  21               0
       687 latch free                                                       1.3835E+19        127          0 address                                                                  21               0

10 rows selected.


# 热点sql查询:

select * from (select count(*),sql_id,nvl(o.object_name,ash.current_obj#) objn,substr(o.object_type,0,10) otype,CURRENT_FILE# fn,CURRENT_BLOCK# blockn
 from v$active_session_history ash, all_objects o
where event like 'latch: cache buffers chains'
and o.object_id (+)= ash.CURRENT_OBJ#
group by sql_id, current_obj#, current_file#,
current_block#, o.object_name,o.object_type
order by count(*) desc )where rownum <=10; COUNT(*) SQL_ID        OBJN                                     OTYPE                        FN     BLOCKN
---------- ------------- ---------------------------------------- -------------------- ---------- ----------
      1121 560hngwau64cu TM_MEASUREMAIN                           TABLE                        84    1167538
       871 560hngwau64cu TM_MEASUREMAIN                           TABLE                        84    1167586
       783 560hngwau64cu -1                                                                    84    1167586
       757 36s1h2kytm7pq TM_MEASUREMAIN                           TABLE                        84    1167538
       733               -1                                                                     0          0
       710 a00qb2ncb6v17 TM_MEASUREMAIN                           TABLE                        84    1167538
       670 560hngwau64cu -1                                                                    84    1167538
       587 a00qb2ncb6v17 -1                                                                    84    1167586
       578 8w93xtz5tsmxh TM_MEASUREMAIN                           TABLE                        84    1167538
       551 fswbhk5f1mh4m -1                                                                    84    1167586


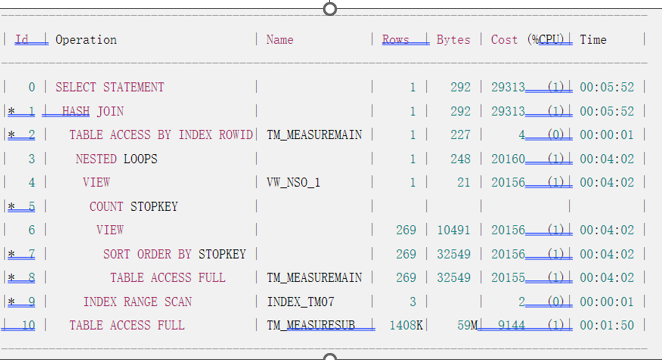
# 560hngwau64cu查看执行计划信息


最后修改时间:2022-12-11 11:04:59
「喜欢这篇文章,您的关注和赞赏是给作者最好的鼓励」
关注作者
【版权声明】本文为墨天轮用户原创内容,转载时必须标注文章的来源(墨天轮),文章链接,文章作者等基本信息,否则作者和墨天轮有权追究责任。如果您发现墨天轮中有涉嫌抄袭或者侵权的内容,欢迎发送邮件至:contact@modb.pro进行举报,并提供相关证据,一经查实,墨天轮将立刻删除相关内容。

评论