


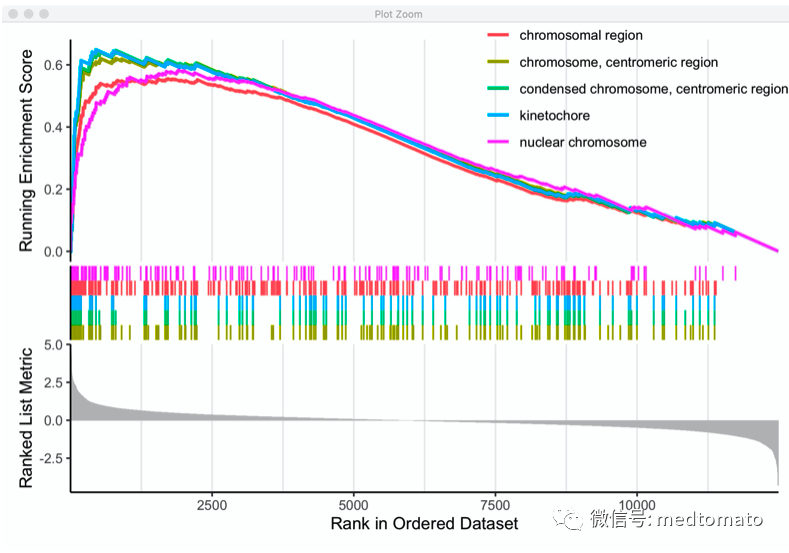
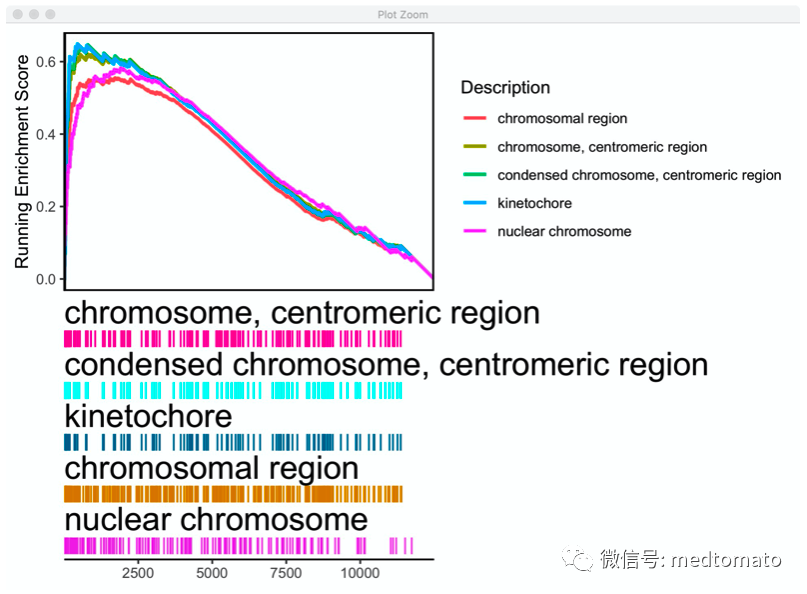
群里有老师分享了文献里的这样一个图:

GSEA的可视化方式有若干种,我之前写过fgsea两分钟实现GSEA,这幅图看起来就像是把gseaplot2的图进行了拆解,没有添加什么其他信息,所以只要对gseaplot2输出的结果做一点点改写应该就可以,我尝试画一下:
library(clusterProfiler)library(enrichplot)library(org.Hs.eg.db)library(patchwork)library(ggpubr)data(geneList,package = "DOSE")ego3 <- gseGO(geneList = geneList,OrgDb = org.Hs.eg.db,ont = "CC",nPerm = 1000,minGSSize = 100,maxGSSize = 500,pvalueCutoff = 0.05,verbose = FALSE)gseaplot2(ego3,ego3@result$ID[1:5])
为了方便后续使用,直接写成函数,一键出图:
library(ggplot2)library(RColorBrewer)# 定义足够多的颜色,可以自己改cb_palette <- c("#ed1299", "#09f9f5", "#246b93", "#cc8e12", "#d561dd", "#c93f00", "#ddd53e","#4aef7b", "#e86502", "#9ed84e", "#39ba30", "#6ad157", "#8249aa", "#99db27", "#e07233", "#ff523f","#ce2523", "#f7aa5d", "#cebb10", "#03827f", "#931635", "#373bbf", "#a1ce4c", "#ef3bb6", "#d66551","#1a918f", "#ff66fc", "#2927c4", "#7149af" ,"#57e559" ,"#8e3af4" ,"#f9a270" ,"#22547f", "#db5e92","#edd05e", "#6f25e8", "#0dbc21", "#280f7a", "#6373ed", "#5b910f" ,"#7b34c1" ,"#0cf29a" ,"#d80fc1","#dd27ce", "#07a301", "#167275", "#391c82", "#2baeb5","#925bea", "#63ff4f")
mygseaplot= function(obj,id=1:5,col=cb_palette,heights = c(5,5,0.5)){obj%>%gseaplot2(.,obj@result$ID[id],subplots = 2)->mid_plotobj%>%gseaplot2(.,obj@result$ID[id],subplots = 1)->up_plotdata<-mid_plot$datap=list()for (i in id) {data2<-filter(data,Description %in% obj@result$Description[i])data2$ymin<-0data2$ymax<-as.numeric(data2$position)p[[i]]= ggplot(data2, aes_(x = ~x)) +geom_linerange(aes_(ymin = ~ymin,ymax = ~ymax),color = col[i]) +xlab(NULL) + ylab(NULL) +theme_void()+theme(legend.position = "none",plot.margin = margin(t = -0.1, b = 0, unit = "cm"),axis.ticks = element_blank(),axis.text = element_blank(),axis.line.x = element_blank()) +scale_x_continuous(expand = c(0, 0)) +scale_y_continuous(expand = c(0, 0)) +ggtitle(paste0(ego3@result$Description[i]))+theme(plot.title = element_text(size=20))}bottom=ggplot(data, aes_(x = ~x)) +theme_classic()+xlab(NULL) + ylab(NULL) +scale_x_continuous(expand = c(0,0)) +scale_y_continuous(limits = c(0, 0.01))+theme(axis.ticks.y = element_blank(),axis.text.y = element_blank(),axis.line.y = element_blank(),plot.margin = margin(t = -0.1, b = 0, unit = "cm"))mid=do.call(ggarrange,c(p,ncol=1))xx=(up_plot+theme_classic()+theme(plot.margin = margin(t = -0.1, b = 0, unit = "cm"),axis.ticks.x = element_blank(),axis.text.x = element_blank(),axis.line.x = element_blank(),panel.border = element_rect(fill=NA,color="black",size=1)))+mid+bottom+plot_layout(ncol = 1,heights = heights)return(xx)}
pp<-mygseaplot(ego3,id=1:5,heights = c(5,5,0.1))
pp
文章转载自西红柿的空间转录组,如果涉嫌侵权,请发送邮件至:contact@modb.pro进行举报,并提供相关证据,一经查实,墨天轮将立刻删除相关内容。
