
自定义SQL监控
PG_EXPORTER_EXTEND_QUERY_PATH
Path to a YAML file containing custom queries to run. Check outqueries.yaml
for examples of the format.
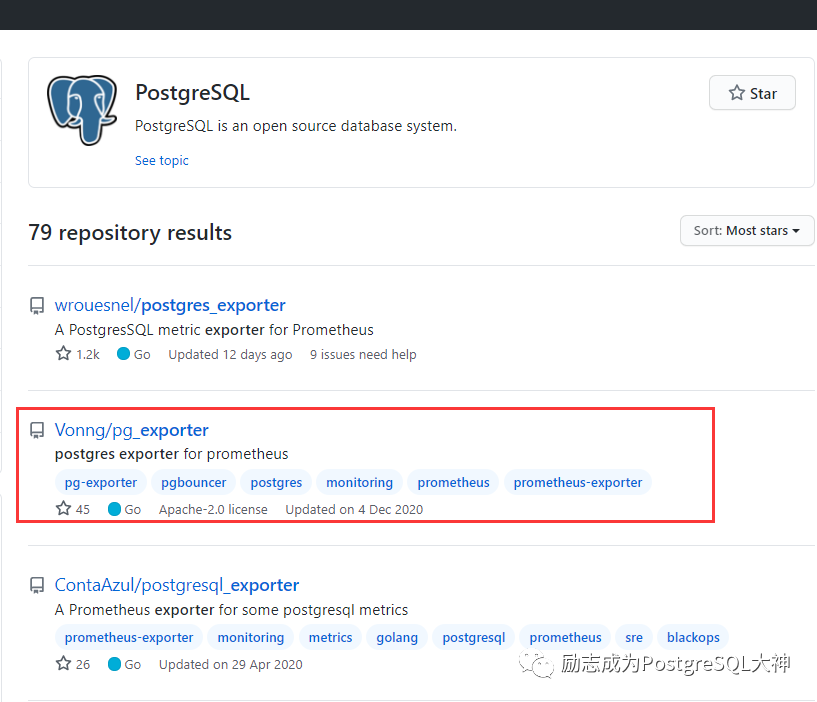
PG_EXPORTER_EXTEND_QUERY_PATH环境变量指定YAML file文件,在文件中配置监控SQL。而queries.yaml的案例如下。
pg_statio_user_tables: query: "SELECT current_database() datname, schemaname, relname, heap_blks_read, heap_blks_hit, idx_blks_read, idx_blks_hit, toast_blks_read, toast_blks_hit, tidx_blks_read, tidx_blks_hit FROM pg_statio_user_tables" metrics: - datname: usage: "LABEL" description: "Name of current database" - schemaname: usage: "LABEL" description: "Name of the schema that this table is in" - relname: usage: "LABEL" description: "Name of this table"............. 复制
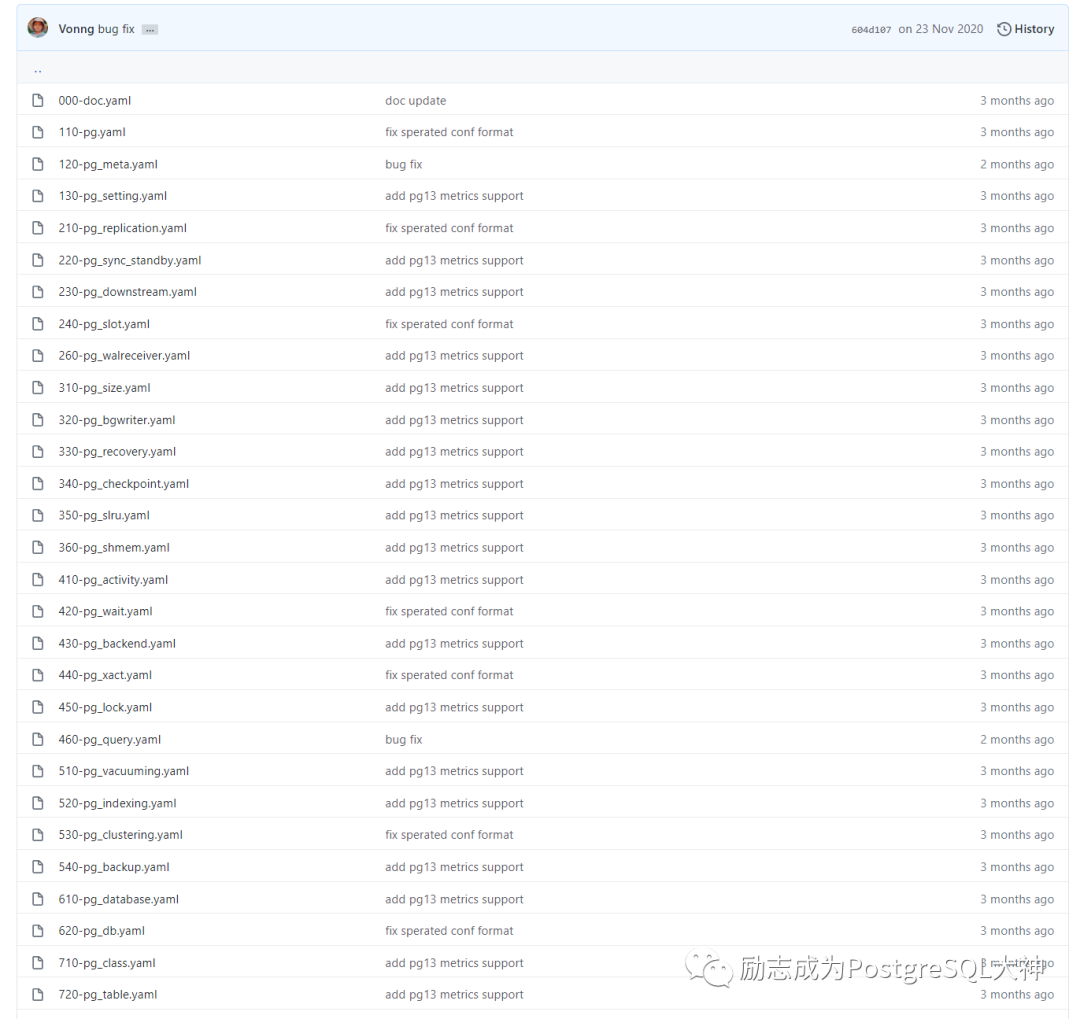
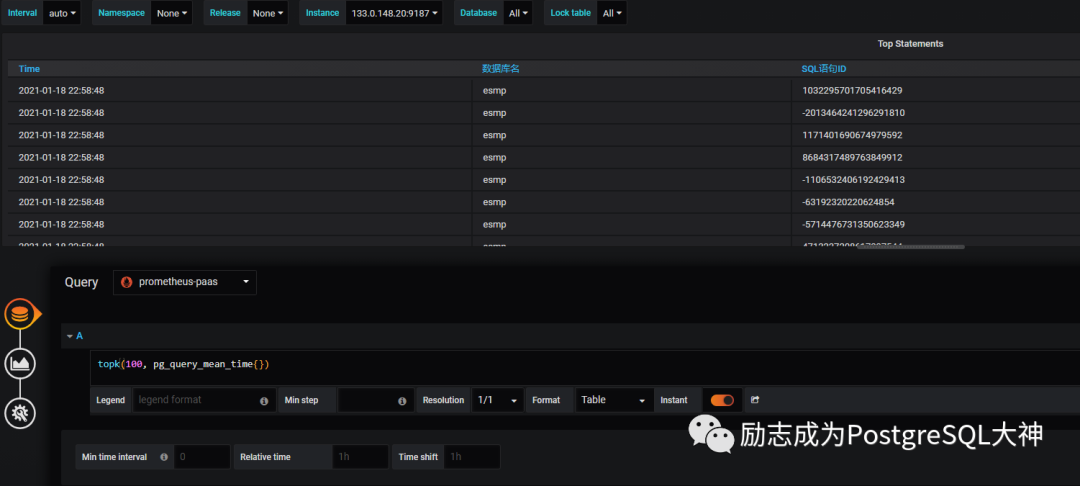
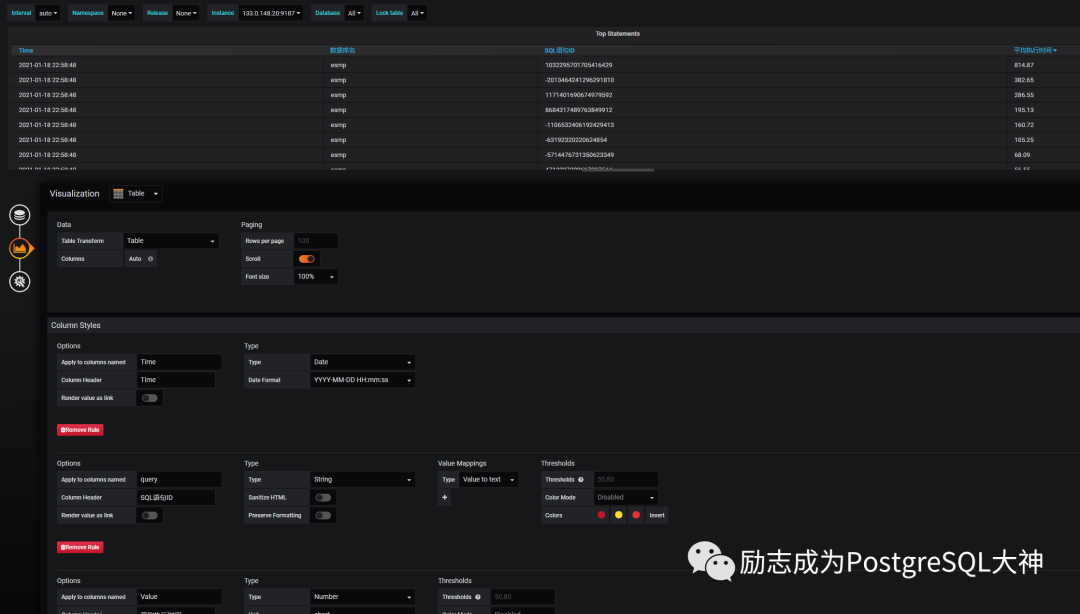
460-pg_query.yaml的配置。
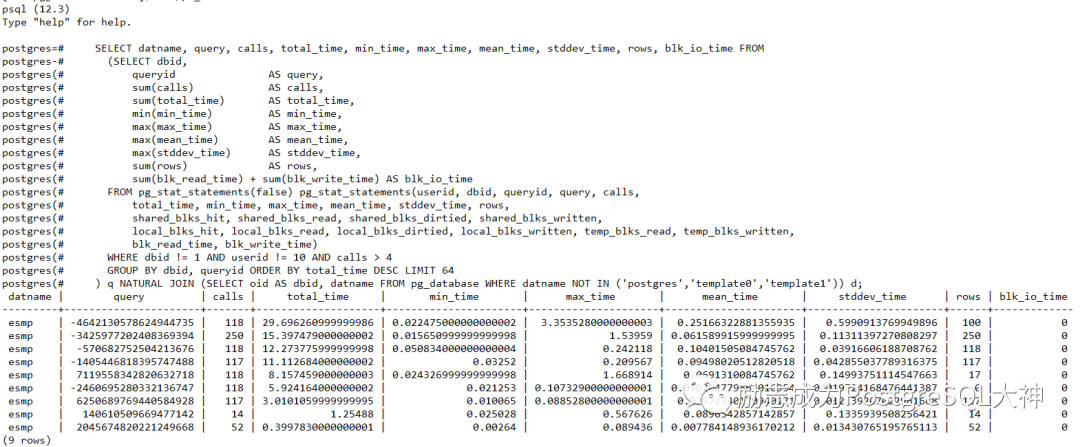
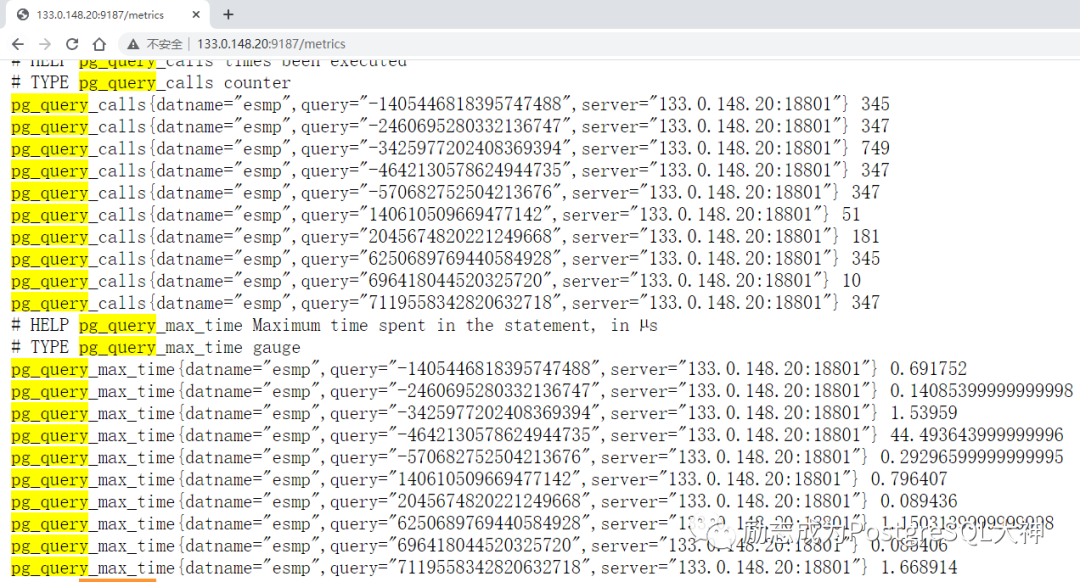
pg_query: name: pg_query desc: PostgreSQL statement metrics, require pg_stat_statements installed in schema monitor, 9.4 ~ 12 query: | SELECT datname, query, calls, total_time, min_time, max_time, mean_time, stddev_time, rows, blk_io_time FROM (SELECT dbid, queryid AS query, sum(calls) AS calls, sum(total_time) AS total_time, min(min_time) AS min_time, max(max_time) AS max_time, max(mean_time) AS mean_time, max(stddev_time) AS stddev_time, sum(rows) AS rows, sum(blk_read_time) + sum(blk_write_time) AS blk_io_time FROM pg_stat_statements(false) pg_stat_statements(userid, dbid, queryid, query, calls, total_time, min_time, max_time, mean_time, stddev_time, rows, shared_blks_hit, shared_blks_read, shared_blks_dirtied, shared_blks_written, local_blks_hit, local_blks_read, local_blks_dirtied, local_blks_written, temp_blks_read, temp_blks_written, blk_read_time, blk_write_time) WHERE dbid != 1 AND userid != 10 AND calls > 4 GROUP BY dbid, queryid ORDER BY total_time DESC LIMIT 64 ) q NATURAL JOIN (SELECT oid AS dbid, datname FROM pg_database WHERE datname NOT IN ('postgres','template0','template1')) d; ttl: 10 timeout: 1 min_version: 090400 max_version: 130000 tags: - cluster - extension:pg_stat_statements - schema:monitor metrics: - datname: usage: LABEL description: database name - query: usage: LABEL description: query identifier, bigint - calls: usage: COUNTER description: times been executed - total_time: usage: COUNTER description: Total time spent in the statement, in µs - min_time: usage: GAUGE description: Minimum time spent in the statement, in µs - max_time: usage: GAUGE description: Maximum time spent in the statement, in µs - mean_time: usage: GAUGE description: Mean time spent in the statement, in µs - stddev_time: usage: GAUGE description: Population standard deviation of time spent in the statement, in µs - rows: usage: COUNTER description: rows retrieved or affected by the statement - blk_io_time: usage: COUNTER description: time spent reading/writing blocks in µs (if track_io_timing is enabled) 复制
export DATA_SOURCE_NAME="postgresql://postgres:Sqlite123@192.168.56.119:5432/postgres?sslmode=disable"export PG_EXPORTER_EXTEND_QUERY_PATH="/root/postgres_exporter_v0.8.0_linux-amd64/queries.yaml"./postgres_exporter & 复制

后记
PostgreSQL中文社区欢迎广大技术人员投稿
投稿邮箱:press@postgres.cn
文章转载自PostgreSQL中文社区,如果涉嫌侵权,请发送邮件至:contact@modb.pro进行举报,并提供相关证据,一经查实,墨天轮将立刻删除相关内容。


