


爬取全球天气数据并可视化。(爬虫源码,数据分析源码和可视化源码附在文末)
小土豆好奇又猜不到甲方用来干嘛,天气数据用途很nice,还有战略意义。土豆对天气的看法 ,15~20℃,冷凉的气候适合Potato growth
 茁壮成长。
茁壮成长。
 搞错了再来
搞错了再来
老美80%的企业将天气作为影响盈余状况的重要因素。美利坚前商务部长威廉·戴利在国会作证时也说:”美国经济约有40%直接受到天气的影响。”美国每年备战飓风等灾害的资金就高达数百亿。
全球碳中和趋势下。无论是天气期货碳积分等等的天气经济指标,金融衍生品都表明——天气,越来越重要。
1、数据获取(这里土豆以中国天气为例,其他数据资源参考其他网站)
网址分析:
http://www.weather.com.cn/weather1d/101210101.shtml
这里土豆以杭州天气为例,爬取不同地区数据只需修改101210101地区编号。网址中的weather代表7天的网页,weather1d代表当天,weather15d代表未来14天。土豆就访问7天和14天的中国天气网吧。
requests.get()方法请求,成功访问则得到网页所有字符串文本。请求过程代码如下:
def getHTMLtext(url):"""请求获得网页内容"""try:r = requests.get(url, timeout = 30)r.raise_for_status()r.encoding = r.apparent_encodingprint("成功访问")return r.textexcept:print("访问错误")return" "
数据提取:
土豆用BeautifulSoup库提取,对网页检查获取需要数据的HTML标签,发现7天数据在<div>标签中id=“7d”,日期、天气、温度、风级等数据在ul和li标签。
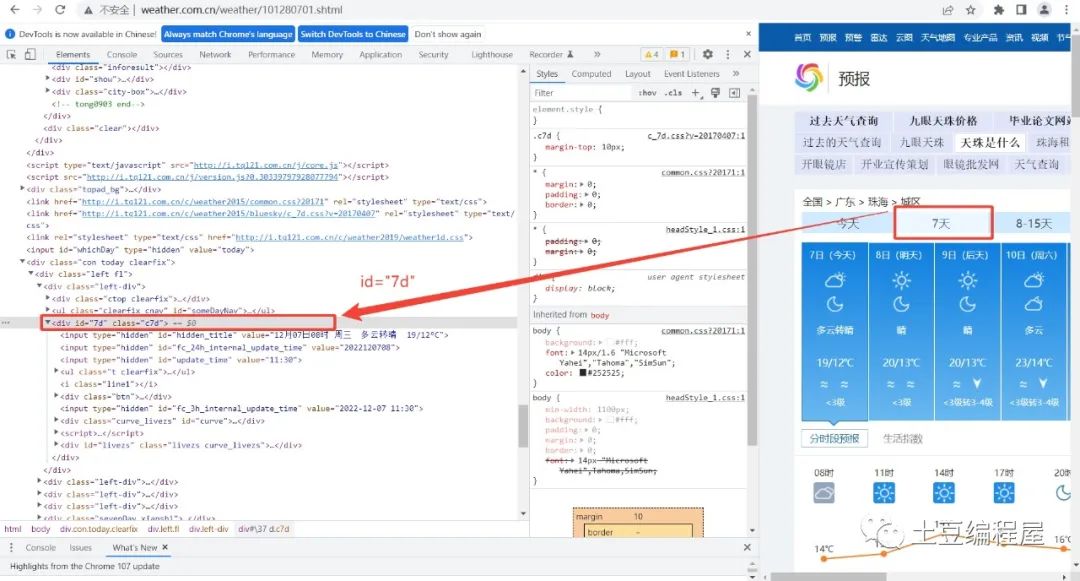
BeautifulSoup对网页字符串文本查找div标签id=“7d”,找出所有ul和li标签,提取标签相应数据值,保存到对应列表。
数据预处理小细节:
这里处理数据的一个细节是有日期没有最高气温,没有数据的情况要判断并处理。一些数据保存的格式和数据类型也要预处理,类如温度后面的摄氏度符号,日期数字的提取,和风级文字的提取,需要字符查找和字符串切片处理。
def get_content(html):"""处理得到有用信息保存数据文件"""final = [] # 初始化一个列表保存数据bs = BeautifulSoup(html, "html.parser") # 创建BeautifulSoup对象body = bs.bodydata = body.find('div', {'id': '7d'}) # 找到div标签且id = 7d
开始爬取:
爬取当天数据
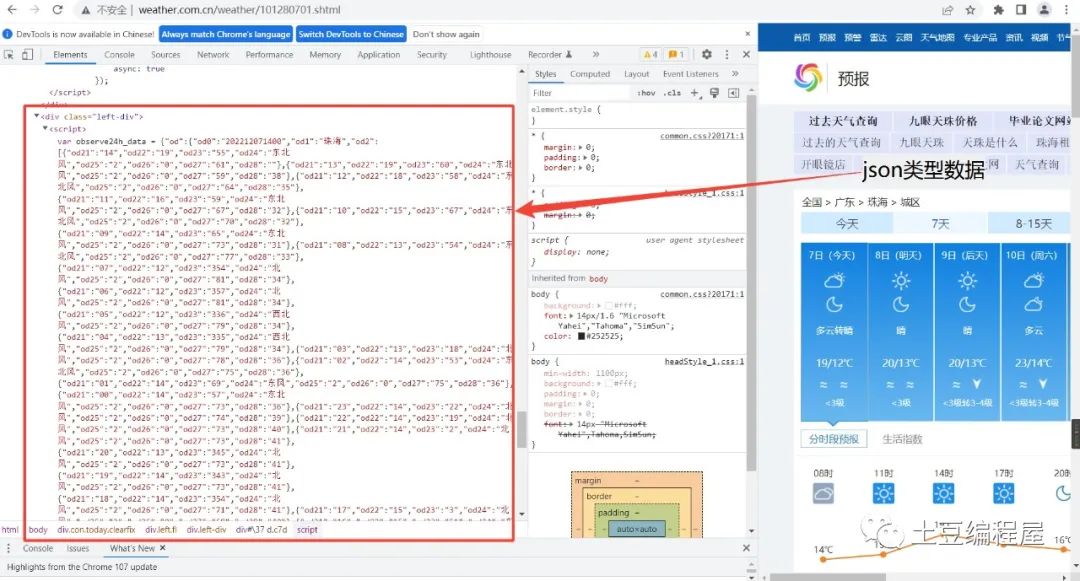
data2 = body.find_all('div',{'class':'left-div'})text = data2[2].find('script').stringtext = text[text.index('=')+1 :-2] # 移除改var data=将其变为json数据jd = json.loads(text)dayone = jd['od']['od2'] # 找到当天的数据final_day = [] # 存放当天的数据count = 0for i in dayone:temp = []if count <=23:temp.append(i['od21']) # 添加时间temp.append(i['od22']) # 添加当前时刻温度temp.append(i['od24']) # 添加当前时刻风力方向temp.append(i['od25']) # 添加当前时刻风级temp.append(i['od26']) # 添加当前时刻降水量temp.append(i['od27']) # 添加当前时刻相对湿度temp.append(i['od28']) # 添加当前时刻控制质量#print(temp)final_day.append(temp)count = count +1
爬取7天数据
ul = data.find('ul') # 找到所有的ul标签li = ul.find_all('li') # 找到左右的li标签i = 0 # 控制爬取的天数for day in li: # 遍历找到的每一个liif i < 7 and i > 0:temp = [] # 临时存放每天的数据date = day.find('h1').string # 得到日期date = date[0:date.index('日')] # 取出日期号temp.append(date)inf = day.find_all('p') # 找出li下面的p标签,提取第一个p标签的值,即天气temp.append(inf[0].string)tem_low = inf[1].find('i').string # 找到最低气温if inf[1].find('span') is None: # 天气预报可能没有最高气温tem_high = Noneelse:tem_high = inf[1].find('span').string # 找到最高气温temp.append(tem_low[:-1])if tem_high[-1] == '℃':temp.append(tem_high[:-1])else:temp.append(tem_high)wind = inf[2].find_all('span') # 找到风向for j in wind:temp.append(j['title'])wind_scale = inf[2].find('i').string # 找到风级index1 = wind_scale.index('级')temp.append(int(wind_scale[index1-1:index1]))final.append(temp)i = i + 1return final_day,final
对“/weather15d”15天的信息,15天网页只有8-14天,前面1-7天在/weather里,分别访问两个网页将爬取数据合并得到14天的数据。前面未来14天的数据爬取过程,当天24小时的天气数据是json数据,通过json.loads()方法获取当天数据进而提取。
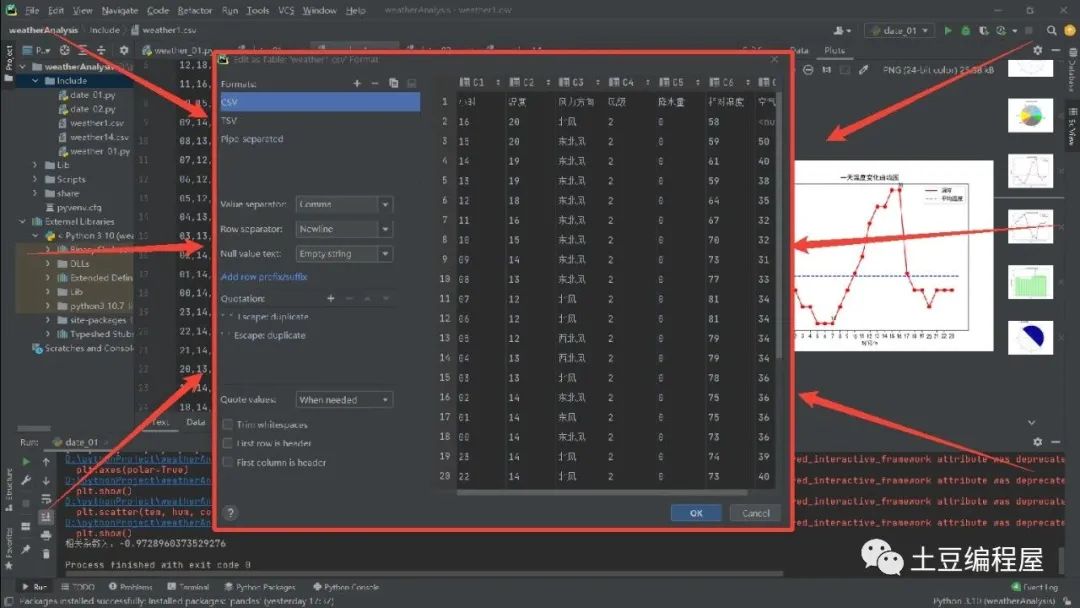

分析发现最高温20℃,最低温12℃,平均温度14.4℃左右,昼夜温差32℃,低温分布在凌晨,高温分布在中午到下午。
24h相对湿度变化曲线
温度和湿度之间是有关系的,plt.scatter()将温度为横坐标、湿度为纵坐标,每个时刻在图中点出来,计算相关系数,更加直观地感受这种关系。

呈负相关,温度较低,空气水分含量较多,湿度自然较高,而温度较高,水分蒸发,空气干燥,湿度较低,符合气候规律。
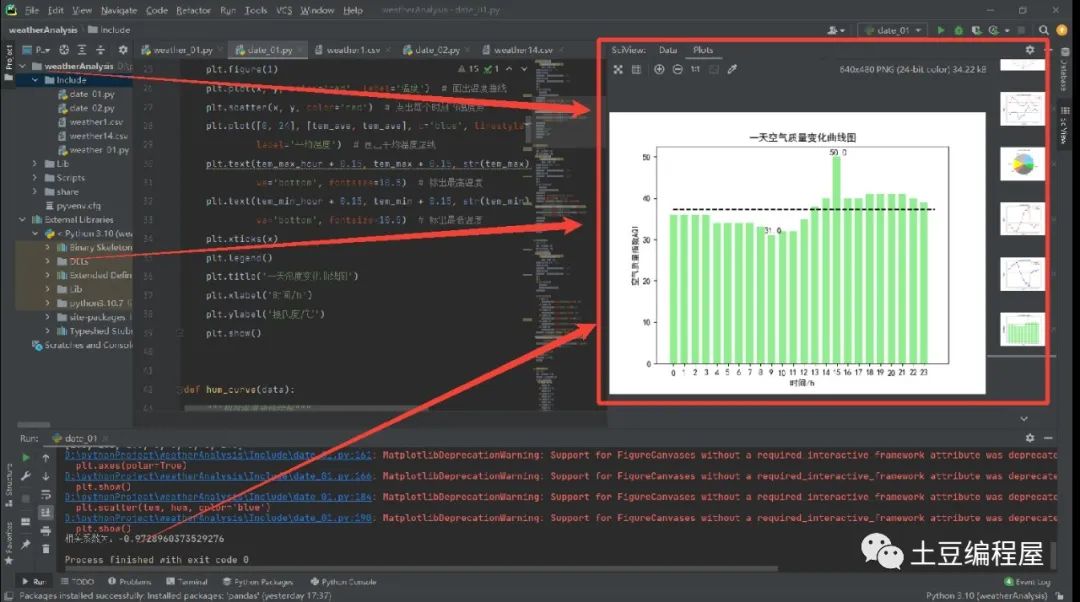
空气质量指数柱状图


近日小事
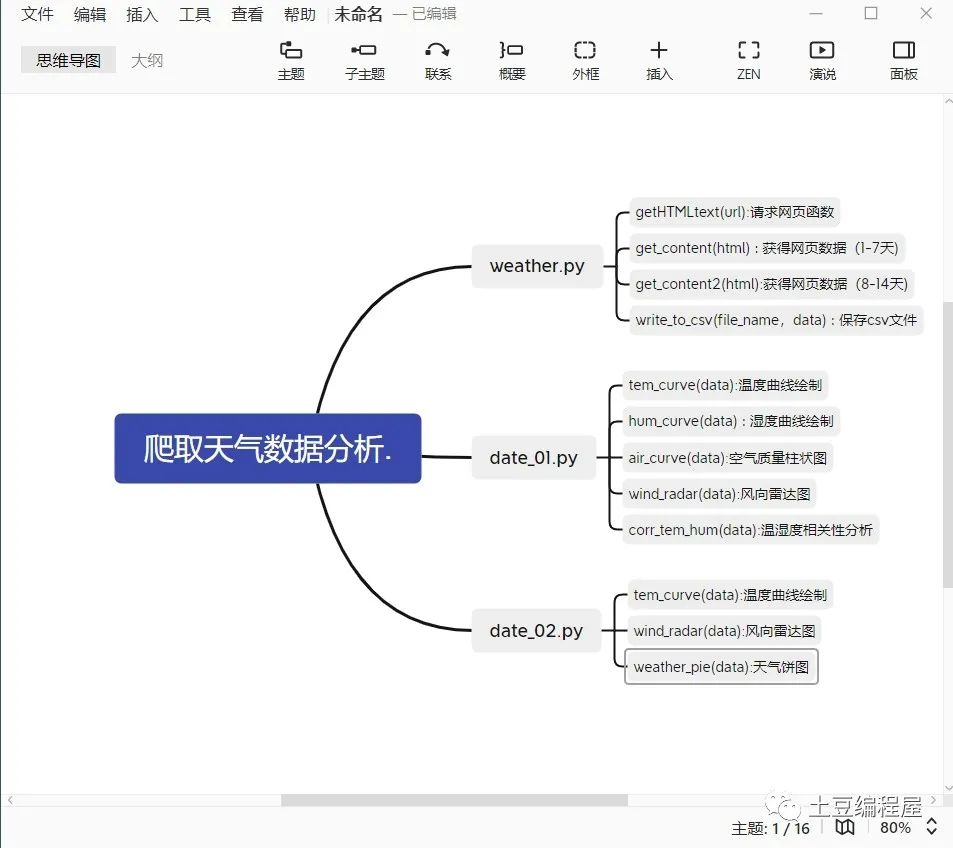
# weather.pyimport requestsfrom bs4 import BeautifulSoupimport csvimport jsondef getHTMLtext(url):"""请求获得网页内容"""try:r = requests.get(url, timeout=30)r.raise_for_status()r.encoding = r.apparent_encodingprint("成功访问")return r.textexcept:print("访问错误")return " "def get_content(html):"""处理得到有用信息保存数据文件"""final = [] # 初始化一个列表保存数据bs = BeautifulSoup(html, "html.parser") # 创建BeautifulSoup对象body = bs.bodydata = body.find('div', {'id': '7d'}) # 找到div标签且id = 7d# 下面爬取当天的数据data2 = body.find_all('div', {'class': 'left-div'})text = data2[2].find('script').stringtext = text[text.index('=') + 1:-2] # 移除改var data=将其变为json数据jd = json.loads(text)dayone = jd['od']['od2'] # 找到当天的数据final_day = [] # 存放当天的数据count = 0for i in dayone:temp = []if count <= 23:temp.append(i['od21']) # 添加时间temp.append(i['od22']) # 添加当前时刻温度temp.append(i['od24']) # 添加当前时刻风力方向temp.append(i['od25']) # 添加当前时刻风级temp.append(i['od26']) # 添加当前时刻降水量temp.append(i['od27']) # 添加当前时刻相对湿度temp.append(i['od28']) # 添加当前时刻控制质量# print(temp)final_day.append(temp)count = count + 1# 下面爬取7天的数据ul = data.find('ul') # 找到所有的ul标签li = ul.find_all('li') # 找到左右的li标签i = 0 # 控制爬取的天数for day in li: # 遍历找到的每一个liif i < 7 and i > 0:temp = [] # 临时存放每天的数据date = day.find('h1').string # 得到日期date = date[0:date.index('日')] # 取出日期号temp.append(date)inf = day.find_all('p') # 找出li下面的p标签,提取第一个p标签的值,即天气temp.append(inf[0].string)tem_low = inf[1].find('i').string # 找到最低气温if inf[1].find('span') is None: # 天气预报可能没有最高气温tem_high = Noneelse:tem_high = inf[1].find('span').string # 找到最高气温temp.append(tem_low[:-1])if tem_high[-1] == '℃':temp.append(tem_high[:-1])else:temp.append(tem_high)wind = inf[2].find_all('span') # 找到风向for j in wind:temp.append(j['title'])wind_scale = inf[2].find('i').string # 找到风级index1 = wind_scale.index('级')temp.append(int(wind_scale[index1 - 1:index1]))final.append(temp)i = i + 1return final_day, final# print(final)def get_content2(html):"""处理得到有用信息保存数据文件"""final = [] # 初始化一个列表保存数据bs = BeautifulSoup(html, "html.parser") # 创建BeautifulSoup对象body = bs.bodydata = body.find('div', {'id': '15d'}) # 找到div标签且id = 15dul = data.find('ul') # 找到所有的ul标签li = ul.find_all('li') # 找到左右的li标签final = []i = 0 # 控制爬取的天数for day in li: # 遍历找到的每一个liif i < 8:temp = [] # 临时存放每天的数据date = day.find('span', {'class': 'time'}).string # 得到日期date = date[date.index('(') + 1:-2] # 取出日期号temp.append(date)weather = day.find('span', {'class': 'wea'}).string # 找到天气temp.append(weather)tem = day.find('span', {'class': 'tem'}).text # 找到温度temp.append(tem[tem.index('/') + 1:-1]) # 找到最低气温temp.append(tem[:tem.index('/') - 1]) # 找到最高气温wind = day.find('span', {'class': 'wind'}).string # 找到风向if '转' in wind: # 如果有风向变化temp.append(wind[:wind.index('转')])temp.append(wind[wind.index('转') + 1:])else: # 如果没有风向变化,前后风向一致temp.append(wind)temp.append(wind)wind_scale = day.find('span', {'class': 'wind1'}).string # 找到风级index1 = wind_scale.index('级')temp.append(int(wind_scale[index1 - 1:index1]))final.append(temp)return finaldef write_to_csv(file_name, data, day=14):"""保存为csv文件"""with open(file_name, 'a', errors='ignore', newline='') as f:if day == 14:header = ['日期', '天气', '最低气温', '最高气温', '风向1', '风向2', '风级']else:header = ['小时', '温度', '风力方向', '风级', '降水量', '相对湿度', '空气质量']f_csv = csv.writer(f)f_csv.writerow(header)f_csv.writerows(data)def main():"""主函数"""print("Weather test")# 珠海url1 = 'http://www.weather.com.cn/weather/101210101.shtml' # 7天天气中国天气网url2 = 'http://www.weather.com.cn/weather15d/101210101.shtml' # 8-15天天气中国天气网html1 = getHTMLtext(url1)data1, data1_7 = get_content(html1) # 获得1-7天和当天的数据html2 = getHTMLtext(url2)data8_14 = get_content2(html2) # 获得8-14天数据data14 = data1_7 + data8_14# print(data)write_to_csv('weather14.csv', data14, 14) # 保存为csv文件write_to_csv('weather1.csv', data1, 1)if __name__ == '__main__':main()
# date_01.pyimport matplotlib.pyplot as pltimport numpy as npimport pandas as pdimport mathdef tem_curve(data):"""温度曲线绘制"""hour = list(data['小时'])tem = list(data['温度'])for i in range(0, 24):if math.isnan(tem[i]) == True:tem[i] = tem[i - 1]tem_ave = sum(tem) 24 # 求平均温度tem_max = max(tem)tem_max_hour = hour[tem.index(tem_max)] # 求最高温度tem_min = min(tem)tem_min_hour = hour[tem.index(tem_min)] # 求最低温度x = []y = []for i in range(0, 24):x.append(i)y.append(tem[hour.index(i)])plt.figure(1)plt.plot(x, y, color='red', label='温度') # 画出温度曲线plt.scatter(x, y, color='red') # 点出每个时刻的温度点plt.plot([0, 24], [tem_ave, tem_ave], c='blue', linestyle='--',label='平均温度') # 画出平均温度虚线plt.text(tem_max_hour + 0.15, tem_max + 0.15, str(tem_max), ha='center',va='bottom', fontsize=10.5) # 标出最高温度plt.text(tem_min_hour + 0.15, tem_min + 0.15, str(tem_min), ha='center',va='bottom', fontsize=10.5) # 标出最低温度plt.xticks(x)plt.legend()plt.title('一天温度变化曲线图')plt.xlabel('时间/h')plt.ylabel('摄氏度/℃')plt.show()def hum_curve(data):"""相对湿度曲线绘制"""hour = list(data['小时'])hum = list(data['相对湿度'])for i in range(0, 24):if math.isnan(hum[i]) == True:hum[i] = hum[i - 1]hum_ave = sum(hum) 24 # 求平均相对湿度hum_max = max(hum)hum_max_hour = hour[hum.index(hum_max)] # 求最高相对湿度hum_min = min(hum)hum_min_hour = hour[hum.index(hum_min)] # 求最低相对湿度x = []y = []for i in range(0, 24):x.append(i)y.append(hum[hour.index(i)])plt.figure(2)plt.plot(x, y, color='blue', label='相对湿度') # 画出相对湿度曲线plt.scatter(x, y, color='blue') # 点出每个时刻的相对湿度plt.plot([0, 24], [hum_ave, hum_ave], c='red', linestyle='--',label='平均相对湿度') # 画出平均相对湿度虚线plt.text(hum_max_hour + 0.15, hum_max + 0.15, str(hum_max), ha='center',va='bottom', fontsize=10.5) # 标出最高相对湿度plt.text(hum_min_hour + 0.15, hum_min + 0.15, str(hum_min), ha='center',va='bottom', fontsize=10.5) # 标出最低相对湿度plt.xticks(x)plt.legend()plt.title('一天相对湿度变化曲线图')plt.xlabel('时间/h')plt.ylabel('百分比/%')plt.show()def air_curve(data):"""空气质量曲线绘制"""hour = list(data['小时'])air = list(data['空气质量'])print(type(air[0]))for i in range(0, 24):if math.isnan(air[i]) == True:air[i] = air[i - 1]air_ave = sum(air) 24 # 求平均空气质量air_max = max(air)air_max_hour = hour[air.index(air_max)] # 求最高空气质量air_min = min(air)air_min_hour = hour[air.index(air_min)] # 求最低空气质量x = []y = []for i in range(0, 24):x.append(i)y.append(air[hour.index(i)])plt.figure(3)for i in range(0, 24):if y[i] <= 50:plt.bar(x[i], y[i], color='lightgreen', width=0.7) # 1等级elif y[i] <= 100:plt.bar(x[i], y[i], color='wheat', width=0.7) # 2等级elif y[i] <= 150:plt.bar(x[i], y[i], color='orange', width=0.7) # 3等级elif y[i] <= 200:plt.bar(x[i], y[i], color='orangered', width=0.7) # 4等级elif y[i] <= 300:plt.bar(x[i], y[i], color='darkviolet', width=0.7) # 5等级elif y[i] > 300:plt.bar(x[i], y[i], color='maroon', width=0.7) # 6等级plt.plot([0, 24], [air_ave, air_ave], c='black',linestyle='--') # 画出平均空气质量虚线plt.text(air_max_hour + 0.15, air_max + 0.15, str(air_max), ha='center',va='bottom', fontsize=10.5) # 标出最高空气质量plt.text(air_min_hour + 0.15, air_min + 0.15, str(air_min), ha='center',va='bottom', fontsize=10.5) # 标出最低空气质量plt.xticks(x)plt.title('一天空气质量变化曲线图')plt.xlabel('时间/h')plt.ylabel('空气质量指数AQI')plt.show()def wind_radar(data):"""风向雷达图"""wind = list(data['风力方向'])wind_speed = list(data['风级'])for i in range(0, 24):if wind[i] == "北风":wind[i] = 90elif wind[i] == "南风":wind[i] = 270elif wind[i] == "西风":wind[i] = 180elif wind[i] == "东风":wind[i] = 360elif wind[i] == "东北风":wind[i] = 45elif wind[i] == "西北风":wind[i] = 135elif wind[i] == "西南风":wind[i] = 225elif wind[i] == "东南风":wind[i] = 315degs = np.arange(45, 361, 45)temp = []for deg in degs:speed = []# 获取 wind_deg 在指定范围的风速平均值数据for i in range(0, 24):if wind[i] == deg:speed.append(wind_speed[i])if len(speed) == 0:temp.append(0)else:temp.append(sum(speed) len(speed))print(temp)N = 8theta = np.arange(0. + np.pi 8, 2 * np.pi + np.pi 8, 2 * np.pi 8)# 数据极径radii = np.array(temp)# 绘制极区图坐标系plt.axes(polar=True)# 定义每个扇区的RGB值(R,G,B),x越大,对应的颜色越接近蓝色colors = [(1 - x max(temp), 1 - x max(temp), 0.6) for x in radii]plt.bar(theta, radii, width=(2 * np.pi N), bottom=0.0, color=colors)plt.title('一天风级图', x=0.2, fontsize=20)plt.show()def calc_corr(a, b):"""计算相关系数"""a_avg = sum(a) len(a)b_avg = sum(b) len(b)cov_ab = sum([(x - a_avg) * (y - b_avg) for x, y in zip(a, b)])sq = math.sqrt(sum([(x - a_avg) ** 2 for x in a]) * sum([(x - b_avg) ** 2 for x in b]))corr_factor = cov_ab sqreturn corr_factordef corr_tem_hum(data):"""温湿度相关性分析"""tem = data['温度']hum = data['相对湿度']plt.scatter(tem, hum, color='blue')plt.title("温湿度相关性分析图")plt.xlabel("温度/℃")plt.ylabel("相对湿度/%")plt.text(20, 40, "相关系数为:" + str(calc_corr(tem, hum)),fontdict={'size': '10', 'color': 'red'})plt.show()print("相关系数为:" + str(calc_corr(tem, hum)))def main():plt.rcParams['font.sans-serif'] = ['SimHei'] # 解决中文显示问题plt.rcParams['axes.unicode_minus'] = False # 解决负号显示问题data1 = pd.read_csv('weather1.csv', encoding='gb2312')print(data1)tem_curve(data1)hum_curve(data1)air_curve(data1)wind_radar(data1)corr_tem_hum(data1)if __name__ == '__main__':main()
# date_02.pyimport matplotlib.pyplot as pltimport numpy as npimport pandas as pdimport mathdef tem_curve(data):"""温度曲线绘制"""date = list(data['日期'])tem_low = list(data['最低气温'])tem_high = list(data['最高气温'])for i in range(0, 14):if math.isnan(tem_low[i]):tem_low[i] = tem_low[i - 1]# tem_low[i] = str(tem_low[i])if math.isnan(tem_high[i]):tem_high[i] = tem_high[i - 1]tem_high_ave = sum(tem_high) 14 # 求平均高温tem_low_ave = sum(tem_low) 14 # 求平均低温tem_max = max(tem_high)tem_max_date = tem_high.index(tem_max) # 求最高温度tem_min = min(tem_low)tem_min_date = tem_low.index(tem_min) # 求最低温度x = range(1, 15)plt.figure(1)plt.plot(x, tem_high, color='red', label='高温') # 画出高温度曲线plt.scatter(x, tem_high, color='red') # 点出每个时刻的温度点plt.plot(x, tem_low, color='blue', label='低温') # 画出低温度曲线plt.scatter(x, tem_low, color='blue') # 点出每个时刻的温度点plt.plot([1, 15], [tem_high_ave, tem_high_ave], c='black',linestyle='--') # 画出平均温度虚线plt.plot([1, 15], [tem_low_ave, tem_low_ave], c='black',linestyle='--') # 画出平均温度虚线plt.legend()plt.text(tem_max_date + 0.15, tem_max + 0.15, str(tem_max), ha='center',va='bottom', fontsize=10.5) # 标出最高温度plt.text(tem_min_date + 0.15, tem_min + 0.15, str(tem_min), ha='center',va='bottom', fontsize=10.5) # 标出最低温度plt.xticks(x)plt.title('未来14天高温低温变化曲线图')plt.xlabel('未来天数/天')plt.ylabel('摄氏度/℃')plt.show()def change_wind(wind):"""改变风向"""for i in range(0, 14):if wind[i] == "北风":wind[i] = 90elif wind[i] == "南风":wind[i] = 270elif wind[i] == "西风":wind[i] = 180elif wind[i] == "东风":wind[i] = 360elif wind[i] == "东北风":wind[i] = 45elif wind[i] == "西北风":wind[i] = 135elif wind[i] == "西南风":wind[i] = 225elif wind[i] == "东南风":wind[i] = 315return winddef wind_radar(data):"""风向雷达图"""wind1 = list(data['风向1'])wind2 = list(data['风向2'])wind_speed = list(data['风级'])wind1 = change_wind(wind1)wind2 = change_wind(wind2)degs = np.arange(45, 361, 45)temp = []for deg in degs:speed = []# 获取 wind_deg 在指定范围的风速平均值数据for i in range(0, 14):if wind1[i] == deg:speed.append(wind_speed[i])if wind2[i] == deg:speed.append(wind_speed[i])if len(speed) == 0:temp.append(0)else:temp.append(sum(speed) / len(speed))print(temp)N = 8theta = np.arange(0. + np.pi / 8, 2 * np.pi + np.pi / 8, 2 * np.pi / 8)# 数据极径radii = np.array(temp)# 绘制极区图坐标系plt.axes(polar=True)# 定义每个扇区的RGB值(R,G,B),x越大,对应的颜色越接近蓝色colors = [(1 - x / max(temp), 1 - x / max(temp), 0.6) for x in radii]plt.bar(theta, radii, width=(2 * np.pi / N), bottom=0.0, color=colors)plt.title('未来14天风级图', x=0.2, fontsize=20)plt.show()def weather_pie(data):"""绘制天气饼图"""weather = list(data['天气'])dic_wea = {}for i in range(0, 14):if weather[i] in dic_wea.keys():dic_wea[weather[i]] += 1else:dic_wea[weather[i]] = 1print(dic_wea)explode = [0.01] * len(dic_wea.keys())color = ['lightskyblue', 'silver', 'yellow', 'salmon', 'grey', 'lime','gold', 'red', 'green', 'pink']plt.pie(dic_wea.values(), explode=explode, labels=dic_wea.keys(),autopct='%1.1f%%', colors=color)plt.title('未来14天气候分布饼图')plt.show()def main():plt.rcParams['font.sans-serif'] = ['SimHei'] # 解决中文显示问题plt.rcParams['axes.unicode_minus'] = False # 解决负号显示问题data14 = pd.read_csv('weather14.csv', encoding='gb2312')print(data14)tem_curve(data14)wind_radar(data14)weather_pie(data14)if __name__ == '__main__':main()
