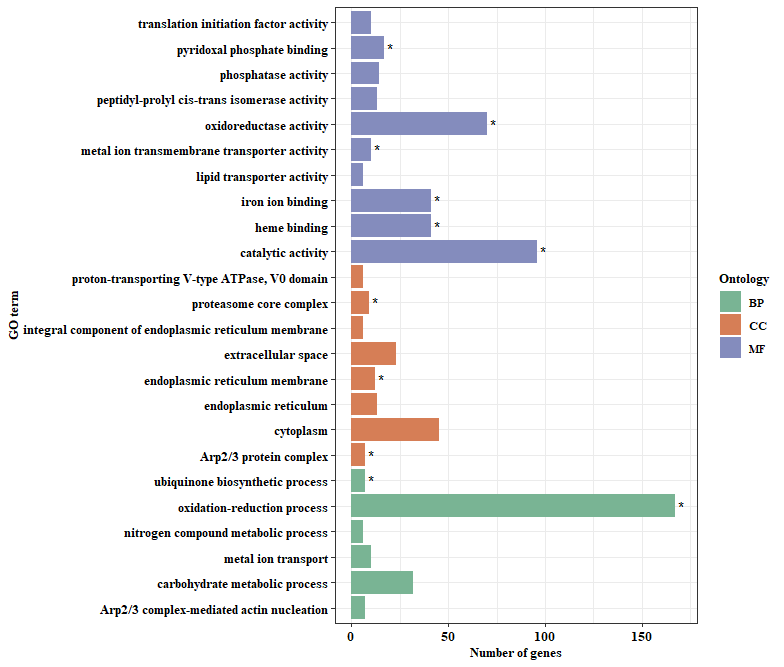
GO = read.table('C:/Users/22954/Desktop/example.txt',sep = '\t',header = T) #读入示例数据
head(GO,n = 10) #查看示例数据前10行
                                           Term      qvalue Count Ontology
1        translation initiation factor activity 0.187278164    10       MF
2  peptidyl-prolyl cis-trans isomerase activity 0.075629003    13       MF
3                            catalytic activity 0.000000204    96       MF
4                    lipid transporter activity 0.093129617     6       MF
5                              iron ion binding 0.000000954    41       MF
6                           extracellular space 0.102888881    23       CC
7                                     cytoplasm 0.075629003    45       CC
8                         endoplasmic reticulum 0.093129617    13       CC
9                endoplasmic reticulum membrane 0.017323157    12       CC
10                      proteasome core complex 0.033071464     9       CC
library(ggplot2)
library(forcats)
ggplot(GO) +
  geom_bar(aes(Count,fct_reorder(Term,Ontology),fill = Ontology),stat="identity") + #将Term按照Ontology排序
  theme_bw() +
  theme(text = element_text(family='serif',size =10,face = 'bold'),axis.text = element_text(family='serif',size =10,face = 'bold',colour = 'black')) +
  geom_text(data = subset(GO,qvalue<0.05,c('Count','Term')),aes(x=Count+3,y=as.factor(Term),label='*')) + #对于qvalue<0.05的term添加*
  labs(x='Number of genes',y='GO term') +
  scale_fill_manual(values=c(BP = "#79B494", CC = "#D67E56", MF = "#848CBD"))
与网上其他教程相比较,本文主要有两点改良,第一,为柱状图进行了排序;第二,为显著的term添加了星号。当然也有人需要x与y轴互换的,这并不是很难,反转一个坐标系,稍微调整调整term字体就差不多了,但我仍然觉得这图就得这么设计才美观,易读。本文不想有太多探讨,直接给岀最终代码方便下次套用模版,毕竟下次抄自己代码还要看太多的文字,实在是太难受了。说了那么多废话,还是想凑够300字,好申请原创,第一次觉得300字很难凑,随便写一写,见凉哈。
文章转载自陈桂森,如果涉嫌侵权,请发送邮件至:contact@modb.pro进行举报,并提供相关证据,一经查实,墨天轮将立刻删除相关内容。


