


先查看github上的文档,prefetch代表:外部表扫描期间通过PostgreSQL和Oracle之间的单次往返获取的行数,这是使用Oracle行预取实现的。该值必须介于0到10240之间,其中零值将禁用预取。设置较大的值可以提高性能,但是在PostgreSQL服务器中会消耗更多的内存。
先来看看我们当前外部表的属性。通过det+可以从FDW options
这一列看到属性
\det+ intf_oa_suserintftbl_to_oa_intf List of foreign tables Schema | Table | Server | FDW options | ------------+---------------------------------+-------------------+--------------------------------------------+ audit_ftab | intf_oa_suserintftbl_to_oa_intf | orafdw_to_oa_intf | (schema 'INTF_OA', "table" 'SUSERINTFTBL') |
当前属性是默认值,什么也没设置,那么也就按照默认值200进行读取。
我们还是使用上次的垃圾SQL来测试。分别创建外部表a1,a2,a3,a4,a5,将prefetch设置为600,900,2000,8292,10240。
create foreign table a3( userid character varying(32) , username character varying(64) , areacode integer , passwd character varying(32) , careacode character varying(32) , deptid character varying(6) , ........................)server orafdw_to_oa_intfoptions (schema 'INTF_OA' ,table 'SUSERINTFTBL',prefetch '600');
然后经过多次执行4个表关联的垃圾SQL。
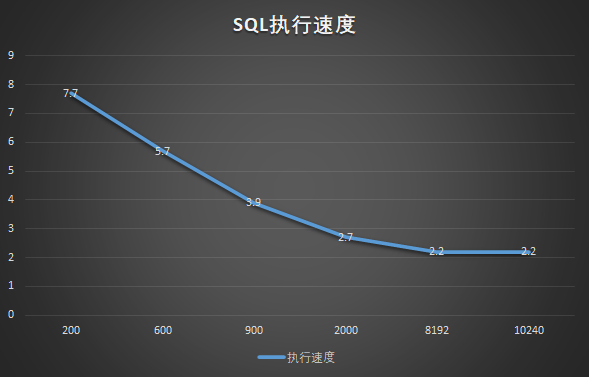
通过测试,当prefetch设置到一定的值后,速度影响比较有限。当然这和我表的数据量有一些关系。我需要再拿一张大表进行测试。我们找到一张2000万的表,然后创建b1,b2,b3,b4,b5,指定prefetch设置为600,900,2000,8292,10240。
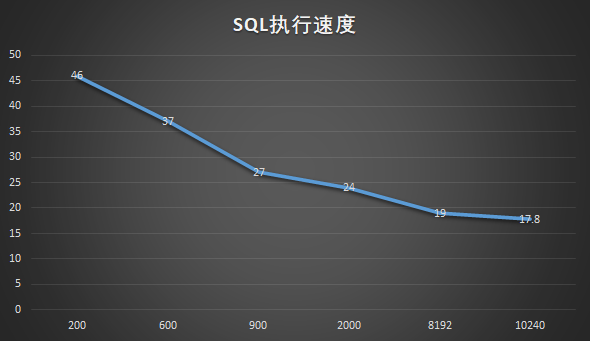
这次执行速度有所提升,但是最后从8192设到10240的时候,只提升了1.2秒。设置成最大值比默认值整体执行时间节约61%。
当然我还要关注一下内存的使用。我们还是对2000万的大表进行扫描,通过扫描观察内存的变化。
mandb=> SELECT pg_backend_pid() pg_backend_pid ---------------- 29715(1 row)while truedo ps uxf | grep mandb | grep 29715 | sort -nk6 | tail -n 1 | tee >( cat - >&2) | awk '{system("cat /proc/"$2"/smaps")}' | grep ^Private | awk '{A+=$2} END{print A}'sleep 3done;postgres 29715 0.0 0.0 16497488 4568 ? Ss 17:10 0:00 \_ postgres: audit_sys jihedb [local] idle1044postgres 29715 0.0 0.0 16497488 4568 ? Ss 17:10 0:00 \_ postgres: audit_sys jihedb [local] idle1044postgres 29715 0.0 0.0 16497488 4568 ? Ss 17:10 0:00 \_ postgres: audit_sys jihedb [local] idle1044postgres 29715 7.4 0.0 16602192 20416 ? Rs 17:10 0:01 \_ postgres: audit_sys jihedb [local] EXPLAIN6140postgres 29715 15.9 0.0 16602192 20416 ? Rs 17:10 0:04 \_ postgres: audit_sys jihedb [local] EXPLAIN6140postgres 29715 22.1 0.0 16602192 20416 ? Rs 17:10 0:07 \_ postgres: audit_sys jihedb [local] EXPLAIN6140postgres 29715 27.6 0.0 16602192 20416 ? Rs 17:10 0:09 \_ postgres: audit_sys jihedb [local] EXPLAIN6140postgres 29715 32.1 0.0 16602192 20416 ? Rs 17:10 0:12 \_ postgres: audit_sys jihedb [local] EXPLAIN6140postgres 29715 36.0 0.0 16602192 20416 ? Rs 17:10 0:14 \_ postgres: audit_sys jihedb [local] EXPLAIN6140postgres 29715 35.9 0.0 16602192 20680 ? Ss 17:10 0:15 \_ postgres: audit_sys jihedb [local] idle6168
从执行过程来看,消耗实际内存占用20MB(RSS),Private memory仅仅消耗了6MB。我们来试试select * 操作2000万的大表。
SELECT pg_backend_pid(); pg_backend_pid ---------------- 30392(1 row)postgres 30751 79.6 0.0 16609804 27976 ? Rs 17:14 1:45 \_ postgres: audit_sys jihedb [local] EXPLAIN13772postgres 30751 80.6 0.0 16609940 28240 ? Ss 17:14 1:54 \_ postgres: audit_sys jihedb [local] EXPLAIN13820postgres 30751 81.4 0.0 16609940 28240 ? Rs 17:14 2:03 \_ postgres: audit_sys jihedb [local] EXPLAIN13836postgres 30751 82.1 0.0 16609940 28240 ? Rs 17:14 2:13 \_ postgres: audit_sys jihedb [local] EXPLAIN13840postgres 30751 82.2 0.0 16609940 28240 ? Rs 17:14 2:22 \_ postgres: audit_sys jihedb [local] EXPLAIN13840postgres 30751 82.3 0.0 16609940 28240 ? Rs 17:14 2:30 \_ postgres: audit_sys jihedb [local] EXPLAIN13840postgres 30751 82.9 0.0 16609940 28240 ? Rs 17:14 2:40 \_ postgres: audit_sys jihedb [local] EXPLAIN13840postgres 30751 83.5 0.0 16609940 28240 ? Rs 17:14 2:49 \_ postgres: audit_sys jihedb [local] EXPLAIN13840postgres 30751 84.0 0.0 16609940 28240 ? Rs 17:14 2:58 \_ postgres: audit_sys jihedb [local] EXPLAIN13856postgres 30751 84.4 0.0 16609940 28240 ? Rs 17:14 3:08 \_ postgres: audit_sys jihedb [local] EXPLAIN13856postgres 30751 84.8 0.0 16609940 28240 ? Rs 17:14 3:17 \_ postgres: audit_sys jihedb [local] EXPLAIN13856postgres 30751 85.1 0.0 16609940 28240 ? Rs 17:14 3:26 \_ postgres: audit_sys jihedb [local] EXPLAIN13860
从执行了3分钟的情况来看,消耗内存28MB(RSS),但是Private memory仅仅是13.8MB。
后记
今天测试了oracle_fdw的prefetch参数值大小对性能的影响,结论是建议把prefetch设置到最大值10240。这样速度上相比默认会有大约60%的提升。对于占用内存,发现在prefetch设置为10240后,对2000万表进行select*查询,进程内存和私有内存使用还是可控的,并没出现大幅增长。当然这是在我PostgreSQL 12.3环境上测试的,具体情况还得看你的机器配置,以上测试仅供参考。
