


简介
PoWA--PostgreSQL 负载分析工具
本文主要介绍 PG 的一个性能采集和分析工具 PoWA 的部署方法和使用特点,该工具利用 PG 的扩展插件实现,其性能诊断分析能力比较接近 ORACLE AWR 报表功能。
PoWA是PostgreSQL 9.4及以后更新版本的性能工具,允许从各种Stats Extensions收集、聚合和清除多个 PostgreSQL 实例的统计信息,全称为PostgreSQL工作负载分析器(PostgreSQL Workload Analyzer)。
PoWA组成部分如下:
PoWA-archivist是PostgreSQL的插件,收集其他插件获取到的性能统计数据。PoWA-archivist是PoWA的核心组件。其主要有如下2个部分:
名为“powa”的管理功能扩展。
名为“powa”的模块,可以选择作为后台工作程序运行,用以收集本地实例上的性能数据。
PoWA-collector是在专用存储库服务器上,用于收集远程PostgreSQL实例性能指标的守护进程。
PoWA-web是PoWA-collector收集到的性能指标的用户展示界面。
其它插件:安装于目标PostgreSQL数据库实例上的其他插件,其是性能指标数据的实际来源。
PoWA:整个系统的总称。
除了pg_stat_statements、btree_gist、powa为必须的插件,PoWA还支持以下几个插件作为新能指标采集的扩展:
pg_qualstats:用于保存在WHERE语句和JOIN子句中发现的谓词的统计信息,powa 利用它来提供索引建议。
pg_stat_kcache:收集有关文件系统层的实际读取和写入的统计信息,可以用于观察SQL花费多少cpu等。
pg_wait_sampling:用于收集等待事件的采样统计信息,启用后它会收集如下两种统计信息:
历史等待事件。它被实现为内存中的环形缓冲区,其中每个进程等待事件的样本都以给定的(可配置的)周期写入。因此,对于每个正在运行的进程,用户可以根据历史大小(可配置)查看一些最近的样本。假设有一个客户端定期读取此历史记录并将其转储到某个地方,则用户可以拥有连续的历史记录。
等待分析,以内存hash表形式存在,表中存放每个进程和每个等待事件累积的样本,该表可以根据用户请求进行reset。假设有一个客户端定期转储并reset,用户可以统计一段时间内等待事件的详细。
pg_track_settings:该插件提供了一个可定期调用的函数(pg_tracksettingssnapshot())。 在每次调用时,它将存储自上次调用以来更改的设置。
Hypopg:类似MySQL虚拟索引。
pg_stat_statements:用于SQL语句监控。
一些连接
文档:https://powa.readthedocs.io/en/latest/
GitHub地址:https://github.com/powa-team
https://github.com/powa-team/powa-archivist
https://github.com/powa-team/powa-web
cpu, io消耗监控
https://github.com/powa-team/pg_stat_kcache
where条件过滤性统计
https://github.com/powa-team/pg_qualstats
官网提供了一个公网的例子,可以在线查看。
地址:https://demo-powa.anayrat.info/
用户名:postgres
密码:postgres
部署架构简介
在生产环境中,我们要做的是竟可能避免单个PG的powa库中的数据量过大。但是我们又要存放一段时间的快照信息用于性能分析,这个类似于Oracle的AWR快照信息。
这个时候我们就需要专门创建一个单独的powa数据库用于存储各个pg采集过来的数据。所以生产环境中我们基本上采取的远程模式部署powa。
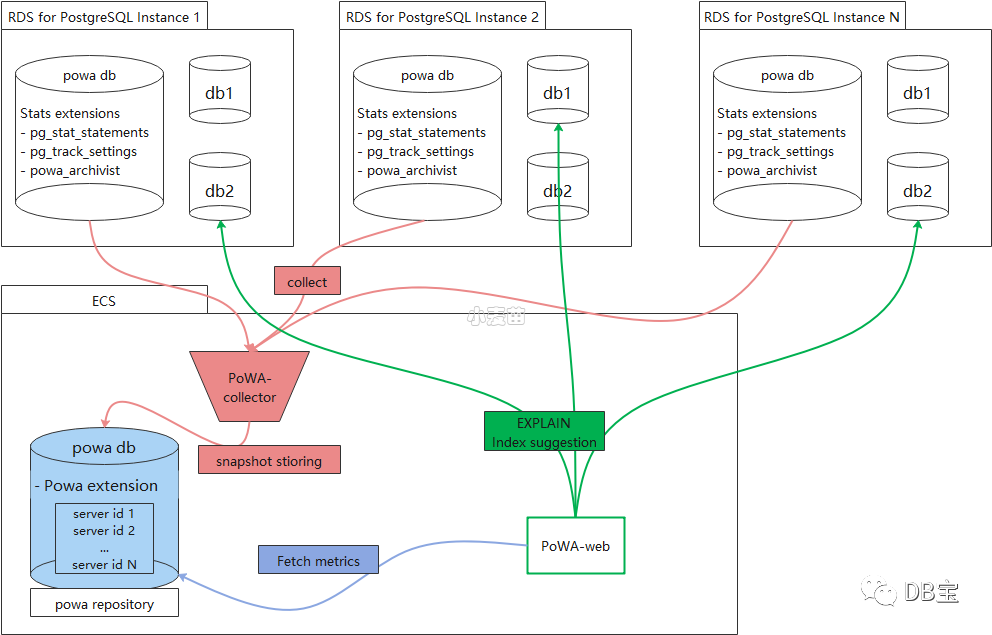
在每个 PG 实例里启用插件,在独立的服务器上部署采集程序 PoWA collector 和主程序 PoWA web。
上面架构图用到的插件简介如下:
pg_stat_statements
:记录指定 PG 实例上所有 SQL 的统计信息,具体数据在视图pg_stat_statements
上。pg_qualstats
:采集 SQL 语句的where
和join
语句中的条件的统计信息。pg_stat_kcache
:采集主机系统指标的统计信息。pg_wait_sampling
:采集 SQL 语句的等待事件,并提供等待事件的汇总统计视图。pg_track_settings
:主要是跟踪实例的参数配置变化。
PoWA-web使用示例
官网提供了一个公网的例子,可以在线查看。
地址:https://demo-powa.anayrat.info/
用户名:postgres
密码:postgres
那它有没有什么风险或者说对数据库服务器有没有什么影响?
PoWA的不足之处就是采集账户权限比较大,且在配置的时候还是明文密码保存。所以需要控制好 PoWA web 和 PG 的访问安全。
存在如下风险或者影响:
PoWA 会对PostgreSQL服务器性能产生很小的负面影响。且很难准确评估这种影响。
如果不使用远程模式,数据将定期存储在本地,所以必须考虑磁盘使用情况,避免影响备份。
在使用远程模式时,powa-repository中配置采集性能指标实例信息需要输入目标实例的IP、帐号及口令,并且可以通过powa_servers表查询到相关信息,其中连接口令以明文形式呈现,存在安全风险。
在PoWA-collector配置文件中,powa-repository的连接信息中无连接口令配置,表示powa-repository对于PoWA-collector的连接配置项必须为trust,存在安全风险。
在PoWA-web配置文件中,可选配置username、password对应powa-repository(远程模式)或者数据库实例(本地模式)的root用户及连接口令,且以明文形式存储,存在安全风险。
那有什么措施杜绝这种风险呢?
建议如下:
检查pg_hba.conf文件,设置只容许相关网段的连接。
不允许用户从外网直接访问PoWA。
不允许用户从外网直接访问PostgreSQL。
在HTTPS服务器上运行PoWA并禁用HTTP访问。
使用SSL保护GUI和PostgreSQL之间的连接,拒绝GUI和PostgreSQL之间不受保护的连接。
建议手动授权专用角色查看powa数据库中的数据。
建议使用依赖其他libpq身份验证方法,杜绝纯文本密码存储,其身份验证方法详见官档https://www.postgresql.org/docs/current/auth-methods.html。
数据库级性能指标
General Overview
图1 General Overview
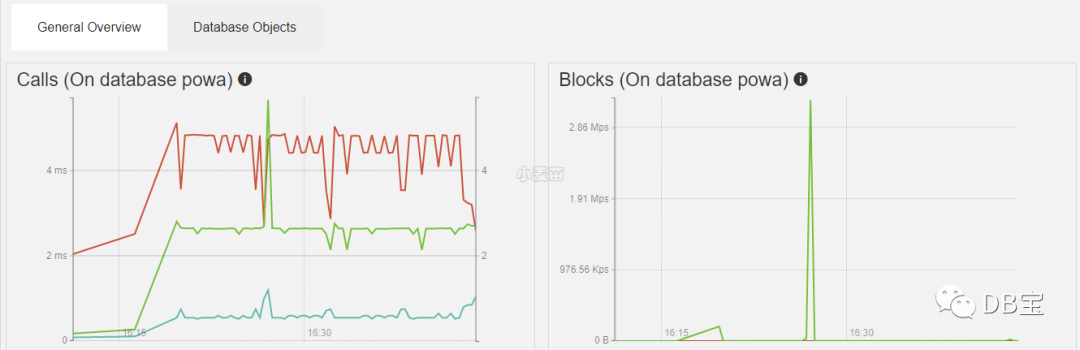
| 字段 | 中文解释 | 英文解释 |
|---|---|---|
| Queries per sec | 每秒执行查询的次数。 | Number of time the query has been executed,per second |
| Runtime per sec | 每秒内执行查询的总耗时。 | Total duration of queries executed,per second |
| Avg runtime | 查询的平均耗时。 | Average query duration |
| 字段 | 中文解释 | 英文解释 |
|---|---|---|
| Total shared buffers hit | 命中共享缓冲区的数据量。 | Amount of data found in shared buffers |
| Total shared buffers miss | 未命中共享缓冲区的数据量。 | Amount of data found in OS cache or read from disk。 |
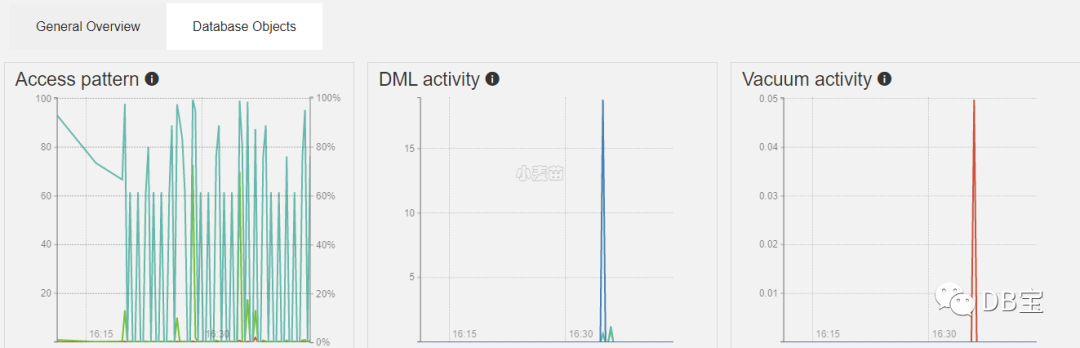
Database Objects
图2 Database Objects
| 字段 | 中文解释 | 英文解释 |
|---|---|---|
| Index scans ratio | 索引扫描/序列扫描的比率。 | Ratio of index scan seq scan |
| Index scans | 每秒索引扫描次数。 | Number of index scan per second |
| Sequential scans | 每秒顺序扫描次数。 | Number of sequential scan per second |
| 字段 | 中文解释 | 英文解释 |
|---|---|---|
| Tuples inserted | 每秒插入的行数。 | Number of tuples inserted per second |
| Tuples updated | 每秒更新的行数。 | Number of tuples updated per second |
| Tuples HOT updated | 每秒更新(HOT)的行数。 | Number of tuples HOT updated per second |
| Tuples deleted | 每秒删除的行数。 | Number of tuples deleted per second |
| 字段 | 中文解释 | 英文解释 |
|---|---|---|
| # Vacuum | 每秒手动清理的次数。 | Number of vacuum per second |
| # Autovacuum | 每秒自动清理的次数。 | Number of autovacuum per second |
| # Analyze | 每秒手动分析的次数。 | Number of analyze per second |
| # Autoanalyze | 每秒自动分析的次数。 | Number of autoanalyze per second |
Details for all databases
图3 Details for all databases
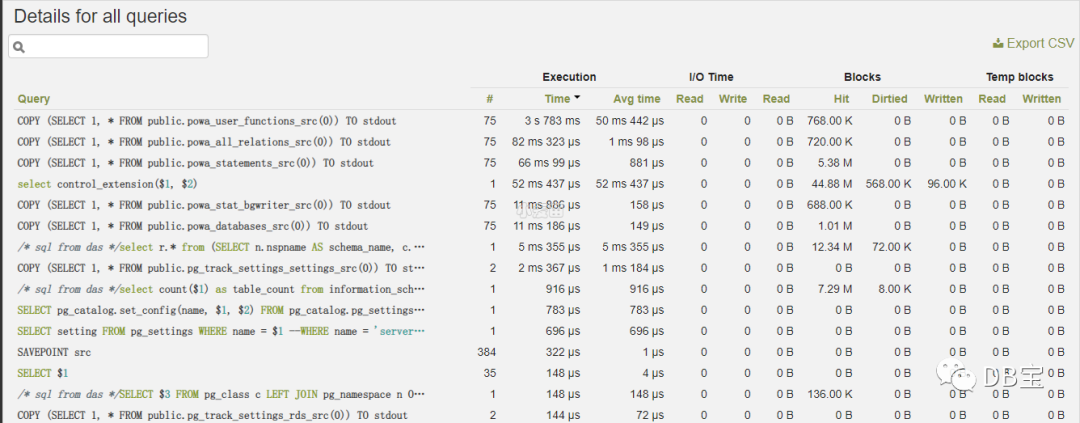
| 字段 | 注释 |
|---|---|
| Query | 执行的SQL。 |
| (Execution) # | 执行该SQL次数。 |
| (Execution) Time | 执行该SQL总时间。 |
| (Execution) Avg time | 执行该SQL平均时间。 |
| (I/O Time) Read | 读I/O等待时间。 |
| (I/O Time) Write | 写I/O等待时间。 |
| (Blocks) Read | 磁盘读页面数。 |
| (Blocks) Hit | 共享缓冲区命中页面数。 |
| (Blocks) Dirtied | 脏页面数。 |
| (Blocks) Written | 磁盘写页面数。 |
| (Temp blocks) Read | 磁盘读临时页面数。 |
| (Temp blocks) Write | 磁盘写临时页面数。 |
实例级性能指标
General Overview
图1 General Overview性能指标
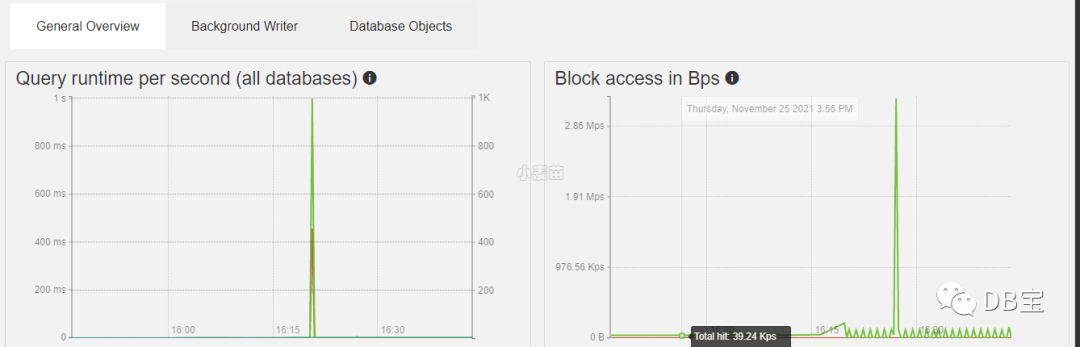
| 字段 | 中文解释 | 英文解释 |
|---|---|---|
| Queries per sec | 每秒执行查询的次数。 | Number of time the query has been executed, per second |
| Runtime per sec | 每秒执行的查询的总持续时间。 | Total duration of queries executed, per second |
| Avg runtime | 平均查询时长。 | Average query duration |
| 字段 | 中文解释 | 英文解释 |
|---|---|---|
| Total hit | 在共享缓冲区中找到的数据量。 | Amount of data found in shared buffers |
| Total read | 在操作系统缓存中找到或从磁盘读取的数据量。 | Amount of data found in OS cache or read from disk |
Background Writer
图2 Background Writer性能指标
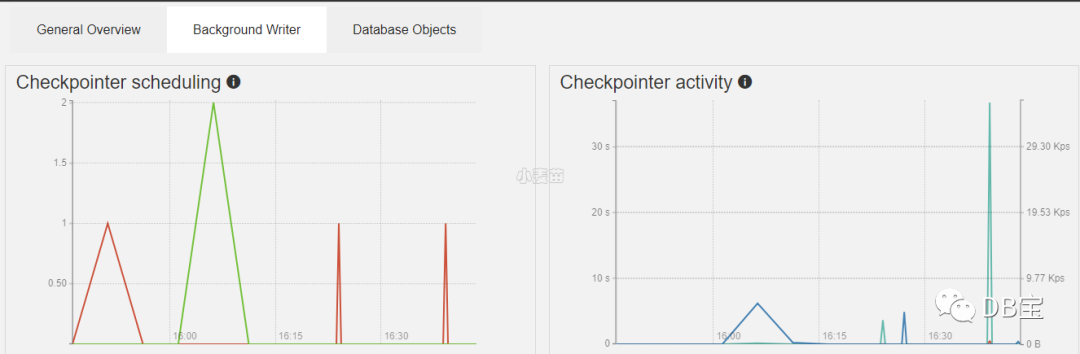
| 字段 | 中文解释 | 英文解释 |
|---|---|---|
| of requested checkpoints | 已执行的请求检查点数。 | Number of requested checkpoints that have been performed |
| of scheduled checkpoints | 已执行的预定检查点数。 | Number of scheduled checkpoints that have been performed |
| 字段 | 中文解释 | 英文解释 |
|---|---|---|
| Buffers alloc | 分配的缓冲区数。 | Number of buffers allocated |
| Sync time | 文件同步到磁盘的检查点处理部分所花费的总时间(单位 : 毫秒)。 | Total amount of time that has been spent in the portion of checkpoint processing where files are synchronized to disk, in milliseconds |
| Write time | 在将文件写入磁盘的检查点处理部分中花费的总时间(单位 : 毫秒)。 | Total amount of time that has been spent in the portion of checkpoint processing where files are written to disk, in milliseconds |
| 字段 | 中文解释 | 英文解释 |
|---|---|---|
| Maxwritten clean | 后台编写器因写入过多缓冲区而停止清理扫描的次数。 | Number of times the background writer stopped a cleaning scan because it had written too many buffers |
| Buffers clean | 后台写入器写入的缓冲区数。 | Number of buffers written by the background writer |
| 字段 | 中文解释 | 英文解释 |
|---|---|---|
| Buffers backend fsync | 后端必须执行自己的 fsync 调用的次数。 | Number of times a backend had to execute its own fsync call (normally the background writer handles those even when the backend does its own write) |
| Buffers backend | 后端直接写入的缓冲区数。 | Number of buffers written directly by a backend |
Database Objects
图3 Database Objects性能指标
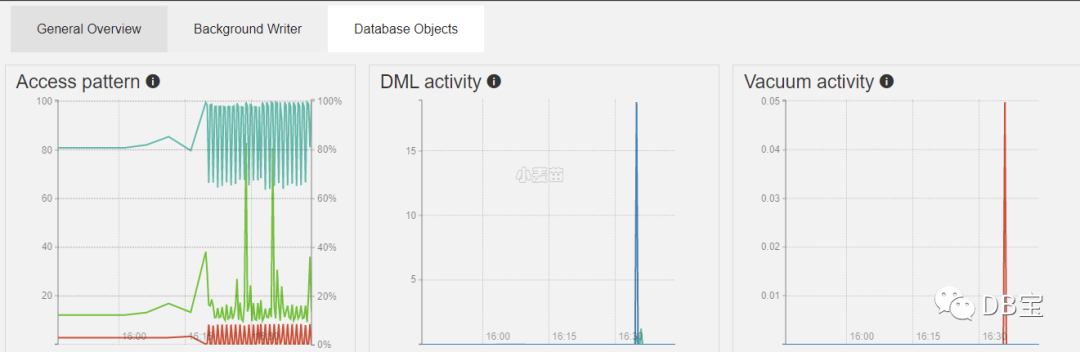
| 字段 | 中文解释 | 英文解释 |
|---|---|---|
| Index scans ratio | 索引扫描/序列扫描的比率。 | Ratio of index scan seq scan |
| Index scans | 每秒索引扫描次数。 | Number of index scan per second |
| Sequential scans | 每秒顺序扫描次数。 | Number of sequential scan per second |
| 字段 | 中文解释 | 英文解释 |
|---|---|---|
| Tuples inserted | 每秒插入的行数。 | Number of tuples inserted per second |
| Tuples updated | 每秒更新的行数。 | Number of tuples updated per second |
| Tuples HOT updated | 每秒更新(HOT)。 | Number of tuples HOT updated per second |
| Tuples deleted | 每秒删除的行数。 | Number of tuples deleted per second |
| 字段 | 中文解释 | 英文解释 |
|---|---|---|
| # Vacuum | 每秒手动清理的次数。 | Number of vacuum per second |
| # Autovacuum | 每秒自动清理的次数。 | Number of autovacuum per second |
| # Analyze | 每秒手动分析的次数。 | Number of analyze per second |
| # Autoanalyze | 每秒自动分析的次数。 | Number of autoanalyze per second |
Details for all databases
图4 Details for all databases性能指标
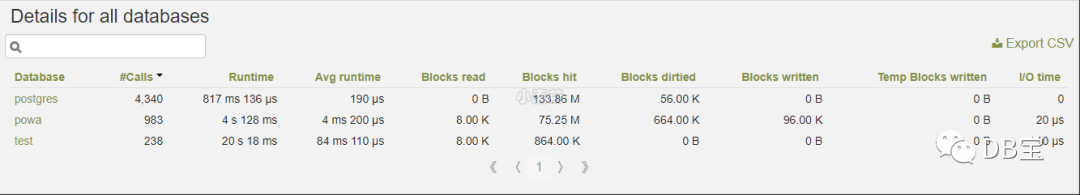
| 字段 | 注释 |
|---|---|
| Database | 数据库名称。 |
| #Calls | 执行SQL总数。 |
| Runtime | 执行SQL总耗时。 |
| Avg runtime | 执行SQL平均耗时。 |
| Blocks read | 磁盘读取的页面数。 |
| Blocks hit | 共享缓冲区命中的页面数。 |
| Blocks dirtied | 脏页数。 |
| Blocks written | 磁盘写页面数。 |
| Temp Blocks written | 磁盘写临时页面数。 |
| I/O time | I/O等待时间。 |
汇总所有插件部署方法
如果要安装所有插件,命令汇总如下。其中 14 是 PG 版本号,需要根据实际情况修改。
1-- Debian
2
3cat > /etc/apt/sources.list <<"EOF"
4deb http://mirrors.ustc.edu.cn/debian stable main contrib non-free
5deb http://mirrors.ustc.edu.cn/debian stable-updates main contrib non-free
6EOF
7
8apt-get update
9
10-- Debian 11还需要添加该源
11deb https://apt-archive.postgresql.org/pub/repos/apt stretch-pgdg main
12
13
14apt install -y curl ca-certificates gnupg sudo wget lsb-release apt-utils dialog
15curl https://www.postgresql.org/media/keys/ACCC4CF8.asc | gpg --dearmor | sudo tee /etc/apt/trusted.gpg.d/apt.postgresql.org.gpg >/dev/null
16sudo sh -c 'echo "deb http://apt.postgresql.org/pub/repos/apt $(lsb_release -cs)-pgdg main" > /etc/apt/sources.list.d/pgdg.list'
17sudo apt update
18
19
20apt-get install -y postgresql-14-powa postgresql-14-pg-track-settings \
21postgresql-14-pg-qualstats postgresql-14-pg-stat-kcache \
22postgresql-14-hypopg postgresql-14-pg-wait-sampling
23
24
25
26-- yum安装
27yum install -y powa_14 powa_14-web pg_qualstats_14 pg_stat_kcache_14 hypopg_14
28
29
30-- collector需要单独安装复制
然后创建数据库 powa
并在下面创建相应扩展
1create database powa;
2\c powa
3CREATE EXTENSION pg_stat_statements;
4CREATE EXTENSION btree_gist;
5CREATE EXTENSION powa;
6CREATE EXTENSION pg_qualstats;
7CREATE EXTENSION pg_stat_kcache;
8CREATE EXTENSION pg_wait_sampling;
9CREATE EXTENSION pg_track_settings;
10CREATE EXTENSION hypopg;
11CREATE ROLE powa SUPERUSER LOGIN PASSWORD 'lhr' ;复制
修改配置文件 postgresql.conf
并重启 PG 实例。
1show data_directory;
2
3cat >> /var/lib/postgresql/data/postgresql.conf <<"EOF"
4shared_preload_libraries = 'pg_stat_statements,powa,pg_qualstats,pg_stat_kcache,pg_wait_sampling'
5
6# Add settings for extensions here
7pg_stat_statements.max = 10000
8track_io_timing = on
9pg_qualstats.enabled = true
10pg_qualstats.max = 10000
11pg_qualstats.track_pg_catalog = false
12pg_qualstats.resolve_oids = false
13pg_qualstats.track_constants = true
14pg_qualstats.sample_rate = 0.1
15pg_wait_sampling.profile_period = 50
16pg_wait_sampling.profile_pid = true
17pg_wait_sampling.profile_queries = true
18EOF复制
重启实例后,在数据库 powa
里再运行下面语句。
1SELECT powa_kcache_register();
2SELECT powa_wait_sampling_register();
3SELECT powa_track_settings_register();复制
查看所有插件情况
1powa=# \dx
2 List of installed extensions
3 Name | Version | Schema | Description
4--------------------+---------+------------+------------------------------------------------------------------------
5 btree_gist | 1.7 | public | support for indexing common datatypes in GiST
6 hypopg | 1.3.1 | public | Hypothetical indexes for PostgreSQL
7 pg_qualstats | 2.0.4 | public | An extension collecting statistics about quals
8 pg_stat_kcache | 2.2.1 | public | Kernel statistics gathering
9 pg_stat_statements | 1.10 | public | track planning and execution statistics of all SQL statements executed
10 pg_track_settings | 2.1.0 | public | Track settings changes
11 pg_wait_sampling | 1.1 | public | sampling based statistics of wait events
12 plpgsql | 1.0 | pg_catalog | PL/pgSQL procedural language
13 powa | 4.1.4 | public | PostgreSQL Workload Analyser-core
14(9 rows)
15
16powa=#复制
在需要监控的其它数据库中都执行如下的SQL:
1CREATE EXTENSION pg_stat_statements;
2CREATE EXTENSION btree_gist;
3CREATE EXTENSION powa;
4CREATE EXTENSION pg_qualstats;
5CREATE EXTENSION pg_stat_kcache;
6CREATE EXTENSION pg_wait_sampling;
7CREATE EXTENSION pg_track_settings;
8CREATE EXTENSION hypopg;
9
10
11SELECT powa_kcache_register();
12SELECT powa_wait_sampling_register();
13SELECT powa_track_settings_register();复制
PoWA web 部署介绍
https://github.com/powa-team/powa-web
在 debian 系统上 ,powa-web 包跟 PG 版本无关。
1apt-get install python-pip python-dev
2apt-get -y install powa-web
3
4
5pip3 install psycopg2
6pip3 install powa-web
7
8
9-- 编译安装
10wget https://pypi.io/packages/source/p/powa-web/powa-web-4.1.3.tar.gz
11tar -zxvf powa-web-4.1.3.tar.gz
12cd powa-web-4.1.3
13cp ./powa-web.conf-dist ./powa-web.conf
14./powa-web复制
在 CentOS/Linux 系统上,powa-web 包跟 PG 版本有关。
1yum install python-pip python-devel
2yum -y install powa_14-web
3
4
5sudo pip install powa-web复制
配置 PoWA web
1cat > /etc/powa-web.conf <<"EOF"
2servers={
3 'main': {
4 'host': '127.0.0.1',
5 'port': '5432',
6 'database': 'powa',
7 'username': 'powa',
8 'password': 'lhr',
9 'query': {'client_encoding': 'utf8'}
10 }
11}
12cookie_secret="SECRET_STRING"
13port=8808
14EOF复制
注意,监听端口是 8808 ,默认为8888
The following options are optional:
port (int):
The port on which the UI will be available (default 8888)
address (str):
The IP address on which the UI will be available (default 0.0.0.0)
powa-web文件为一个python格式文件。Powa-web 将按以下顺序将其配置搜索为这些文件中的任何一个:
1/etc/powa-web.conf
2~/.config/powa-web.conf
3~/.powa-web.conf
4./powa-web.conf复制
启动 PoWA web
1nohup powa-web 2>&1 1>/tmp/powa-web.log &复制
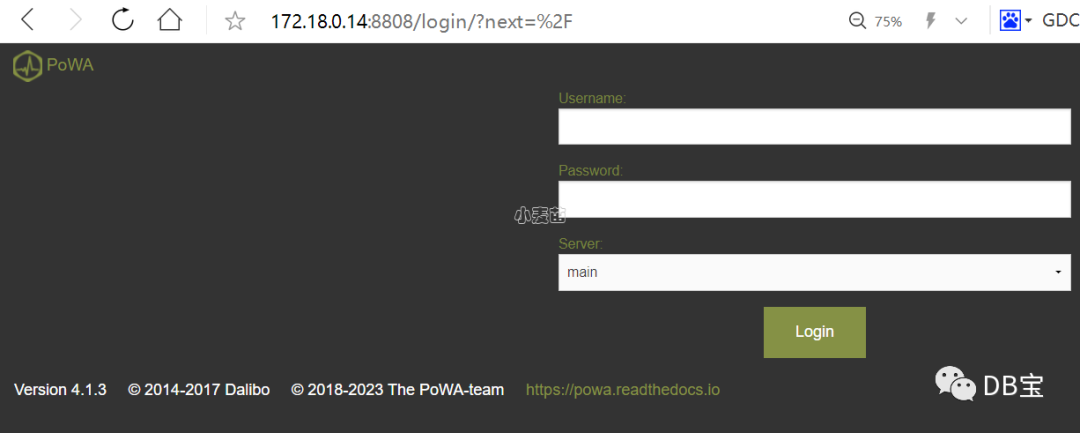
登录
网址:http://172.18.0.14:8808
用户名和密码就是元数据库 powa
的访问账号。
PoWA collector 部署介绍
https://pypi.org/project/powa-collector/
https://files.pythonhosted.org/packages/47/cb/f29fd02912e37aedb11de8a2f36cd1825411009a396fa659ea05d26893a5/powa-collector-1.2.0.tar.gz
一个多线程python程序,它对在powa存储库数据库(在powa_servers表中)中配置的所有远程服务器执行快照收集。可以使用pip、RPM包或手动安装PoWA-collector。
安装方法
1-- Debian
2apt-get -y install python3 python3-psycopg2
3apt-get -y install powa-collector
4
5
6-- yum安装的是1.1.0,建议使用pip3安装
7yum install powa-collector
8
9
10
11mkdir ~/.pip
12cat > ~/.pip/pip.conf << EOF
13[global]
14timeout = 6000
15index-url = http://mirrors.aliyun.com/pypi/simple/
16index-index-url = http://pypi.douban.com/simple/
17[install]
18trusted-host =
19 mirrors.aliyun.com
20 pypi.douban.com
21EOF
22
23pip3 install psycopg2
24pip3 install powa-collector
25
26
27
28-- 编译安装
29wget https://pypi.io/packages/source/p/powa-collector/powa-collector-1.2.0.tar.gz
30tar -zxvf powa-collector-1.2.0.tar.gz
31cp ./powa-collector.conf-dist ./powa-collector.conf
32./powa-collector
33
34
35-- 配置
36cat > /etc/powa-collector.conf <<"EOF"
37{
38 "repository": {
39 "dsn": "postgresql://powa@127.0.0.1:5432/powa"
40 },
41 "debug": false
42}
43EOF
44
45
46nohup powa-collector.py 2>&1 1>/tmp/powa-collector.log &
47
48-- 或systemctl status powa-collector.service
49/usr/bin/powa-collector复制
配置方法
通过调整配置文件使其能够连接到想要的PoWA存储库上。其配置文件为一个的JSON格式的文件。
Powa-collector 将按以下顺序将其配置搜索为以下文件之一:
1/etc/powa-collector.conf
2~/.config/powa-collector.conf
3~/.powa-collector.conf
4./powa-collector.conf复制
1cat > /etc/powa-collector.conf <<"EOF"
2{
3 "repository": {
4 "dsn": "postgresql://powa@127.0.0.1:5432/powa"
5 },
6 "debug": false
7}
8EOF复制
运行 PoWA collector
1nohup powa-collector.py 2>&1 1>/tmp/powa-collector.log &复制
释义:
repository.dsn(字符串):
连接的URI,用于告诉 powa-collector 如何连接专用存储库 powa 数据库来存储所有远程实例的数据。
以下选项是可选的:
debug(布尔值):
一个布尔值,用于指定 powa-collector 是否应在调试模式下启动,提供更详细的输出,用于调试目的。
注:PoWA-collector 的配置中并没有密码的配置,所以powa-repository数据库的pg_hba.conf中需要配置对应的连接策略为trust免密连接。
配置需要采集性能指标的实例信息
1-- 配置需要采集性能指标的实例信息
2select powa_register_server(
3hostname => '172.71.0.23',
4alias => '172.71.0.23',
5port => 5432,
6username => 'postgres',
7password => 'lhr',
8frequency => 300,
9retention => '30 day'::interval ,
10extensions => '{pg_stat_statements,pg_qualstats,pg_stat_kcache,pg_wait_sampling,pg_track_settings}');
11
12
13-- 查看当前采集指标信息实例的信息
14select * from powa_servers;
15
16
17powa=# select * from powa_servers;
18 id | hostname | alias | port | username | password | dbname | frequency | powa_coalesce | retention | allow_ui_connection | version
19----+-------------+-------------+------+----------+----------+--------+-----------+---------------+-----------+---------------------+---------
20 0 | | <local> | 0 | | | | -1 | 100 | 00:00:00 | t |
21 1 | 172.71.0.23 | 172.71.0.23 | 5432 | postgres | lhr | powa | 300 | 100 | 1 day | t |
22(2 rows)
23
24powa=#复制
如果要增加扩展,方法如下:
1SELECT powa_activate_extension(2, 'pg_track_settings');复制
若要删除:
1SELECT powa_delete_and_purge_server(1);复制
修改:
1SELECT powa_configure_server(7, '{"frequency": "30"}');复制
释义:
hostname
强制,默认NULL。远程 PostgreSQL 实例的主机名或 IP 地址。
port
强制,默认5432。远程 PostgreSQL 实例的端口。
alias
可选,默认NULL。远程 PostgreSQL 实例的用户友好别名(需要唯一)。
username
强制,默认'powa'。用于连接远程 PostgreSQL 实例的用户的用户名。
password
可选,默认NULL。用于连接远程 PostgreSQL 实例的用户密码。如果未提供密码,则连接可以回退到其他标准身份验证方法(.pgpass 文件、证书……),
具体取决于远程服务器的配置方式。
dbname
强制,默认'powa'。用于连接远程 PostgreSQL 实例的数据库。
frequency
强制,默认300,远程服务器的快照间隔,单位为秒。
retention
强制,默认'1 day'::interval。远程服务器的数据保留。
总结
1、插件需要在每一个被监控的数据库上都要创建
2、安装可以直接参考汇总部分即可,PoWA web和collector部分只需要在repository库执行即可。
参考
https://www.xmmup.com/pgxingnengcaijifenxigongjuzhipowajieshao.html
https://powa.readthedocs.io/en/latest/
https://powa.readthedocs.io/en/latest/quickstart.html
https://mp.weixin.qq.com/s/yla0G79pYRnZJ7cB-iI0lQ
https://pgfans.cn/a/1111
https://www.modb.pro/db/405306
https://www.modb.pro/db/452080
https://www.modb.pro/db/383587
https://support.huaweicloud.com/bestpractice-rds/rds_pg_0024.html
